
12 Best Stock Picks for Profitable Growth - October 2025 analysis
Welcome to the Value Sense Blog, your resource for insights on the stock market! At Value Sense, we focus on intrinsic value tools and offer stock ideas with undervalued companies. Dive into our research products and learn more about our unique approach at valuesense.io
Explore diverse stock ideas covering technology, healthcare, and commodities sectors. Our insights are crafted to help investors spot opportunities in undervalued growth stocks, enhancing potential returns. Visit us to see evaluations and in-depth market research.
Market Overview & Selection Criteria
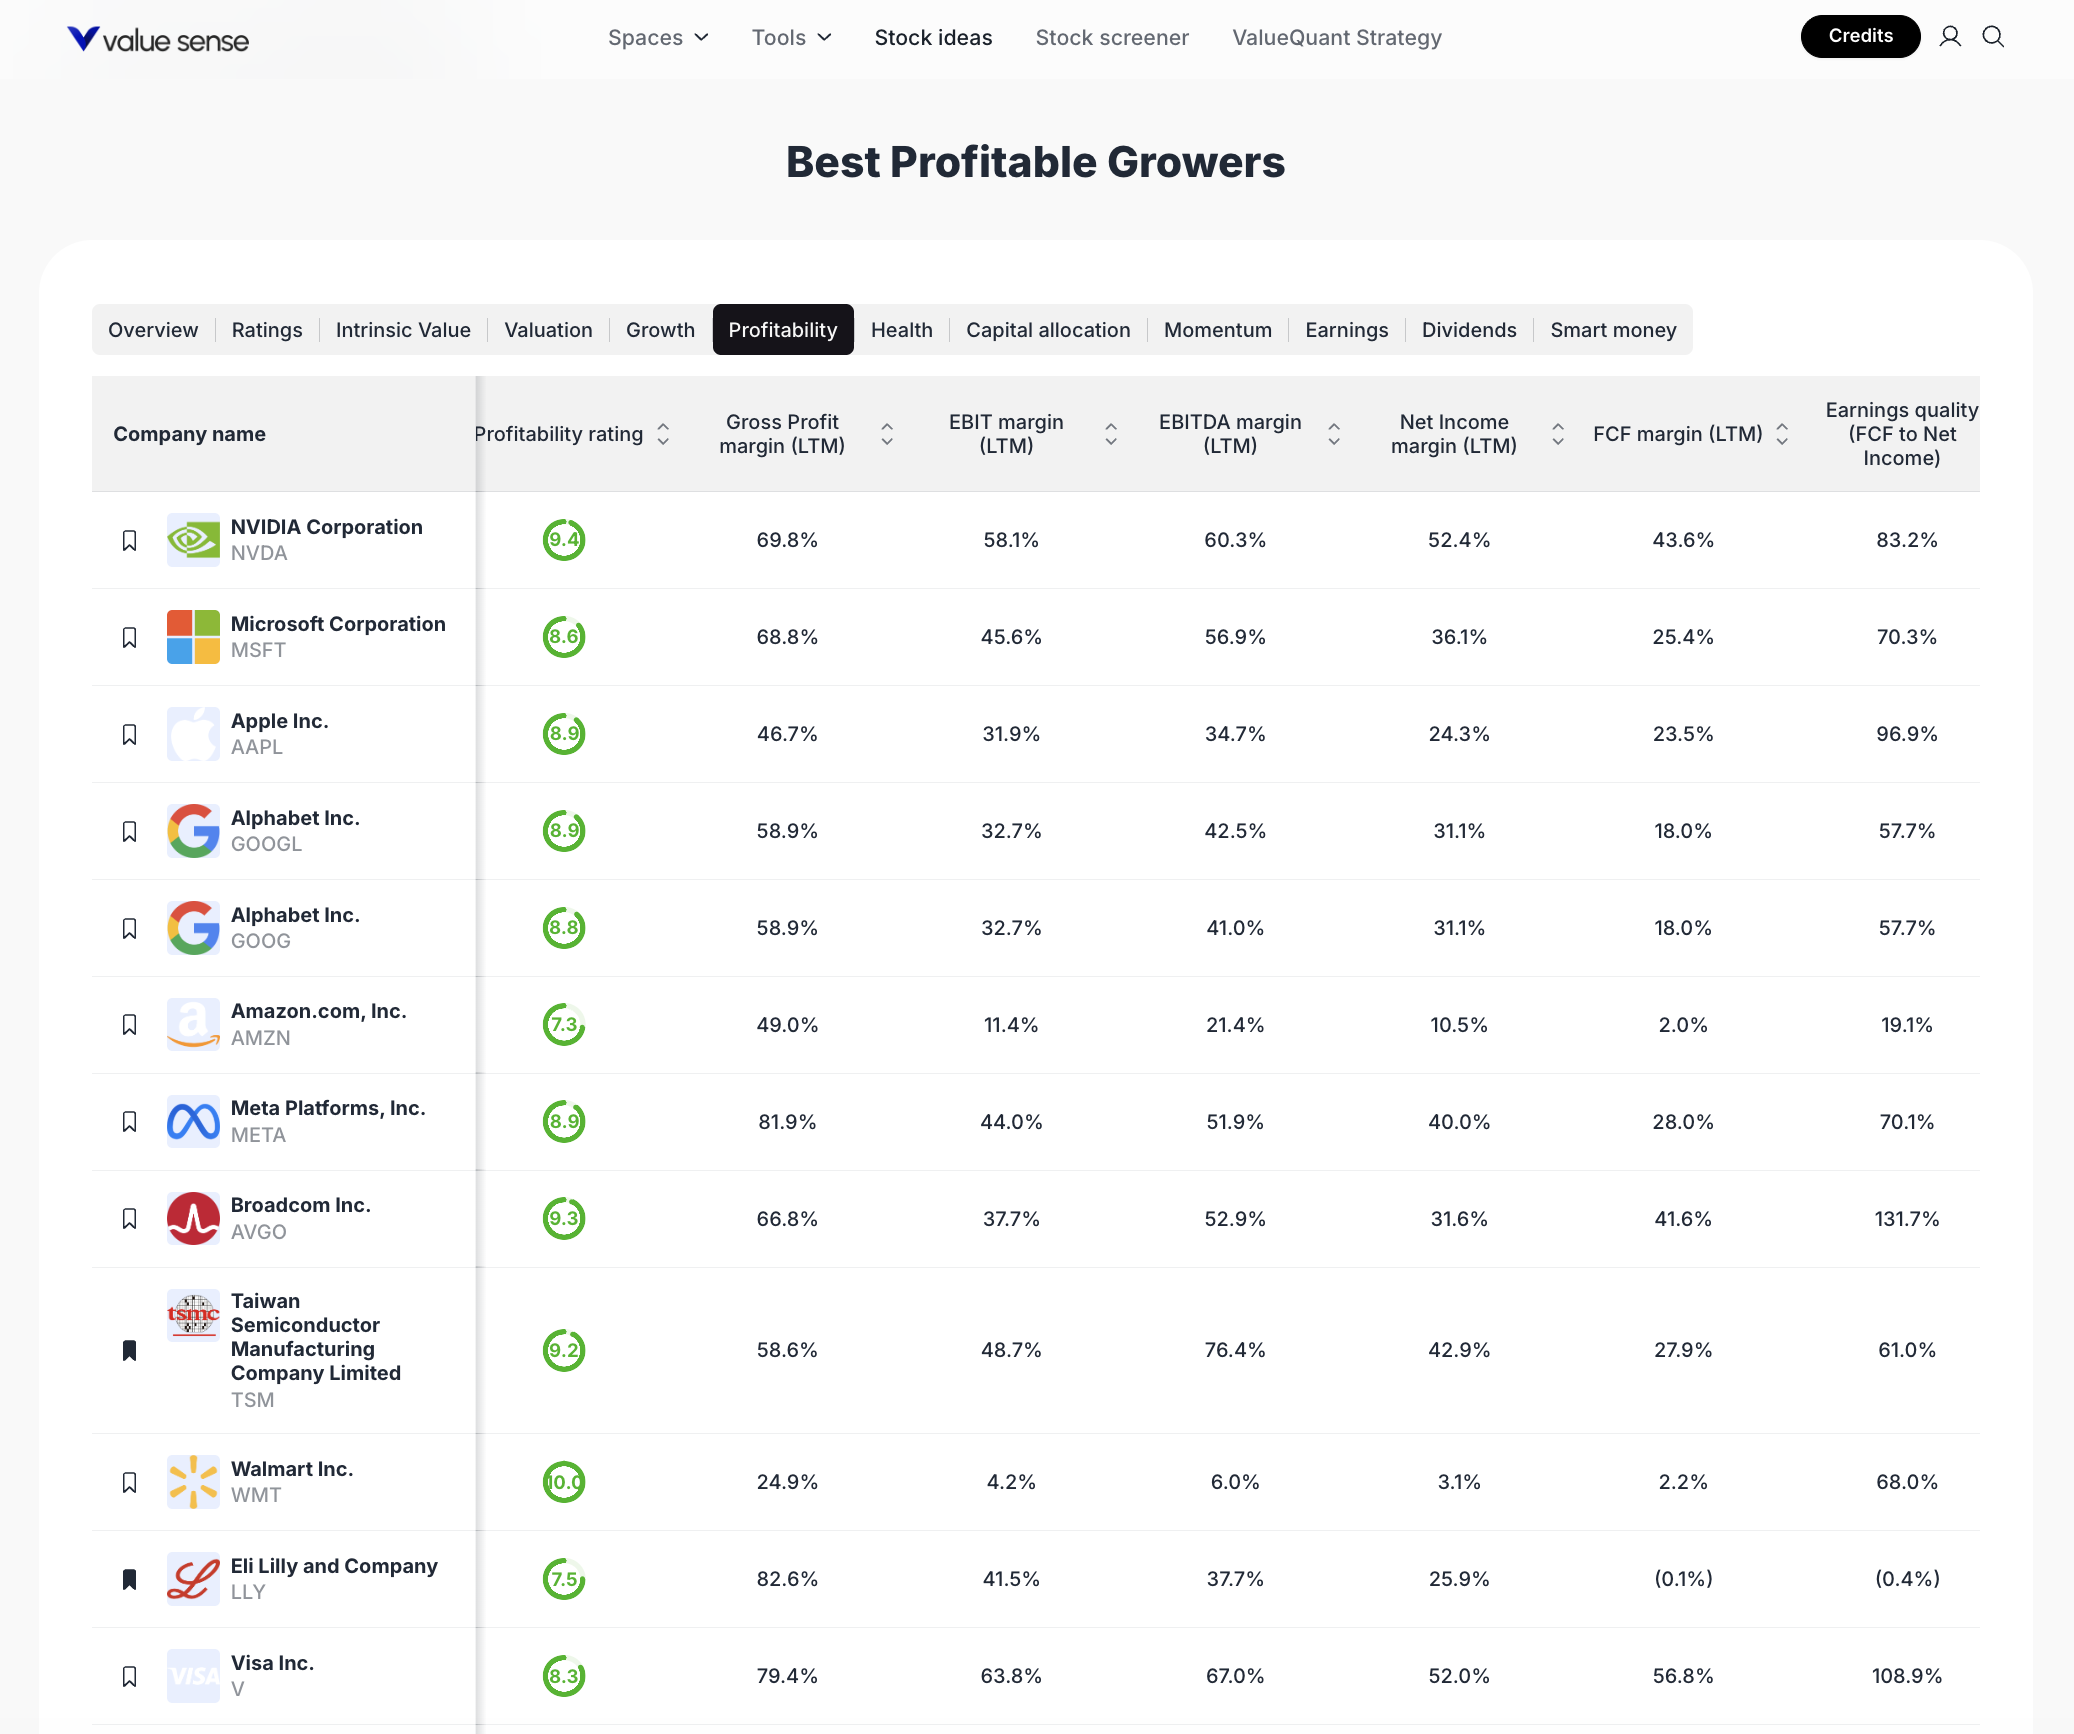
The current market environment is characterized by robust earnings growth in technology, healthcare, and select consumer sectors, with profitability and free cash flow quality emerging as key differentiators. Our selection methodology prioritizes companies with high profitability ratings, strong margins across gross, EBIT, EBITDA, and net income, as well as healthy free cash flow conversion. Each stock featured below is extracted from ValueSense’s “Best Profitable Growers” list, ensuring a data-driven, sector-diverse watchlist for investors seeking resilient growth.
Full stock idea --> https://valuesense.io/ideas/browse/profitable-growers
Featured Stock Analysis
Stock #1: NVIDIA Corporation (NVDA)
- Quick Stats Table:
| Metric | Value |
|---|---|
| Profitability Rating | 9.4 |
| Gross Profit Margin (LTM) | 69.8% |
| EBIT Margin (LTM) | 58.1% |
| EBITDA Margin (LTM) | 60.3% |
| Net Income Margin (LTM) | 52.4% |
| FCF Margin (LTM) | 43.6% |
| Earnings Quality | 83.2% |
- Investment Thesis:
NVIDIA stands out as the premier growth engine in the semiconductor sector, driven by its leadership in AI, data center, and graphics processing. The company’s exceptional profitability metrics—highlighted by a 52.4% net income margin and 43.6% free cash flow margin—underscore its operational efficiency and pricing power. With a profitability rating of 9.4, NVIDIA’s ability to convert revenue into bottom-line profit is unmatched among peers. The company’s robust gross and EBITDA margins reflect both high demand and disciplined cost management, positioning it as a core holding for growth-focused portfolios. - Key Catalysts:
- Accelerating adoption of AI and machine learning across industries
- Expansion in data center and cloud infrastructure markets
- New product launches in gaming and enterprise GPUs
- Strategic partnerships and ecosystem development
- Risk Factors:
- Cyclical demand in semiconductor industry
- Geopolitical risks affecting supply chain and export controls
- Competitive pressures from AMD, Intel, and emerging players
Stock #2: Microsoft Corporation (MSFT)
- Quick Stats Table:
| Metric | Value |
|---|---|
| Profitability Rating | 8.6 |
| Gross Profit Margin (LTM) | 68.8% |
| EBIT Margin (LTM) | 45.6% |
| EBITDA Margin (LTM) | 56.9% |
| Net Income Margin (LTM) | 36.1% |
| FCF Margin (LTM) | 25.4% |
| Earnings Quality | 70.3% |
- Investment Thesis:
Microsoft continues to deliver consistent growth through its diversified business model, spanning cloud computing (Azure), productivity software (Office 365), and enterprise solutions. The company’s high gross and EBIT margins reflect its dominant market position and recurring revenue streams. With a profitability rating of 8.6, Microsoft’s ability to generate free cash flow and reinvest in innovation supports long-term growth. Its strong net income margin and robust earnings quality further reinforce its status as a blue-chip technology leader. - Key Catalysts:
- Ongoing migration to cloud services and digital transformation
- Expansion of AI capabilities across product lines
- Growth in enterprise and government contracts
- Strategic acquisitions and ecosystem integration
- Risk Factors:
- Regulatory scrutiny in the US and EU
- Intense competition in cloud and productivity software
- Currency fluctuations impacting international revenue
Stock #3: Apple Inc. (AAPL)
- Quick Stats Table:
| Metric | Value |
|---|---|
| Profitability Rating | 8.9 |
| Gross Profit Margin (LTM) | 46.7% |
| EBIT Margin (LTM) | 31.9% |
| EBITDA Margin (LTM) | 34.7% |
| Net Income Margin (LTM) | 24.3% |
| FCF Margin (LTM) | 23.5% |
| Earnings Quality | 96.9% |
- Investment Thesis:
Apple’s ecosystem-driven business model ensures steady revenue growth and high customer retention. The company’s profitability metrics, including a 46.7% gross margin and 24.3% net income margin, highlight its ability to command premium pricing and maintain operational efficiency. With a profitability rating of 8.9 and exceptional earnings quality, Apple’s consistent free cash flow generation supports ongoing innovation, share repurchases, and dividend growth. - Key Catalysts:
- New product cycles in iPhone, Mac, and wearables
- Expansion of services and subscription revenue
- Growth in emerging markets
- Continued ecosystem integration
- Risk Factors:
- Supply chain disruptions and component shortages
- Regulatory risks related to App Store practices
- Slower upgrade cycles in mature markets
Stock #4: Alphabet Inc. (GOOGL)
- Quick Stats Table:
| Metric | Value |
|---|---|
| Profitability Rating | 8.9 |
| Gross Profit Margin (LTM) | 58.9% |
| EBIT Margin (LTM) | 32.7% |
| EBITDA Margin (LTM) | 42.5% |
| Net Income Margin (LTM) | 31.1% |
| FCF Margin (LTM) | 18.0% |
| Earnings Quality | 57.7% |
- Investment Thesis:
Alphabet remains a dominant force in digital advertising, cloud computing, and AI-driven services. Its high gross and net income margins, along with a profitability rating of 8.9, reflect strong monetization of its core platforms. Alphabet’s continued investment in AI, cloud, and “Other Bets” positions it for long-term growth, while its robust balance sheet provides flexibility for strategic initiatives. - Key Catalysts:
- Growth in Google Cloud and AI services
- Expansion of YouTube and digital advertising
- Monetization of new products and platforms
- Strategic investments in emerging technologies
- Risk Factors:
- Regulatory and antitrust scrutiny globally
- Cyclical advertising demand
- Rising competition in cloud and AI
Stock #5: Alphabet Inc. (GOOG)
- Quick Stats Table:
| Metric | Value |
|---|---|
| Profitability Rating | 8.8 |
| Gross Profit Margin (LTM) | 58.9% |
| EBIT Margin (LTM) | 32.7% |
| EBITDA Margin (LTM) | 41.0% |
| Net Income Margin (LTM) | 31.1% |
| FCF Margin (LTM) | 18.0% |
| Earnings Quality | 57.7% |
- Investment Thesis:
GOOG shares represent the same economic interests as GOOGL, with identical profitability and margin profiles. Investors may choose between the two based on voting rights or liquidity preferences. The company’s strong financials and innovation pipeline continue to drive value creation. - Key Catalysts:
- Same as GOOGL
- Risk Factors:
- Same as GOOGL
Stock #6: Amazon.com, Inc. (AMZN)
- Quick Stats Table:
| Metric | Value |
|---|---|
| Profitability Rating | 7.3 |
| Gross Profit Margin (LTM) | 49.0% |
| EBIT Margin (LTM) | 11.4% |
| EBITDA Margin (LTM) | 21.4% |
| Net Income Margin (LTM) | 10.5% |
| FCF Margin (LTM) | 2.0% |
| Earnings Quality | 19.1% |
- Investment Thesis:
Amazon’s scale and diversification across e-commerce, cloud computing (AWS), and digital services drive its growth trajectory. While its net income and free cash flow margins are lower than peers, the company’s reinvestment strategy supports long-term expansion. Amazon’s profitability rating of 7.3 reflects its ability to generate operating leverage as it scales, with AWS remaining a key profit engine. - Key Catalysts:
- Growth in AWS cloud services
- Expansion in advertising and subscription revenue
- Efficiency gains in logistics and fulfillment
- International market penetration
- Risk Factors:
- Margin pressure from heavy reinvestment
- Regulatory scrutiny in multiple regions
- Competitive threats in core markets
Stock #7: Meta Platforms, Inc. (META)
- Quick Stats Table:
| Metric | Value |
|---|---|
| Profitability Rating | 8.9 |
| Gross Profit Margin (LTM) | 81.9% |
| EBIT Margin (LTM) | 44.0% |
| EBITDA Margin (LTM) | 51.9% |
| Net Income Margin (LTM) | 40.0% |
| FCF Margin (LTM) | 28.0% |
| Earnings Quality | 70.1% |
- Investment Thesis:
Meta Platforms leverages its vast user base and advertising ecosystem to deliver industry-leading profitability. With a gross margin of 81.9% and net income margin of 40%, Meta’s business model is highly scalable. The company’s ongoing investments in AI, virtual reality, and the metaverse aim to unlock new growth avenues, while its profitability rating of 8.9 signals strong operational execution. - Key Catalysts:
- Growth in digital advertising and commerce
- Expansion of AI and machine learning applications
- Monetization of new platforms (Reels, Threads, VR)
- Cost optimization initiatives
- Risk Factors:
- Regulatory and privacy challenges
- Shifts in user engagement and platform trends
- Competition from emerging social platforms
Stock #8: Broadcom Inc. (AVGO)
- Quick Stats Table:
| Metric | Value |
|---|---|
| Profitability Rating | 9.3 |
| Gross Profit Margin (LTM) | 66.8% |
| EBIT Margin (LTM) | 37.7% |
| EBITDA Margin (LTM) | 52.9% |
| Net Income Margin (LTM) | 31.6% |
| FCF Margin (LTM) | 41.6% |
| Earnings Quality | 131.7% |
- Investment Thesis:
Broadcom’s diversified semiconductor and infrastructure software portfolio delivers high profitability and cash flow generation. The company’s 41.6% free cash flow margin and 9.3 profitability rating highlight its efficient capital allocation and strong market position. Broadcom’s focus on mission-critical products and strategic acquisitions supports sustained growth and shareholder returns. - Key Catalysts:
- Expansion in networking, storage, and wireless markets
- Strategic M&A activity
- Growth in cloud and data center demand
- New product launches
- Risk Factors:
- Customer concentration risk
- Integration challenges from acquisitions
- Cyclical industry dynamics
Stock #9: Taiwan Semiconductor Manufacturing Company Limited (TSM)
- Quick Stats Table:
| Metric | Value |
|---|---|
| Profitability Rating | 6.2 |
| Gross Profit Margin (LTM) | 58.6% |
| EBIT Margin (LTM) | 48.7% |
| EBITDA Margin (LTM) | 76.4% |
| Net Income Margin (LTM) | 42.9% |
| FCF Margin (LTM) | 27.9% |
| Earnings Quality | 61.0% |
- Investment Thesis:
TSMC is the world’s leading semiconductor foundry, enabling innovation for global technology leaders. Its high gross and EBITDA margins reflect strong demand for advanced chip manufacturing. With a profitability rating of 6.2, TSMC’s operational scale and technological leadership underpin its growth prospects, despite cyclical industry headwinds. - Key Catalysts:
- Rising demand for advanced process nodes (5nm, 3nm)
- Expansion in automotive and IoT applications
- Strategic partnerships with leading chip designers
- Capacity expansion initiatives
- Risk Factors:
- Geopolitical tensions and supply chain risks
- Capital intensity of semiconductor manufacturing
- Customer concentration
Stock #10: Walmart Inc. (WMT)
- Quick Stats Table:
| Metric | Value |
|---|---|
| Profitability Rating | 0.0 |
| Gross Profit Margin (LTM) | 24.9% |
| EBIT Margin (LTM) | 4.2% |
| EBITDA Margin (LTM) | 6.0% |
| Net Income Margin (LTM) | 3.1% |
| FCF Margin (LTM) | 2.2% |
| Earnings Quality | 68.0% |
- Investment Thesis:
Walmart remains a global retail leader, leveraging scale and supply chain efficiency to maintain steady profitability. While its margins are lower than tech peers, Walmart’s resilience in consumer staples and omnichannel strategy support stable cash flows. Its profitability rating reflects the competitive nature of retail, but its defensive qualities make it a core holding for risk-averse investors. - Key Catalysts:
- Expansion of e-commerce and digital platforms
- Supply chain optimization
- Growth in private label and international markets
- Cost management initiatives
- Risk Factors:
- Margin pressure from competition and inflation
- Labor and regulatory challenges
- Shifts in consumer spending patterns
Stock #11: Eli Lilly and Company (LLY)
- Quick Stats Table:
| Metric | Value |
|---|---|
| Profitability Rating | 7.5 |
| Gross Profit Margin (LTM) | 82.6% |
| EBIT Margin (LTM) | 41.5% |
| EBITDA Margin (LTM) | 37.7% |
| Net Income Margin (LTM) | 25.9% |
| FCF Margin (LTM) | -0.1% |
| Earnings Quality | -0.4% |
- Investment Thesis:
Eli Lilly is a leading pharmaceutical innovator, with high gross and EBIT margins reflecting strong pricing power and product mix. The company’s profitability rating of 7.5 and robust margins are offset by recent free cash flow challenges, likely due to R&D investments or product launches. Its pipeline and leadership in diabetes and oncology support long-term growth. - Key Catalysts:
- New drug approvals and pipeline progress
- Expansion in diabetes and obesity treatments
- Strategic partnerships and acquisitions
- International market growth
- Risk Factors:
- Patent expirations and generic competition
- Regulatory and pricing pressures
- R&D execution risks
Stock #12: Visa Inc. (V)
- Quick Stats Table:
| Metric | Value |
|---|---|
| Profitability Rating | 6.3 |
| Gross Profit Margin (LTM) | 79.4% |
| EBIT Margin (LTM) | 63.8% |
| EBITDA Margin (LTM) | 67.0% |
| Net Income Margin (LTM) | 52.0% |
| FCF Margin (LTM) | 56.8% |
| Earnings Quality | 108.9% |
- Investment Thesis:
Visa’s global payments network delivers industry-leading profitability, with a 52% net income margin and 56.8% free cash flow margin. The company’s profitability rating of 6.3 is supported by high operating leverage and recurring transaction revenue. Visa’s scale, brand, and innovation in digital payments position it for continued growth as cashless transactions expand worldwide. - Key Catalysts:
- Growth in global digital payments
- Expansion in B2B and cross-border transactions
- New fintech partnerships and solutions
- Secular shift from cash to electronic payments
- Risk Factors:
- Regulatory and antitrust scrutiny
- Cybersecurity and fraud risks
- Competition from alternative payment platforms
Portfolio Diversification Insights
This collection spans technology, healthcare, consumer staples, and financials, offering exposure to both high-growth and defensive sectors. Technology and semiconductor names (NVDA, MSFT, AAPL, GOOGL, GOOG, AVGO, TSM, META, AMZN) provide growth and innovation, while healthcare (LLY), consumer staples (WMT), and financials (V) add stability and diversification. The portfolio’s sector allocation balances cyclical growth with defensive resilience, reducing overall risk.
Market Timing & Entry Strategies
Investors may consider phased entry strategies, such as dollar-cost averaging, to manage volatility and market timing risks. Monitoring earnings reports, macroeconomic data, and sector trends can help refine entry points. Diversifying across these stocks can help smooth returns and capture opportunities as market leadership rotates.
Explore More Investment Opportunities
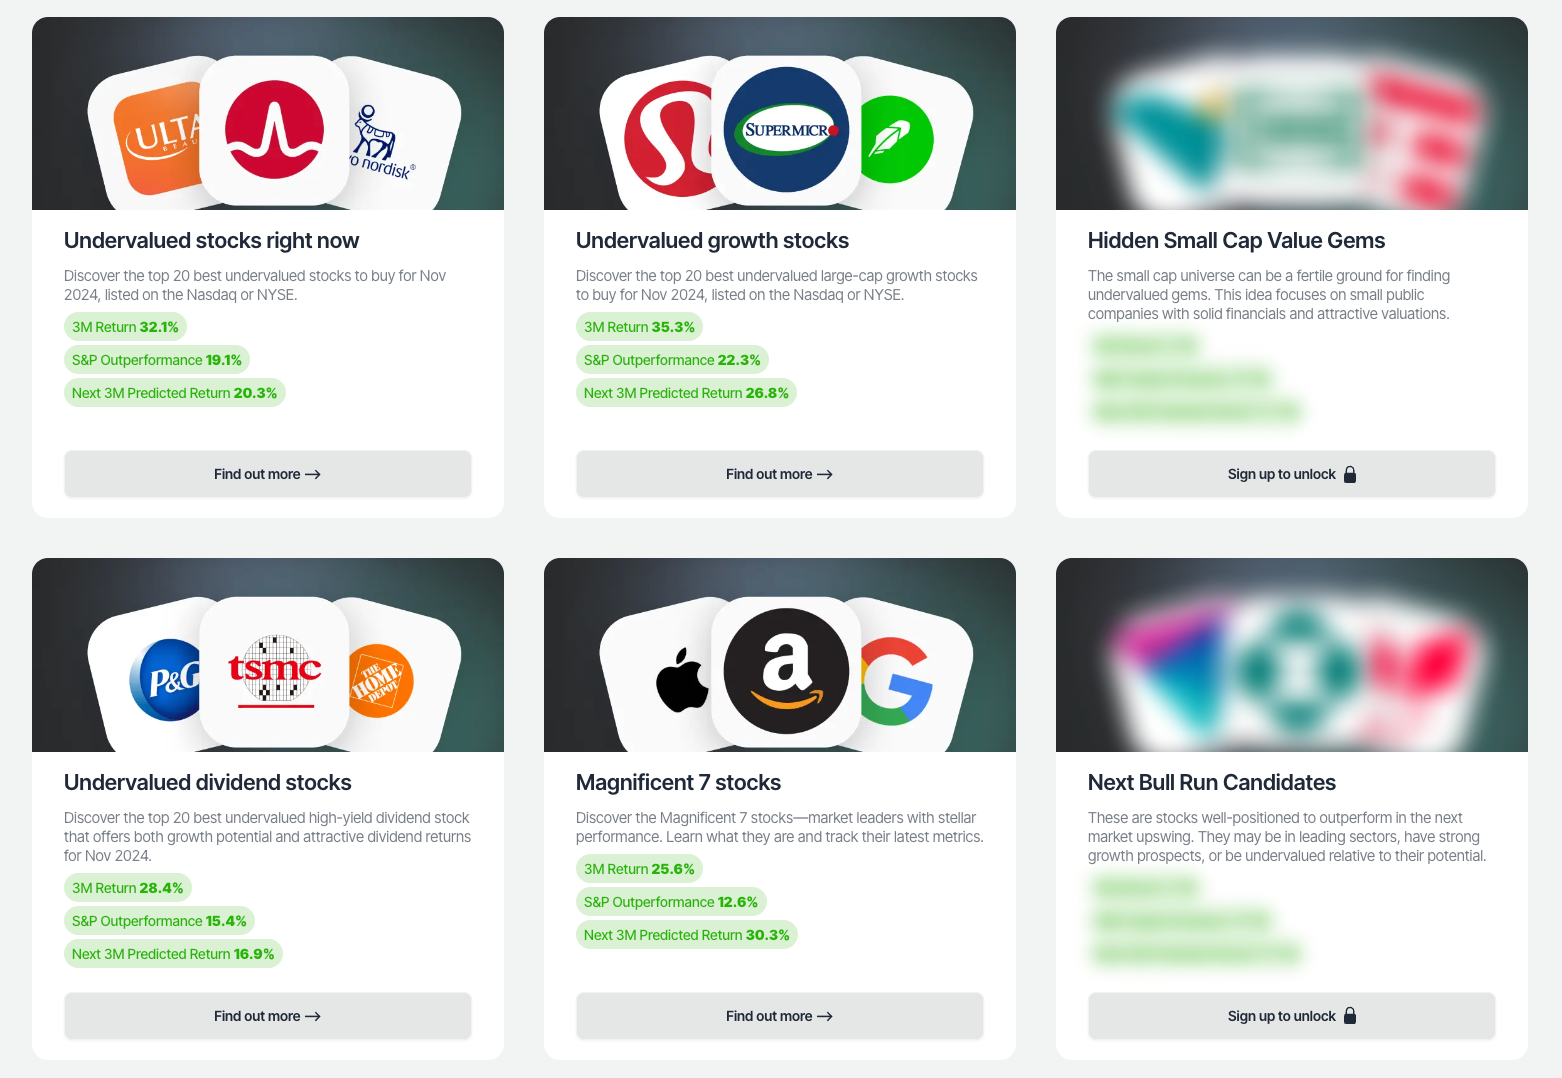
For investors seeking undervalued companies with high fundamental quality, our analytics team provides curated stock lists:
📌 50 Undervalued Stocks (Best overall value plays for 2025)
📌 50 Undervalued Dividend Stocks (For income-focused investors)
📌 50 Undervalued Growth Stocks (High-growth potential with strong fundamentals)
🔍 Check out these stocks on the Value Sense platform for free!
More Articles You Might Like
📖 1-Month Market Movers: Best Undervalued High-Quality Stocks
📖 7 Best Undervalued Stock Picks for October 2025
📖 George Soros - Soros Fund Management LLC Q2 2025 Portfolio
📖 12 Best Momentum Stock Picks for November 2025
📖 13 Best Wide Moat Stock Picks for 2025
FAQ for Best Profitable Growers
Q1: How were these stocks selected?
A: Stocks were selected based on ValueSense’s profitability ratings, margin strength, and sector representation, focusing on companies with robust financials and growth potential.
Q2: What's the best stock from this list?
A: The “best” stock depends on individual investment goals, but NVIDIA (NVDA) and Broadcom (AVGO) lead on profitability and margin metrics.
Q3: Should I buy all these stocks or diversify?
A: Diversification across sectors and business models can help manage risk and capture growth opportunities, rather than concentrating in a single name.
Q4: What are the biggest risks with these picks?
A: Key risks include regulatory changes, market volatility, sector-specific headwinds, and company execution challenges.
Q5: When is the best time to invest in these stocks?
A: Timing depends on market conditions and individual risk tolerance; phased entry and monitoring of earnings and macro trends are recommended for educational purposes.
Summary & Investment Outlook
The 12 best stock picks highlighted here offer a blend of high profitability, sector leadership, and growth potential. By focusing on companies with strong margins and resilient business models, investors can build a diversified watchlist for long-term wealth creation. For more in-depth analysis and real-time updates, visit ValueSense.