ValueSense features - Advanced Stock Heatmap
The Advanced Stock Heatmap is a powerful data visualization tool that provides an immediate, at-a-glance overview of entire stock market indices. Instead of sifting through tables of numbers, you can instantly see which stocks, industries, or sectors are performing well or poorly based on any selected financial metric, helping you quickly identify market trends, spot outliers, and discover investment opportunities.
Accessing the Stock Heatmap
From the Main Navigation
- Click on "More tools" in the main header menu
- Select "Stock Heatmap" from the dropdown list
- Navigate to the dedicated "Advanced Stock Heatmap" page

What the Stock Heatmap Does
Core Purpose
The heatmap transforms complex financial data into an intuitive visual format that allows you to:
- Quickly identify market trends across hundreds of stocks simultaneously
- Spot outliers and potential investment opportunities
- Analyze sector performance and rotation patterns
- Screen for stocks based on specific financial criteria
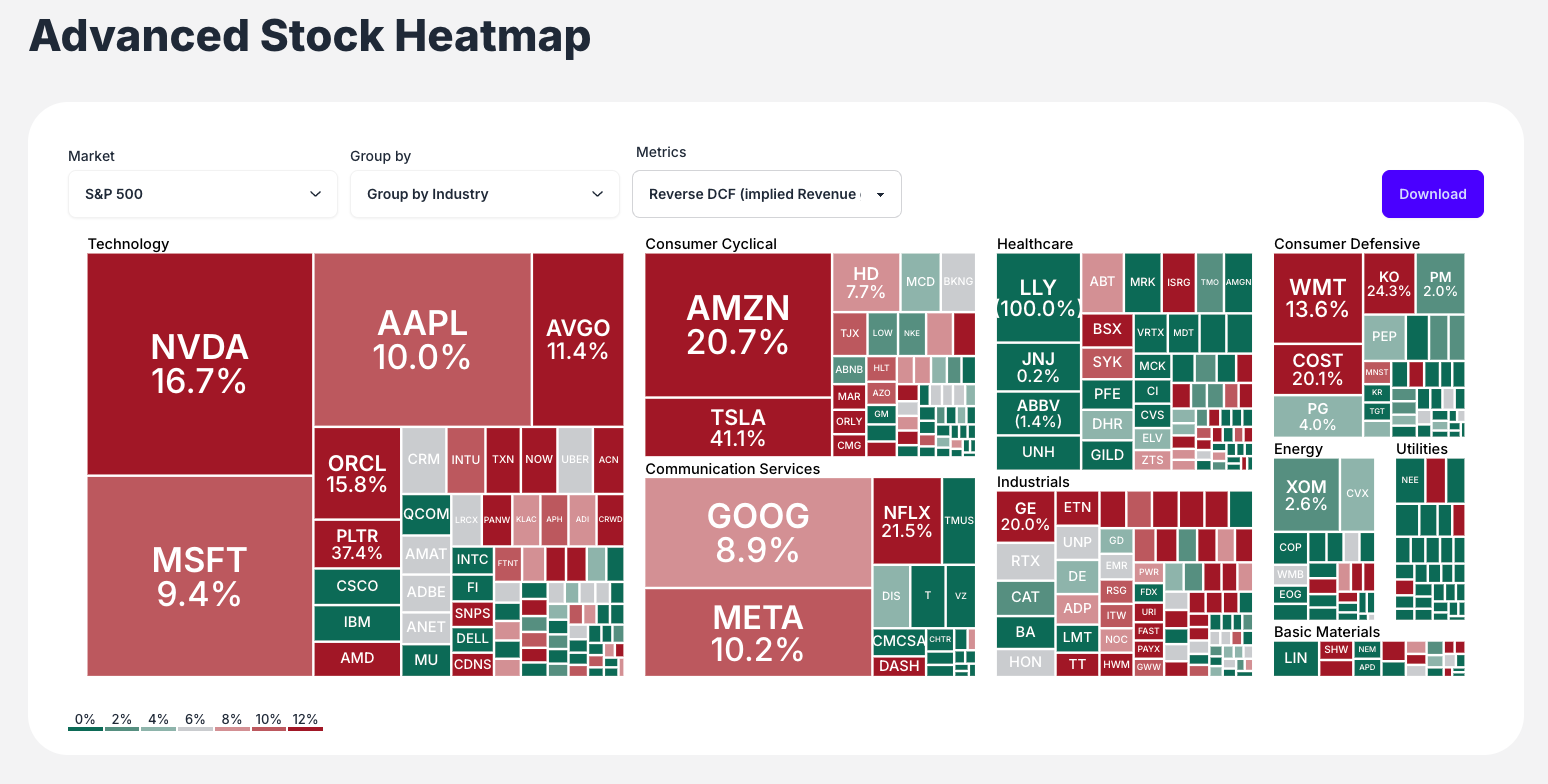
Visual Format
- Rectangle Size: Represents stock's weighting within the index (typically market capitalization)
- Rectangle Color: Represents the value of your selected metric (red for negative/low, green for positive/high)
- Color Scale: Reference guide displayed at bottom of heatmap
Comprehensive Data Types Available
The heatmap can visualize dozens of financial metrics organized into logical categories:
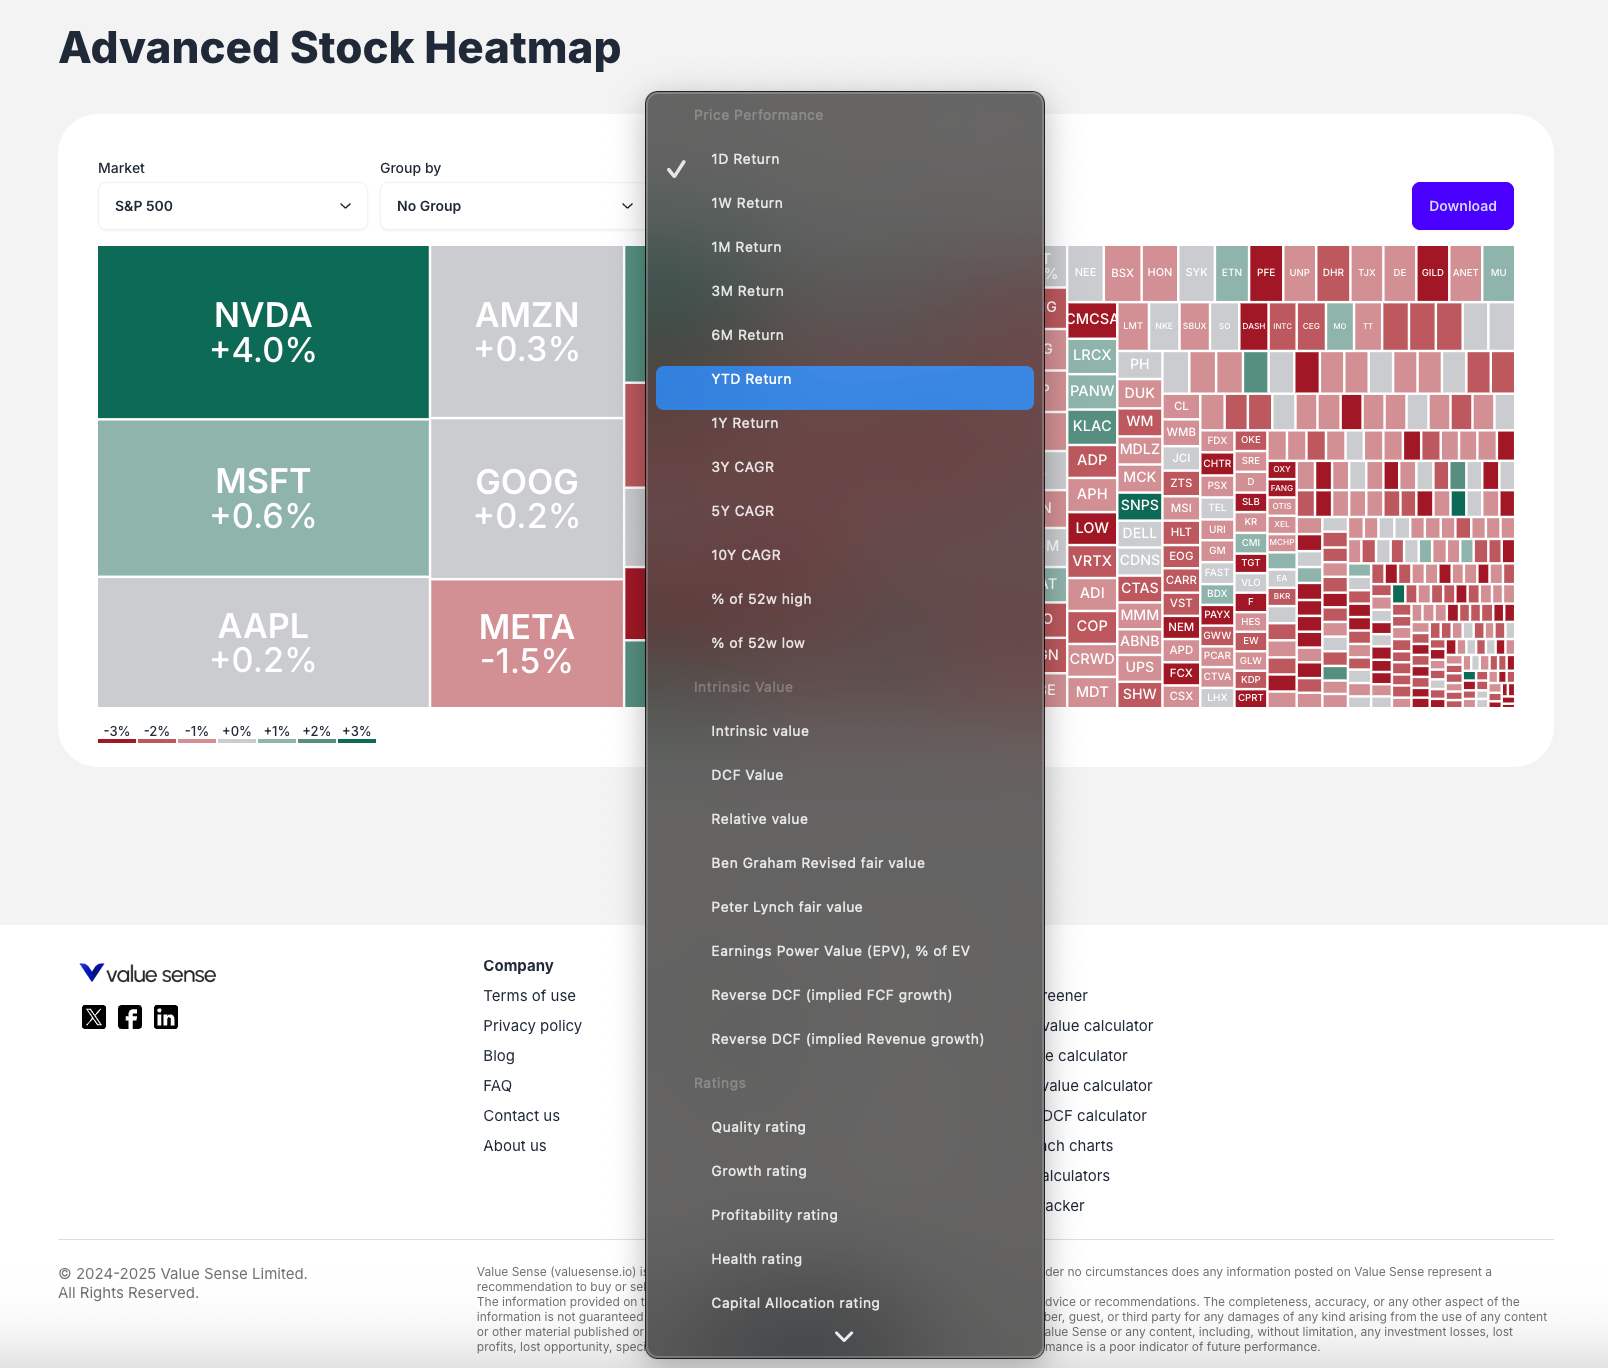
Price Performance
- 1D Return, 1M Return, YTD Return, 1Y CAGR
- Various timeframe performance metrics
Intrinsic & Relative Value
- Intrinsic Value, DCF Value, Relative Value
- Ben Graham Revised fair value
- Reverse DCF (Implied Growth)
Quality Ratings
- Quality, Growth, Profitability, Health, Capital Allocation ratings
Valuation Multiples
- LTM EV/Revenue, Forward P/E, LTM P/FCF
- Price-to-earnings, price-to-book, and other multiples
Growth Metrics
- Revenue Growth, EPS Growth, FCF Growth (YOY and CAGR)
- Short-term and long-term growth indicators
Profitability Analysis
- Gross Profit Margin, EBIT Margin, Net Income Margin
- Operating efficiency metrics
Financial Health
- Current Ratio, Net Debt to FCF, Total Debt to Equity
- Balance sheet strength indicators
Dividend Analysis
- Dividend Yield, Payout Ratio, DPS Growth
- Income investing metrics
Customization Options
Market Selection
- S&P 500: Large-cap US stocks
- NASDAQ 100: Technology-focused index
- Choose the market universe for your analysis
Group By Options
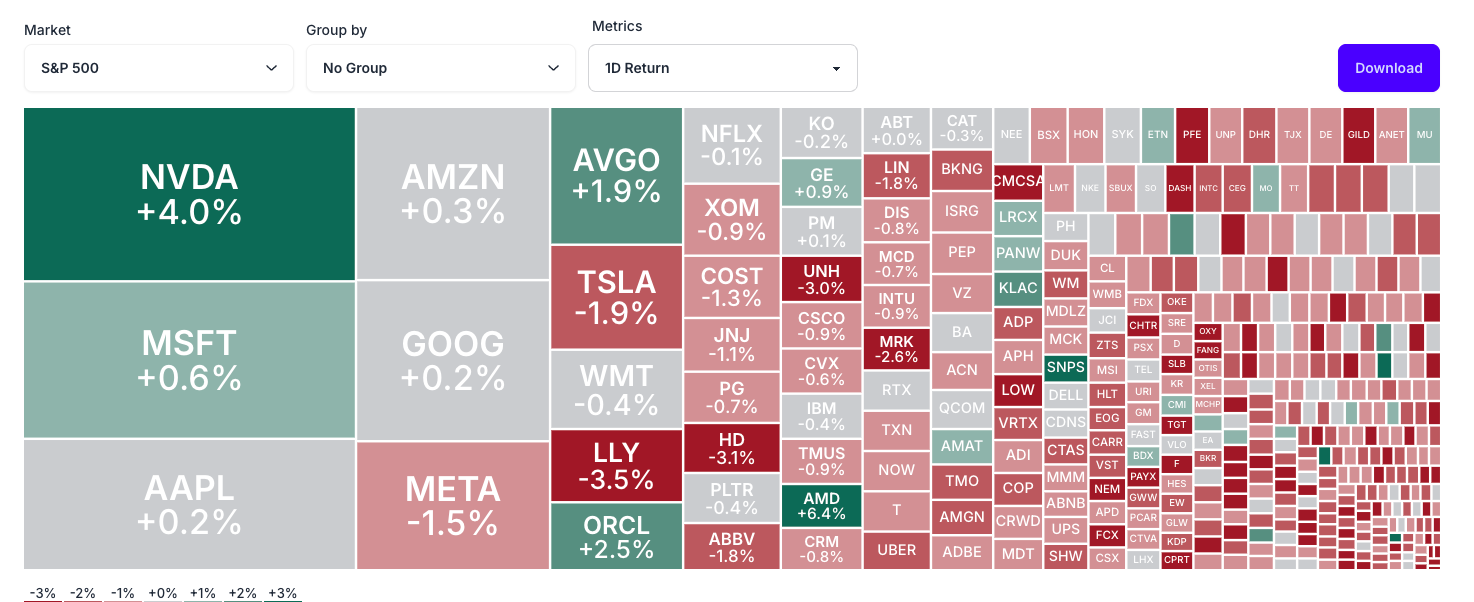
- No Group: All stocks displayed together, sized by market cap
- Group by Industry: Stocks organized into industry sectors (Technology, Healthcare, Consumer Cyclical, etc.)
Metrics Selection
- Comprehensive Library: Choose from extensive list of financial metrics
- Category Organization: Metrics organized by Performance, Valuation, Profitability, etc.
- Instant Updates: Heatmap recolors based on selected metric
Export Functionality
- Download Button: Save current heatmap view as image file
- Report Integration: Use visualizations in presentations and analysis
Interactive Features
Hover for Details
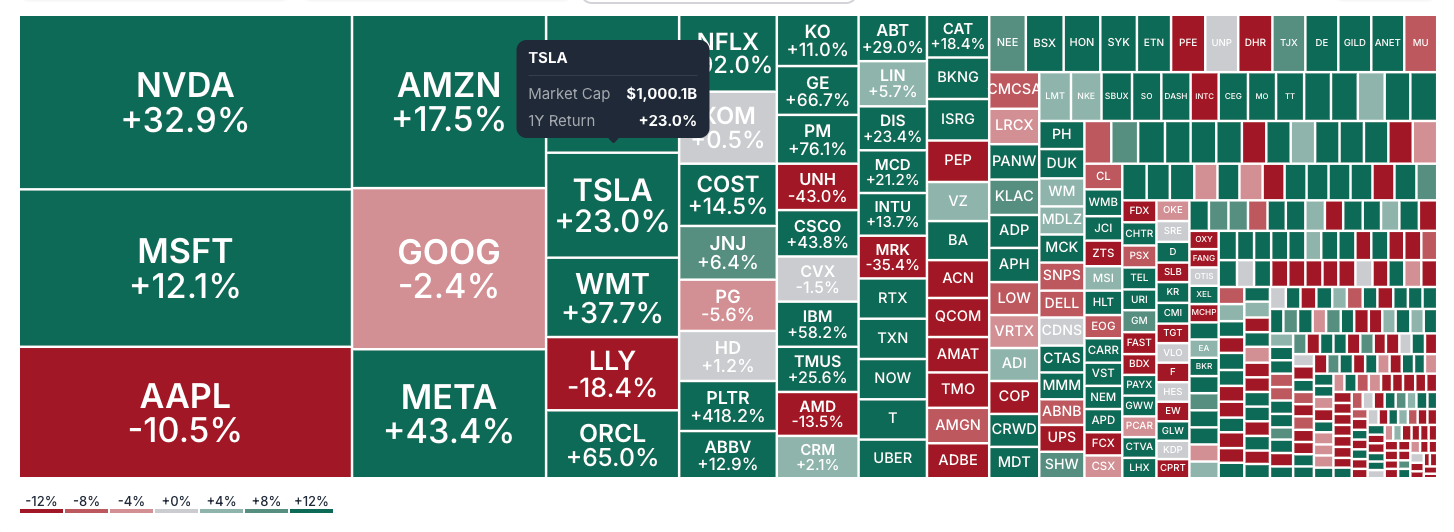
Tooltip Information
Hover over any stock rectangle to see:
- Company name
- Market capitalization
- Current metric value
- Specific data points
Real-time Updates
- Dynamic Recoloring: Instant visual updates when changing metrics
- Sector Boundaries: Clear visual separation when grouping by industry
Key Workflow Steps
Step 1: Access and Setup
Navigate to Stock Heatmap and select your target market index
Step 2: Define Your View
- Choose between individual stocks ("No Group") or sector analysis ("Group by Industry")
- Consider your analysis objectives
Step 3: Select Analysis Metric
- Choose the financial metric that answers your research question
- Examples: "Intrinsic Value" for valuation screening, "1D Return" for daily performance
Step 4: Analyze the Big Picture
- Observe overall patterns and trends
- Look for sector-wide movements or individual outliers
- Identify areas of interest for deeper investigation
Step 5: Drill Down
- Hover over specific rectangles to get exact figures and company names
- Focus on stocks that stand out visually
Step 6: Iterate and Explore
- Change metrics to explore different analytical angles
- Switch between valuation, profitability, growth, and performance views
Step 7: Export Insights
- Download the most valuable views for future reference
- Use visualizations in reports and presentations
Benefits and Use Cases
Speed and Efficiency
- Instant Processing: Understand hundreds of stocks simultaneously
- Data Density: Multiple information layers in single view
- Pattern Recognition: Spot trends difficult to find in spreadsheets
Daily Market Pulse
- Set metric to "1D Return" to quickly grasp market sentiment
- Identify which sectors are leading or lagging
Valuation Screening
- Use "Intrinsic Value," "P/E," or "P/FCF" metrics
- Find potentially under or overvalued stocks for watchlists
Sector Rotation Analysis
- Group by industry and use performance metrics
- See which sectors are gaining or losing momentum
Quality Assessment
- Use "Quality Rating" or "Net Debt to FCF"
- Quickly assess financial health across entire index
Growth Opportunities
- Apply growth metrics to identify expanding companies
- Compare growth rates across different sectors
Best Practices
Effective Analysis
- Start with Overview: Use "No Group" to see entire market landscape
- Drill to Sectors: Switch to "Group by Industry" for sector-specific insights
- Multiple Metrics: Don't rely on single metric - explore different angles
Metric Selection
- Match Objective: Choose metrics that align with your investment strategy
- Consider Timeframe: Select appropriate performance periods for your analysis
- Combine Perspectives: Use valuation, quality, and performance metrics together
Visual Interpretation
- Color Intensity: Darker colors indicate stronger signals
- Size Matters: Remember larger rectangles represent larger companies
- Outlier Focus: Pay attention to stocks that stand out visually
Key Features to Highlight
Understanding the Visualization
- Size = Market Cap: Larger rectangles represent larger companies
- Color = Metric Value: Color intensity shows metric performance
- Color Scale Legend: Reference guide for interpreting colors
Three Control Filters
- Market: Choose your analysis universe (S&P 500, NASDAQ 100)
- Group by: Organize view by individual stocks or industry sectors
- Metrics: Select from comprehensive library of financial metrics
Group by Industry Power
- Sector Analysis: Instantly see industry-level performance
- Rotation Identification: Spot sector rotation patterns
- Comparative Assessment: Compare sectors side-by-side
Interactive Tooltips
- Hover Functionality: Get specific data points for any stock
- Instant Information: No clicking required for basic data
- Detailed Metrics: See exact values and company names
Download Capability
- Export Views: Save heatmaps for reports and presentations
- Multiple Formats: Image files suitable for various uses
- Snapshot Preservation: Maintain views for future reference
The Stock Heatmap transforms complex market analysis into an intuitive, visual experience that helps you quickly identify opportunities and understand market dynamics that would take hours to discover through traditional analysis methods.