
Cloud Wars: Google vs Amazon - A Deep Dive into Margins and Value (Q4 2024)
Welcome to Value Sense Blog
At Value Sense, we provide insights on the stock market, intrinsic value tools, and stock ideas with undervalued companies. You can explore our research products at valuesense.io and learn more about our approach on our site.
The battle for cloud supremacy continues to heat up as Google Cloud Platform (GCP) and Amazon Web Services (AWS) push for market dominance. Recent Q4 2024 data reveals fascinating insights into what's driving value for both tech giants, with cloud operating margins taking center stage.
Key Findings: Cloud Operating Margins Tell the Story
AWS Maintains Its Margin Lead
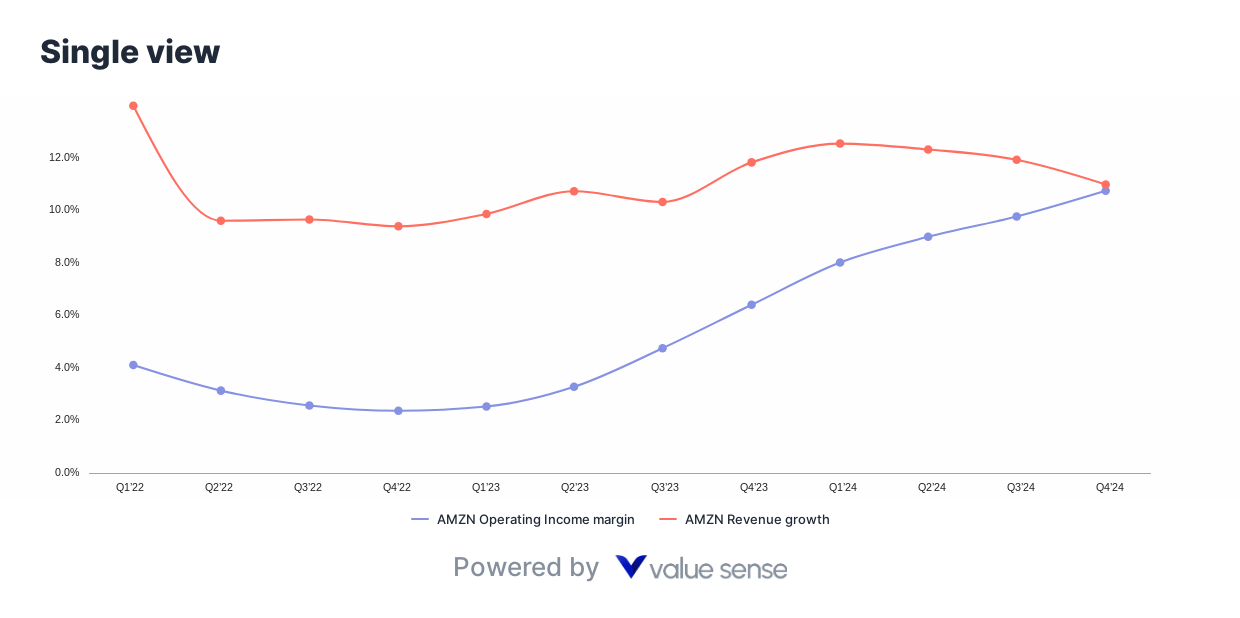
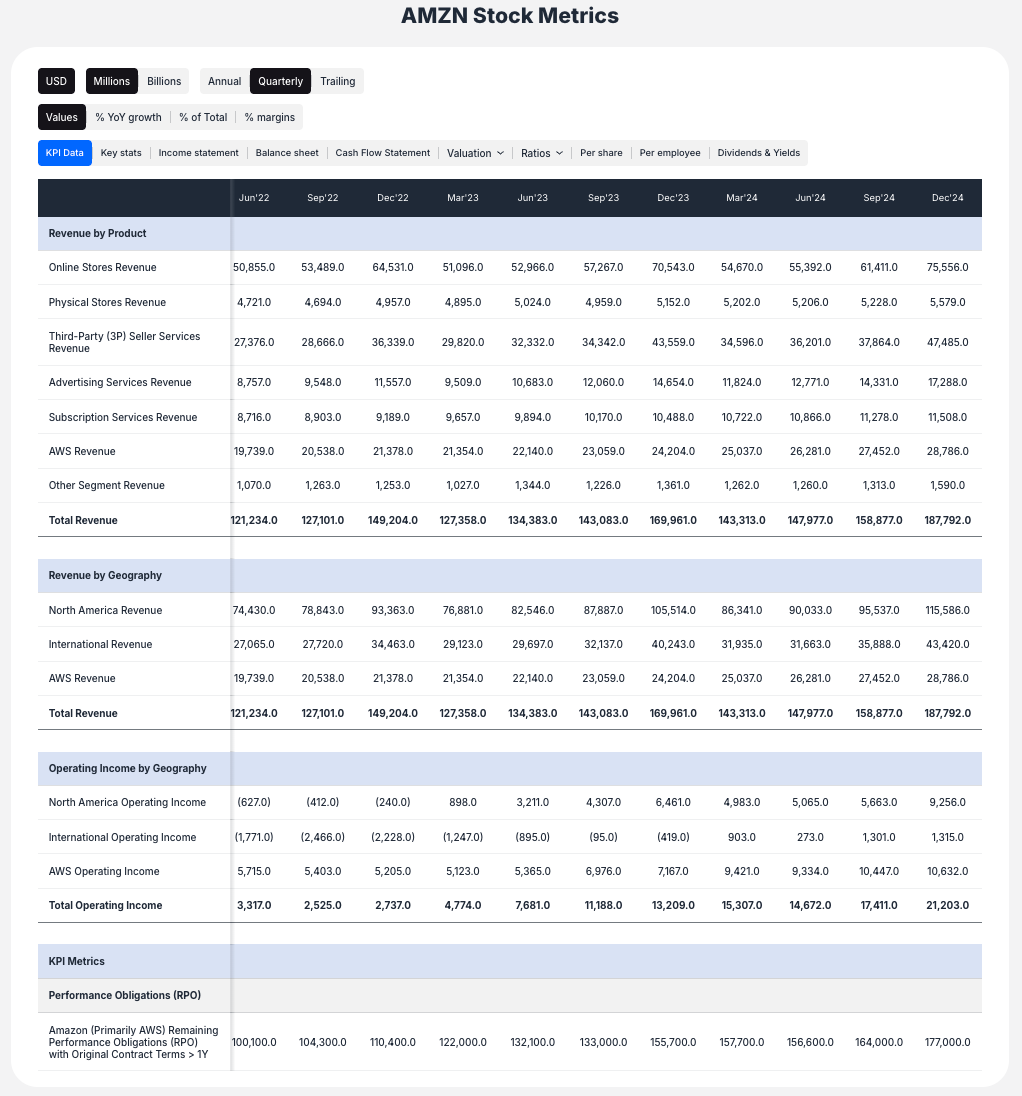
- AWS Operating Income Margin: 37.0% (Q4 2024)
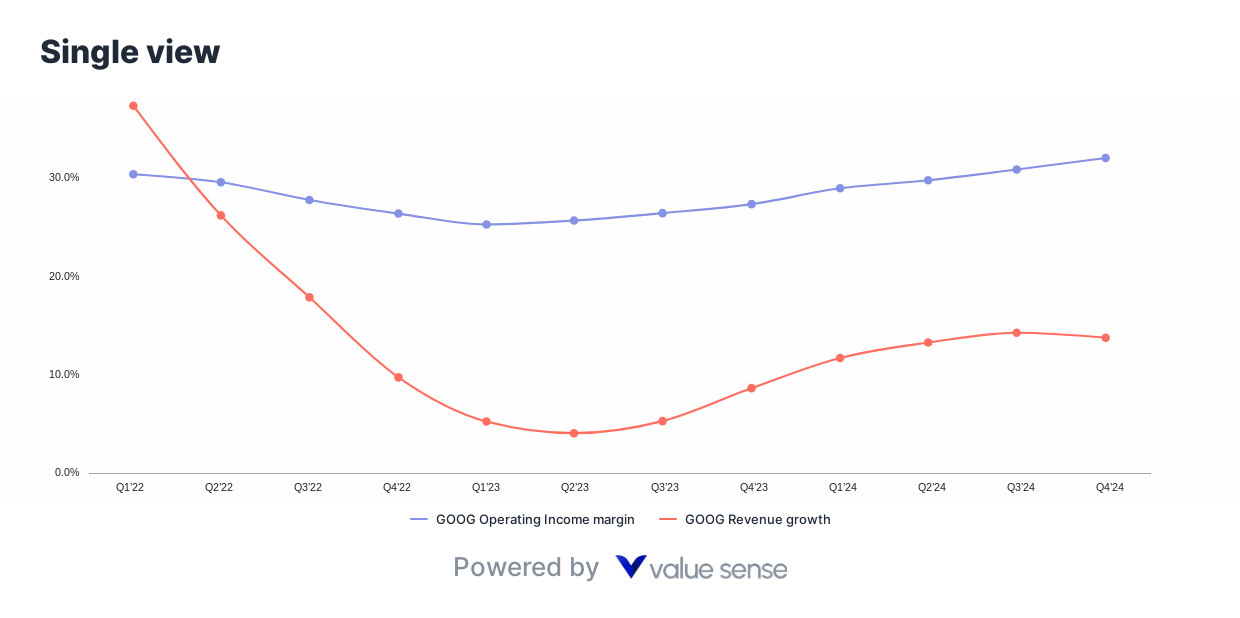
- Google Cloud Operating Income Margin: 14.1% (Q4 2024)
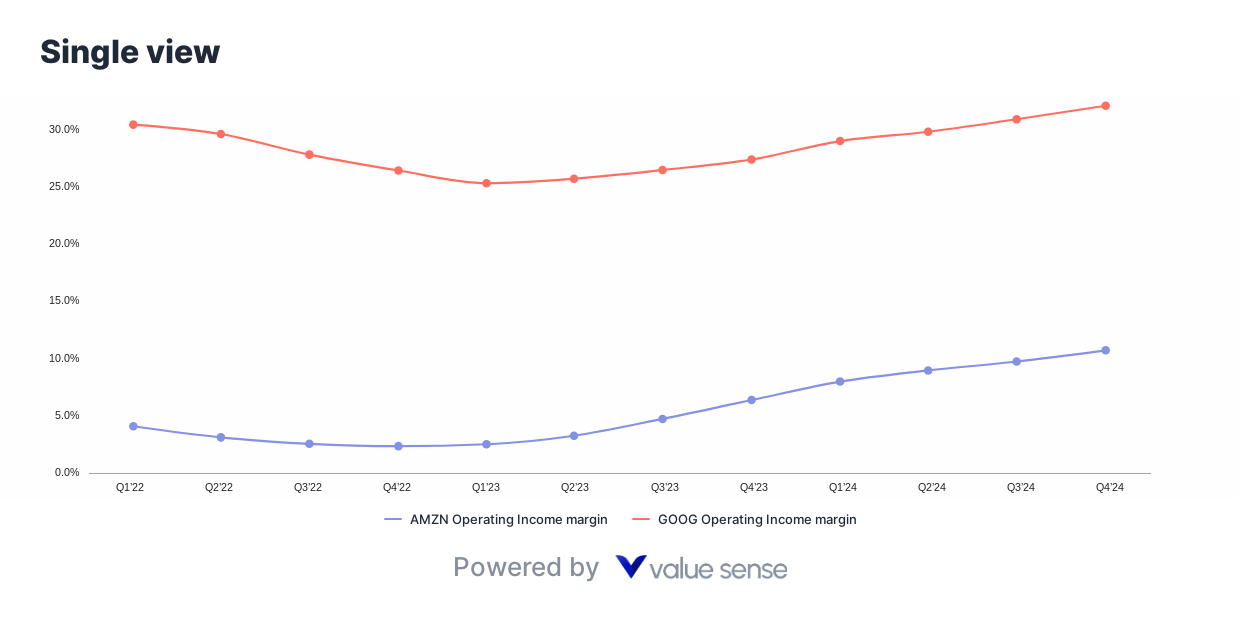
AWS continues to demonstrate why it's the profit engine for Amazon, maintaining exceptional margins that are nearly 3x higher than Google Cloud's. This significant margin advantage showcases AWS's maturity, scale efficiencies, and pricing power in the cloud infrastructure market.
Valuation Metrics: Not Just About Growth
Despite AWS's superior margins, both companies trade at relatively similar valuations:
Price to Operating Cash Flow (P/OCF) - Last Twelve Months
- Google (GOOG): 14.4x
- Amazon (AMZN): 15.1x
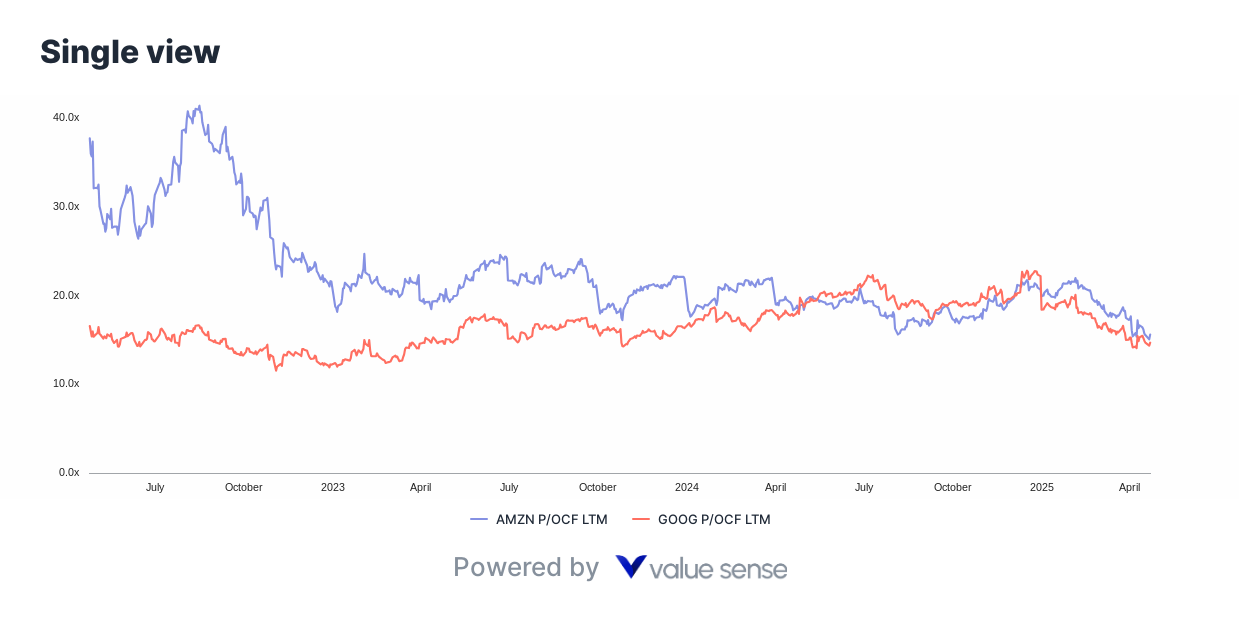
This comparable valuation multiple suggests the market is pricing in Google Cloud's rapid scaling potential against AWS's established profitability.
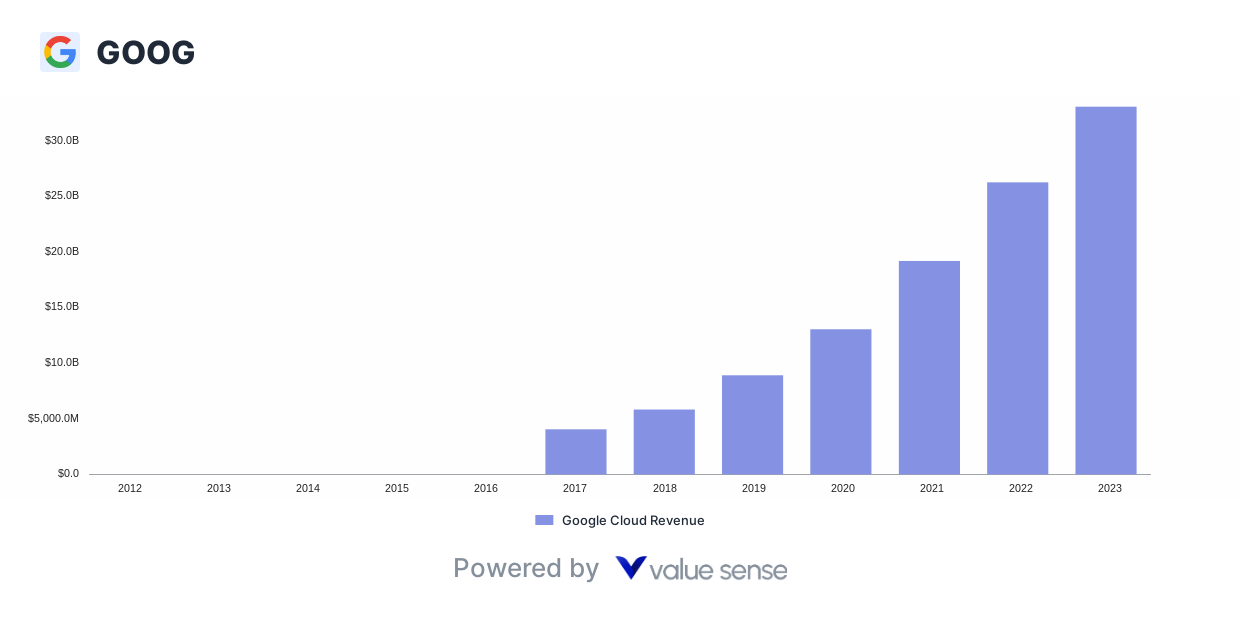
The Growth Story: Google Cloud's Rapid Ascent
While AWS remains the "margin king," Google Cloud is scaling at an impressive pace. The trend lines from Q1 2022 to Q4 2024 show Google Cloud's margins improving from negative territory to 14.1%, demonstrating successful scaling and operational efficiency improvements.
Key Investment Considerations
For Amazon Investors
- Margin Leadership: AWS continues to deliver exceptional profitability
- Market Position: Strong competitive moat and first-mover advantage
- Revenue Growth: Stable, consistent growth in cloud revenue
For Google Investors
- Scaling Potential: Rapid margin improvement trajectory
- Market Share Gains: Growing presence in cloud infrastructure
- Integration Advantages: Synergies with Google's AI and search capabilities
Financial Health Comparison
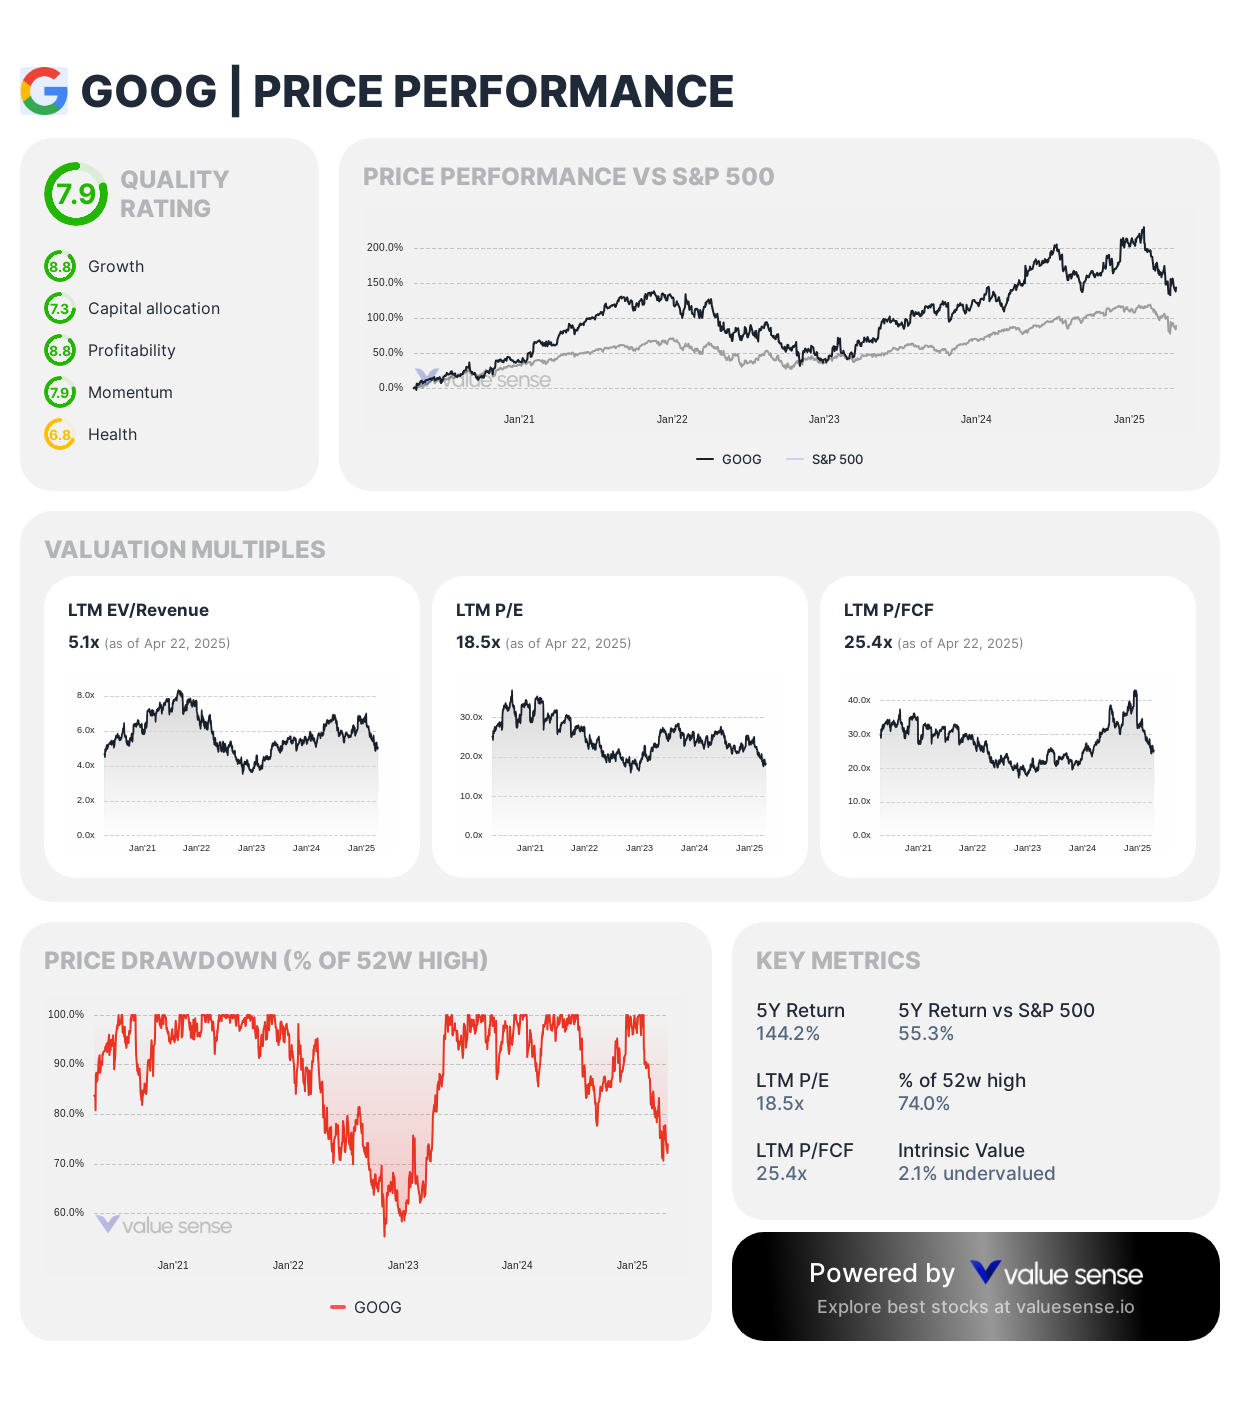
Quality Ratings (as of April 2025)
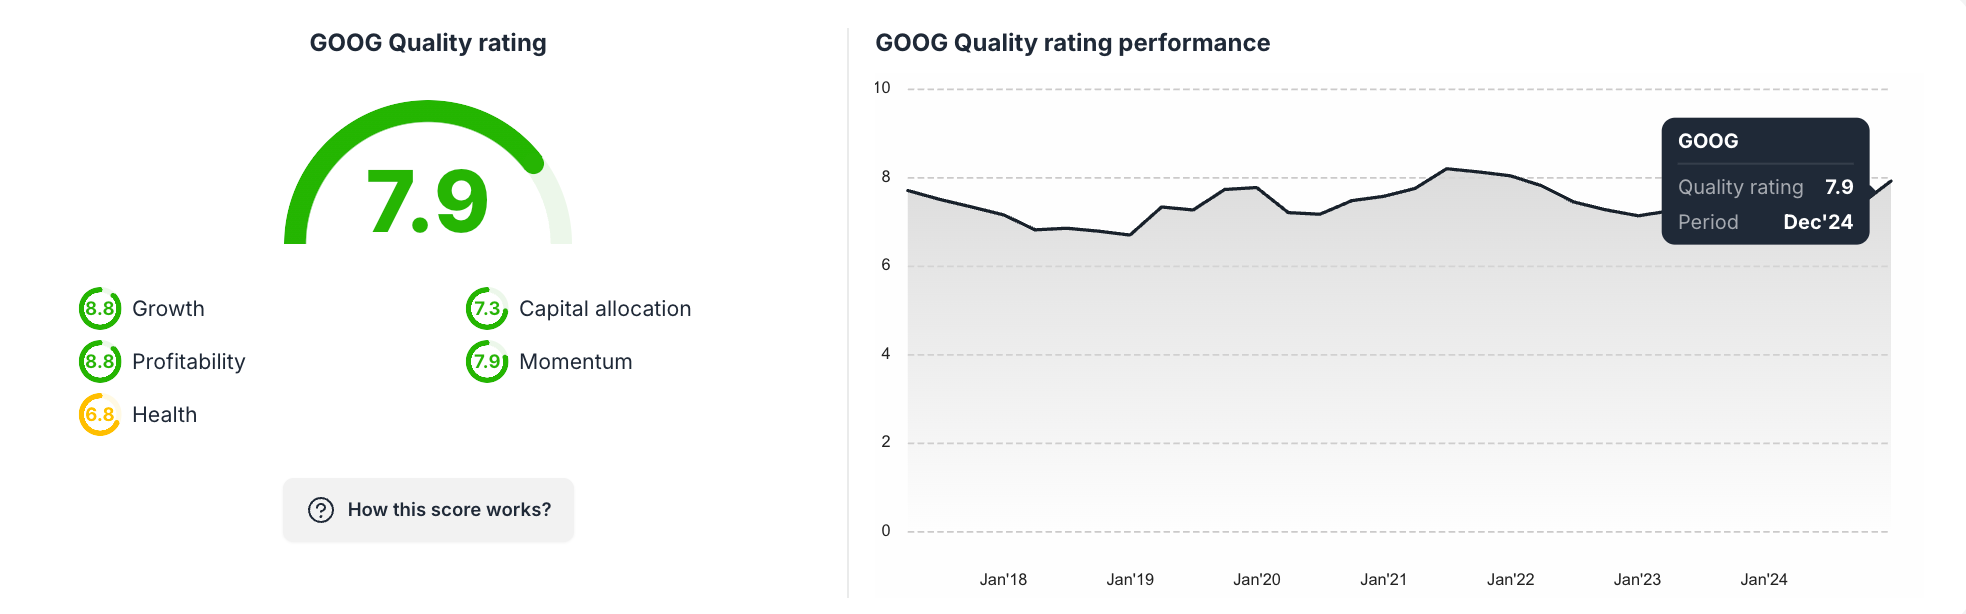
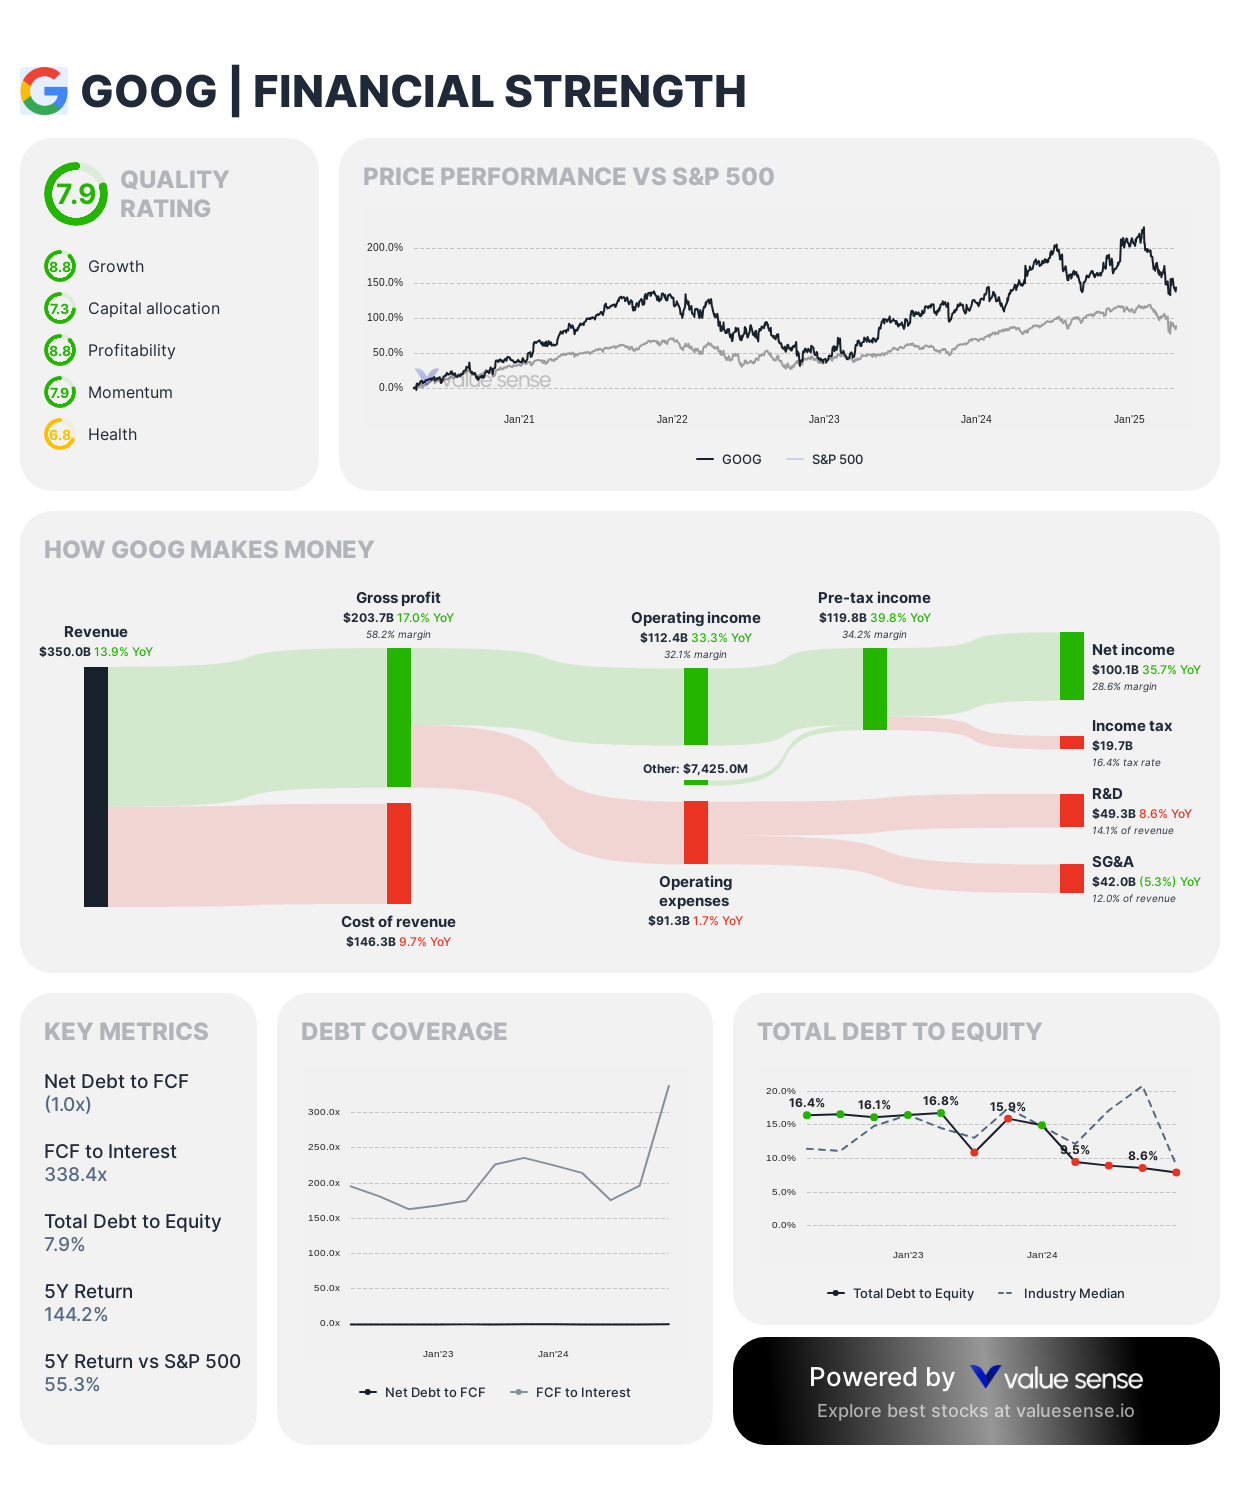
- Google: 7.9/10
- Growth: 6.6
- Capital Allocation: 7.5
- Profitability: 8.8
- Momentum: 7.9
- Health: 6.8
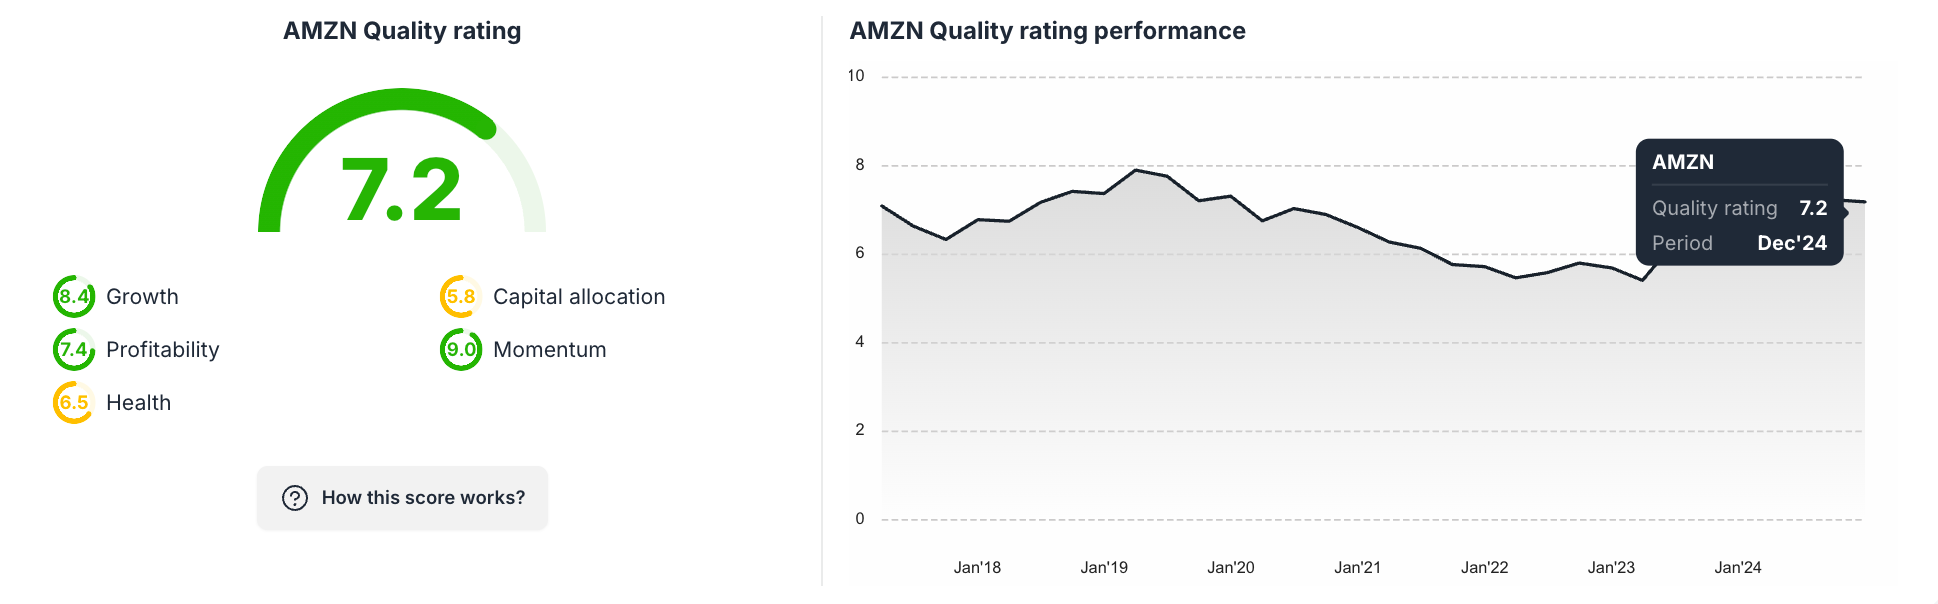
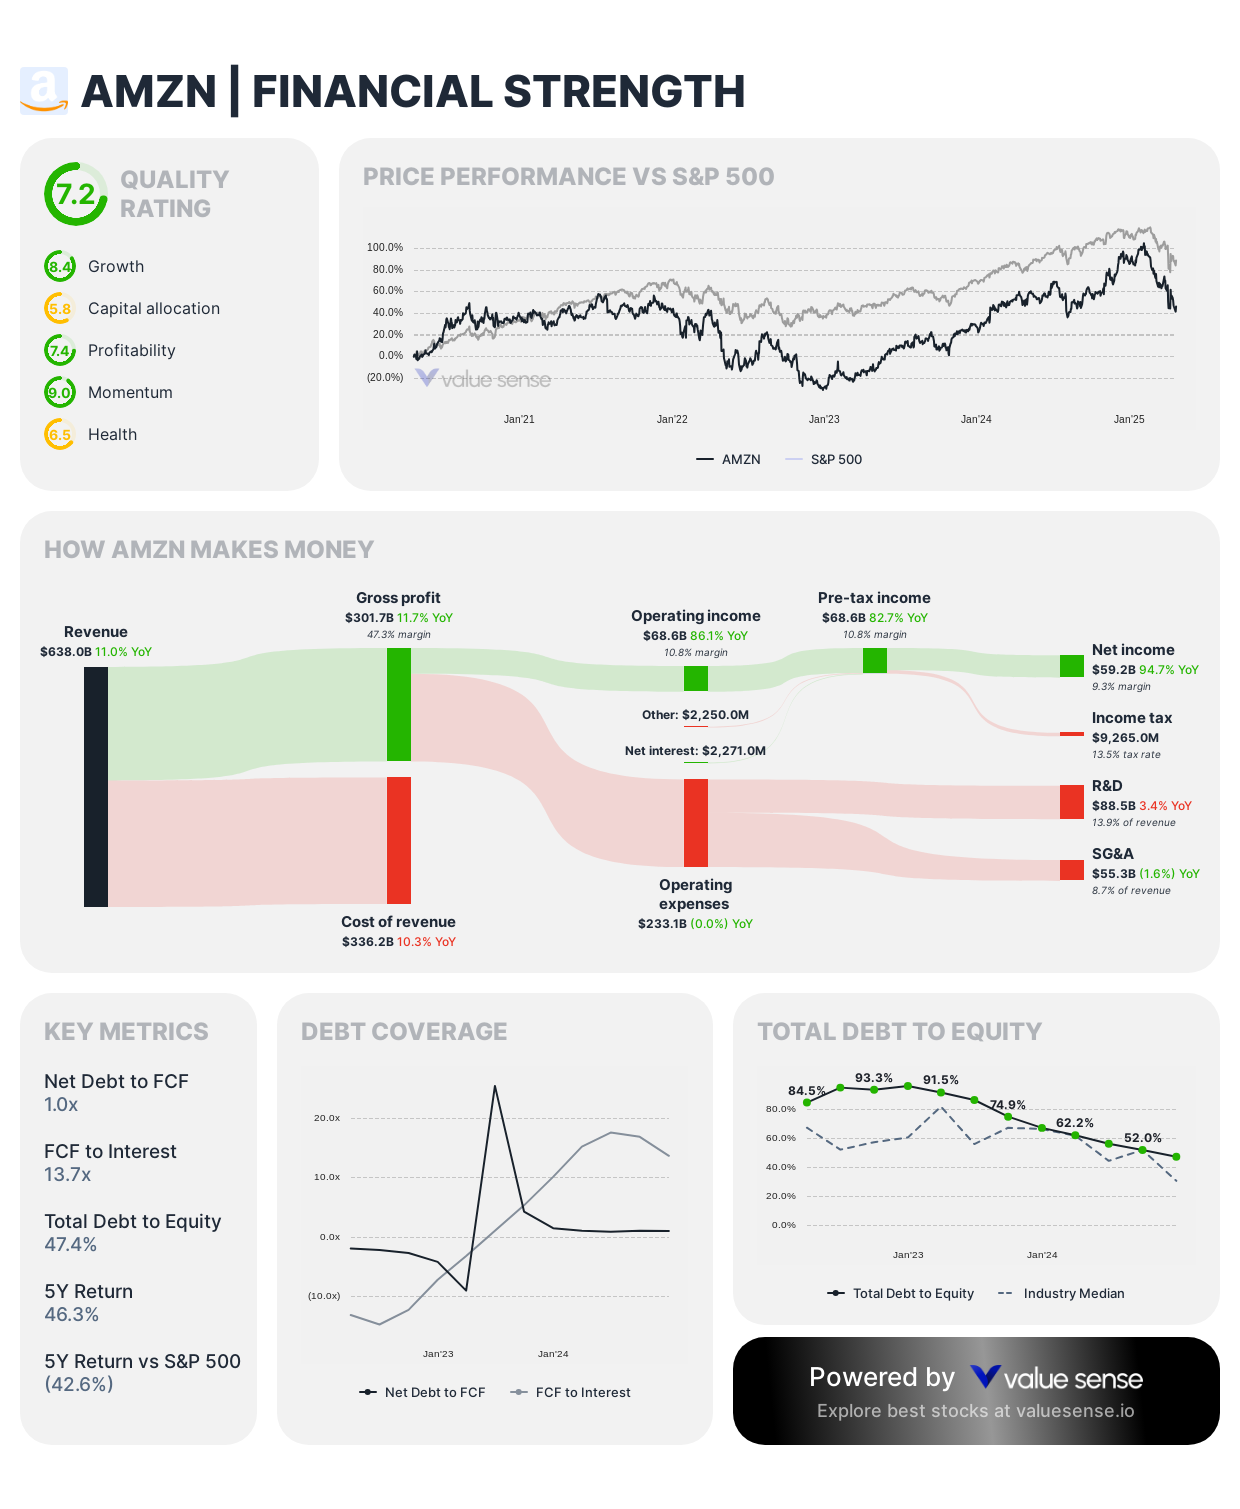
- Amazon: 7.2/10
- Growth: 6.4
- Capital Allocation: 6.1
- Profitability: 7.4
- Momentum: 8.0
- Health: 6.5
Revenue Performance (Year-over-Year)
Google (Q4 2023 vs Q4 2022)
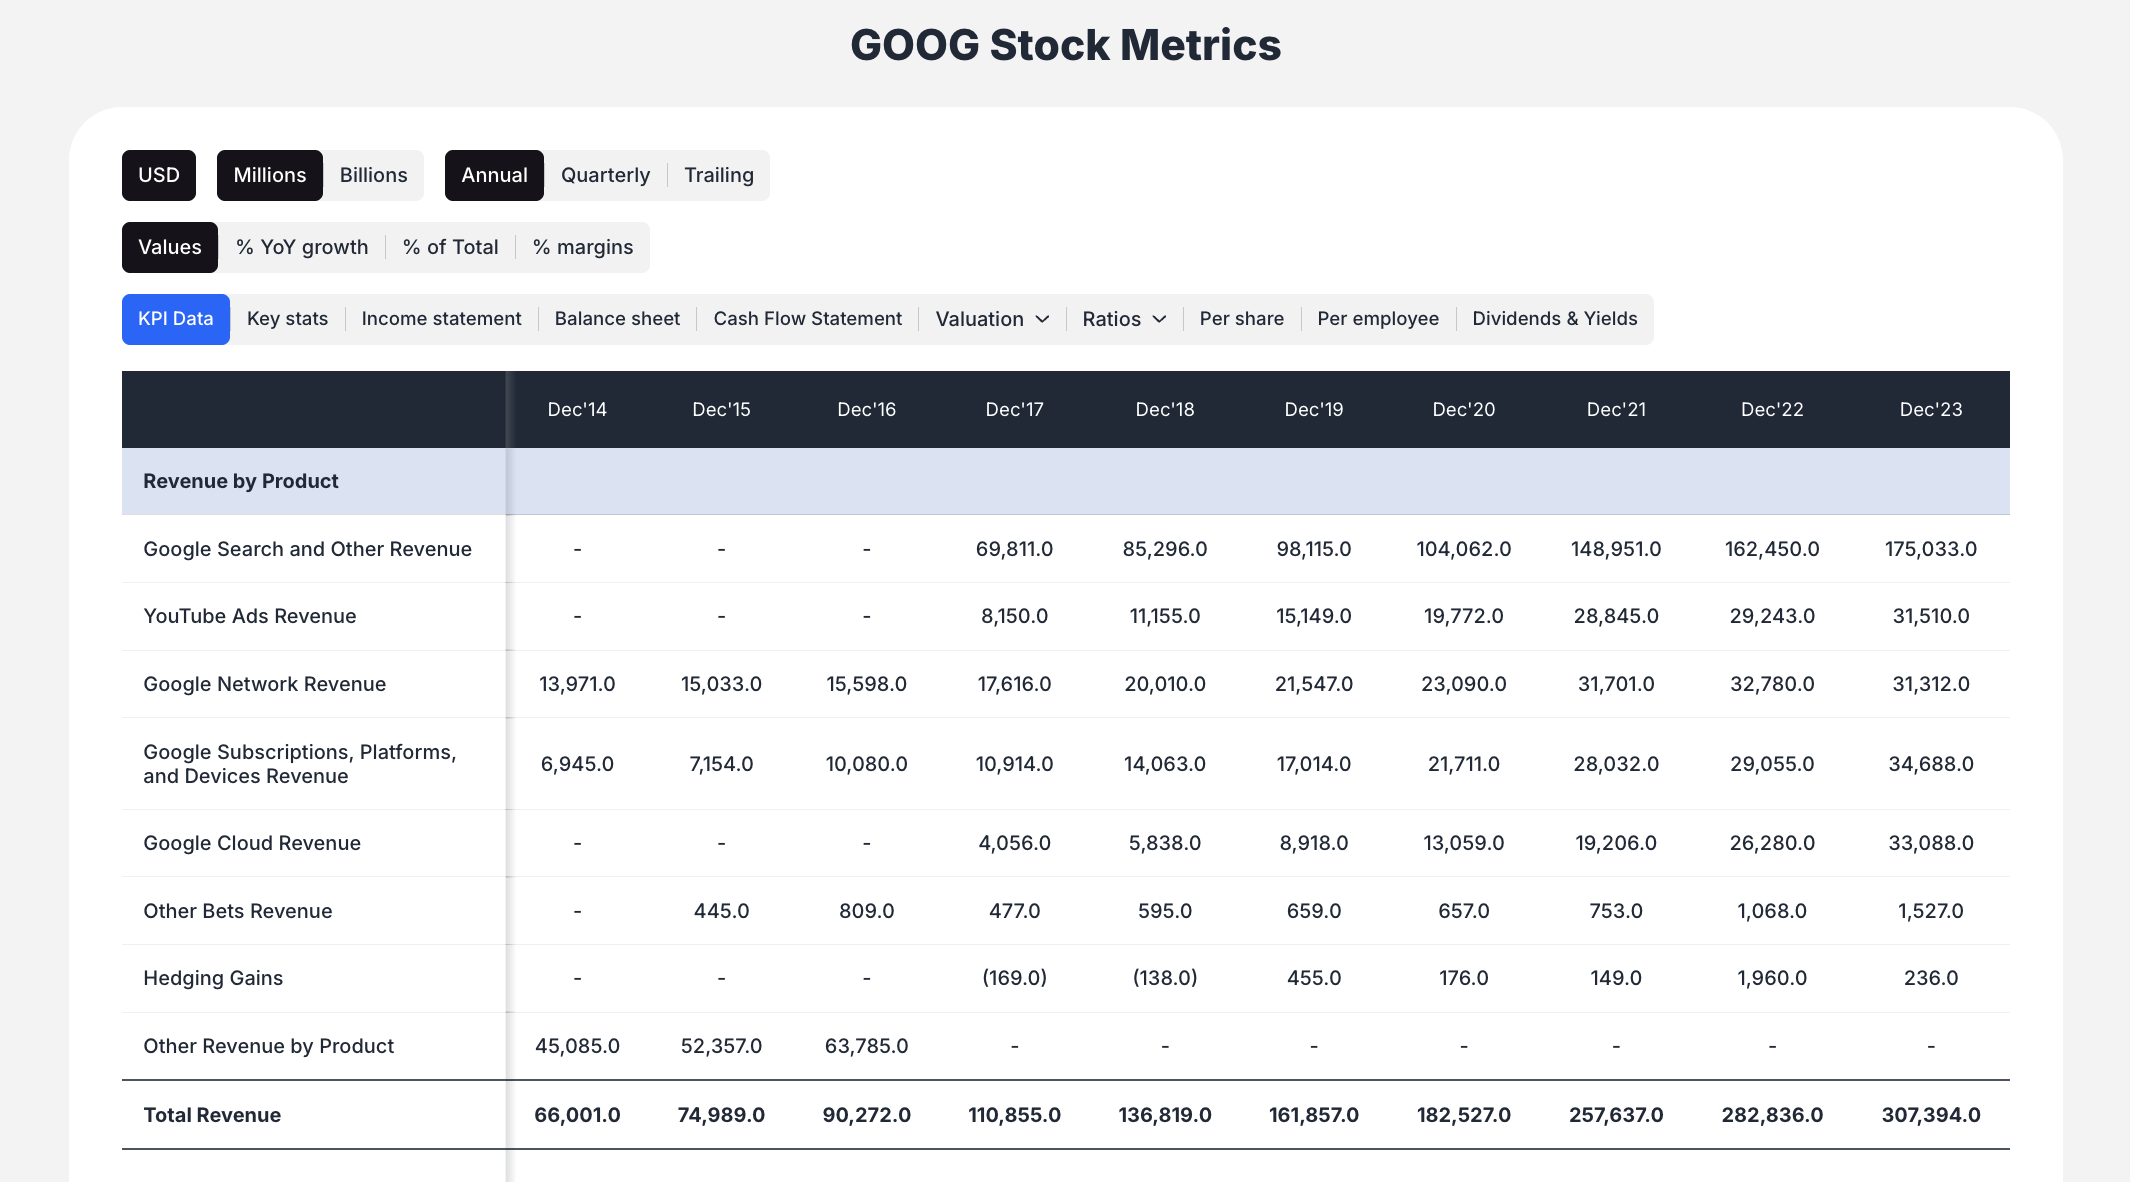
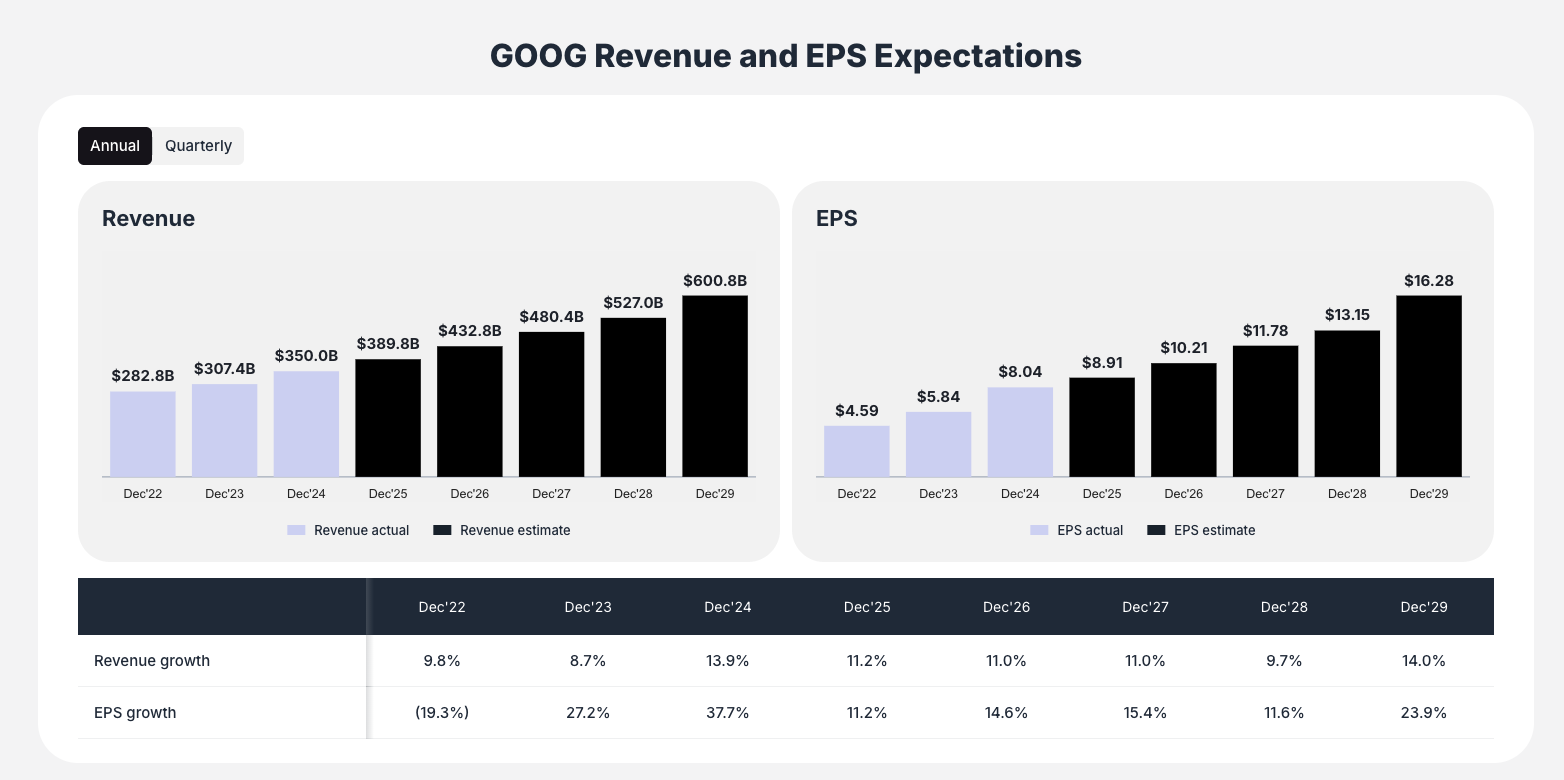
- Total Revenue: $307.39B (+9.3%)
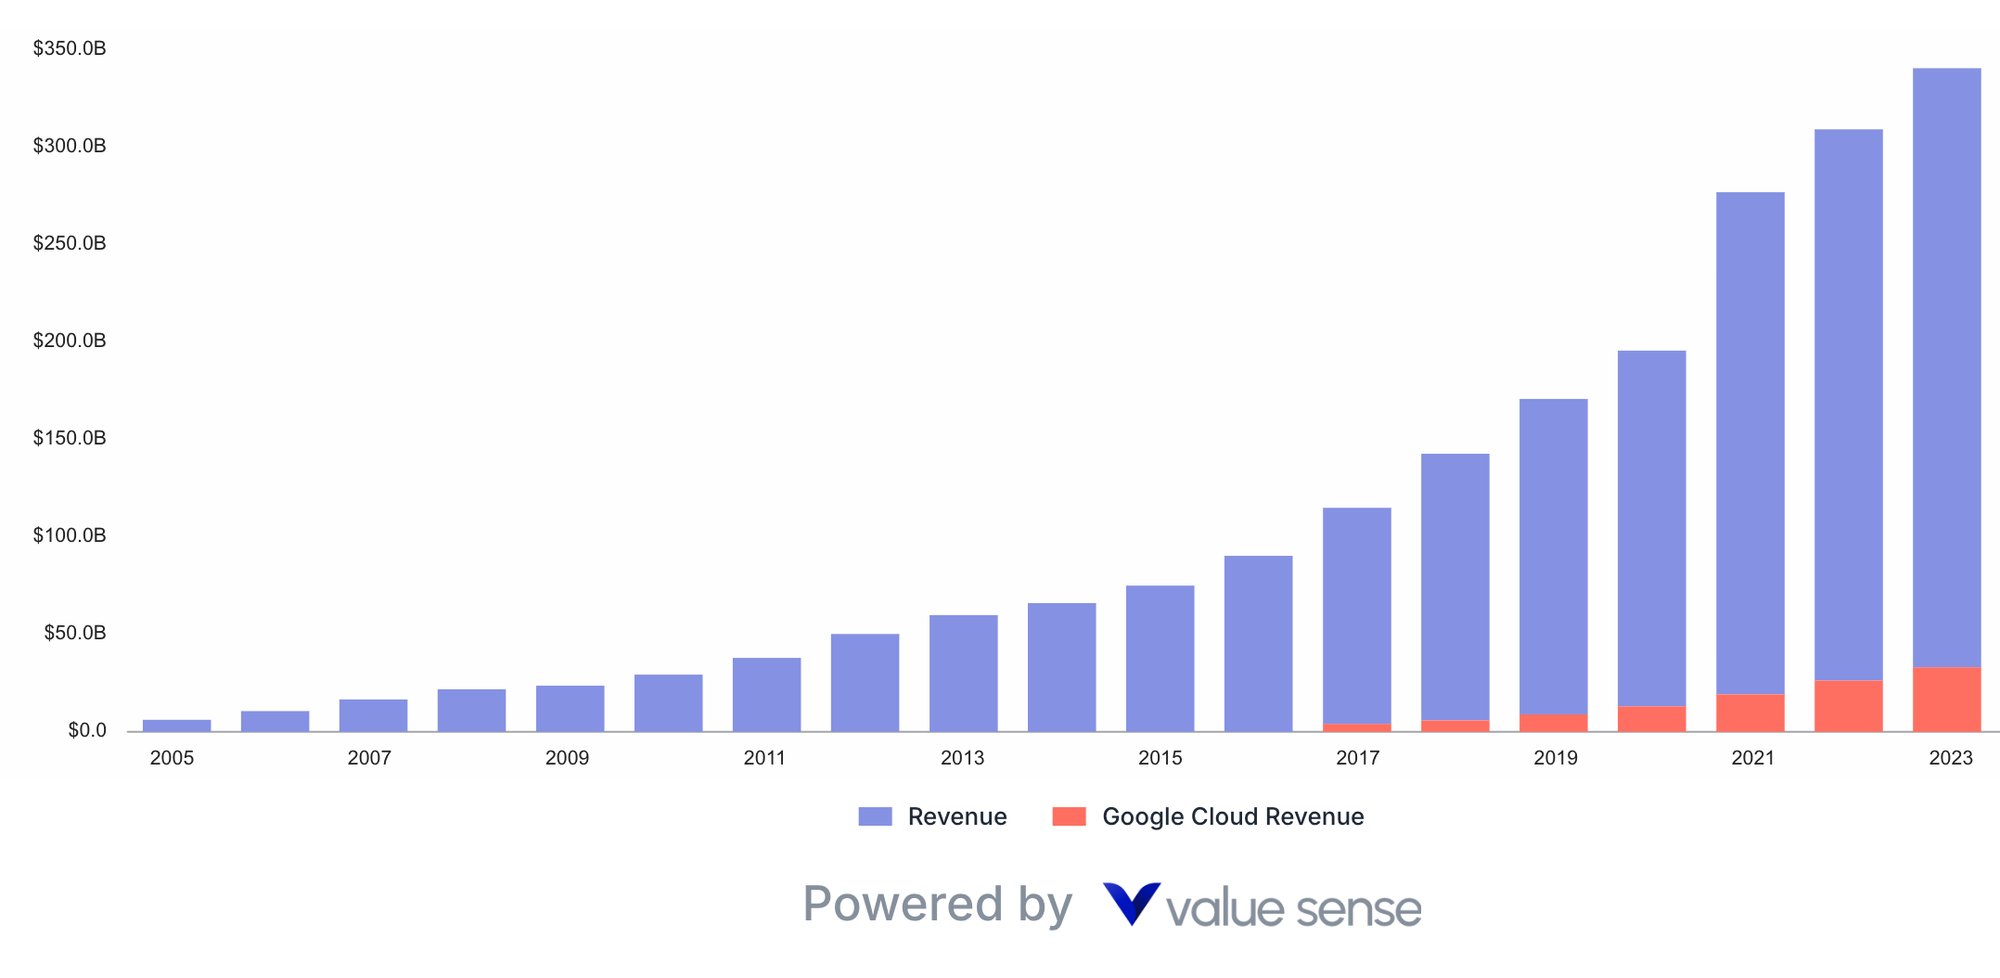
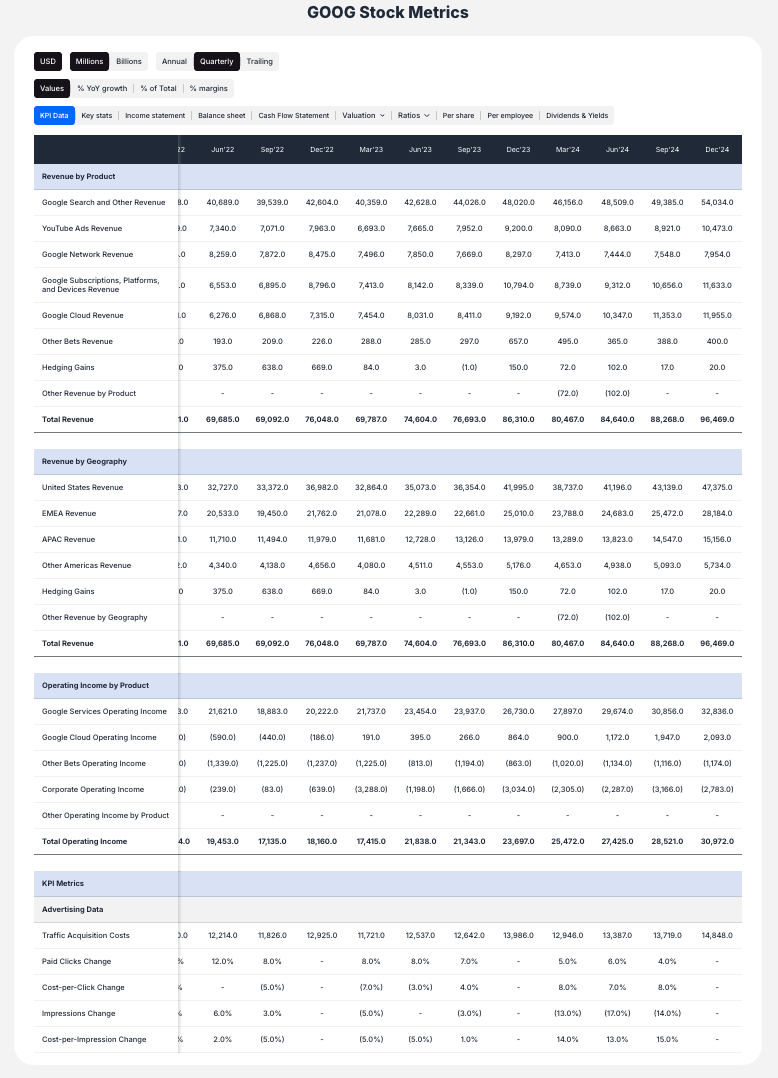
- Google Cloud Revenue: $33.09B (+25.6%)
- Operating Income: $84.29B (+18.5%)
- Google Cloud Operating Income: $1.72B (turned positive from losses)
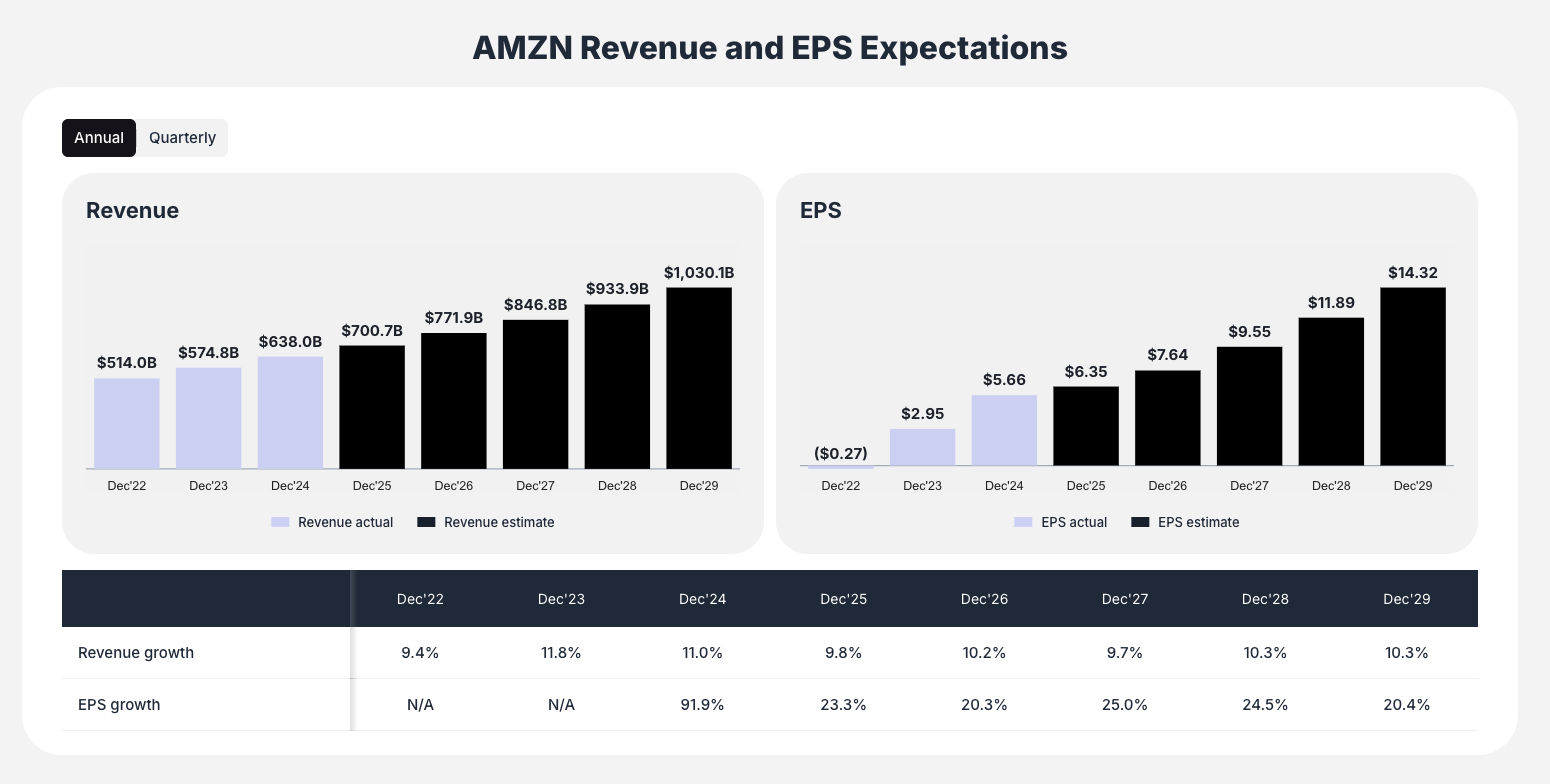
Amazon (Q4 2023 vs Q4 2022)
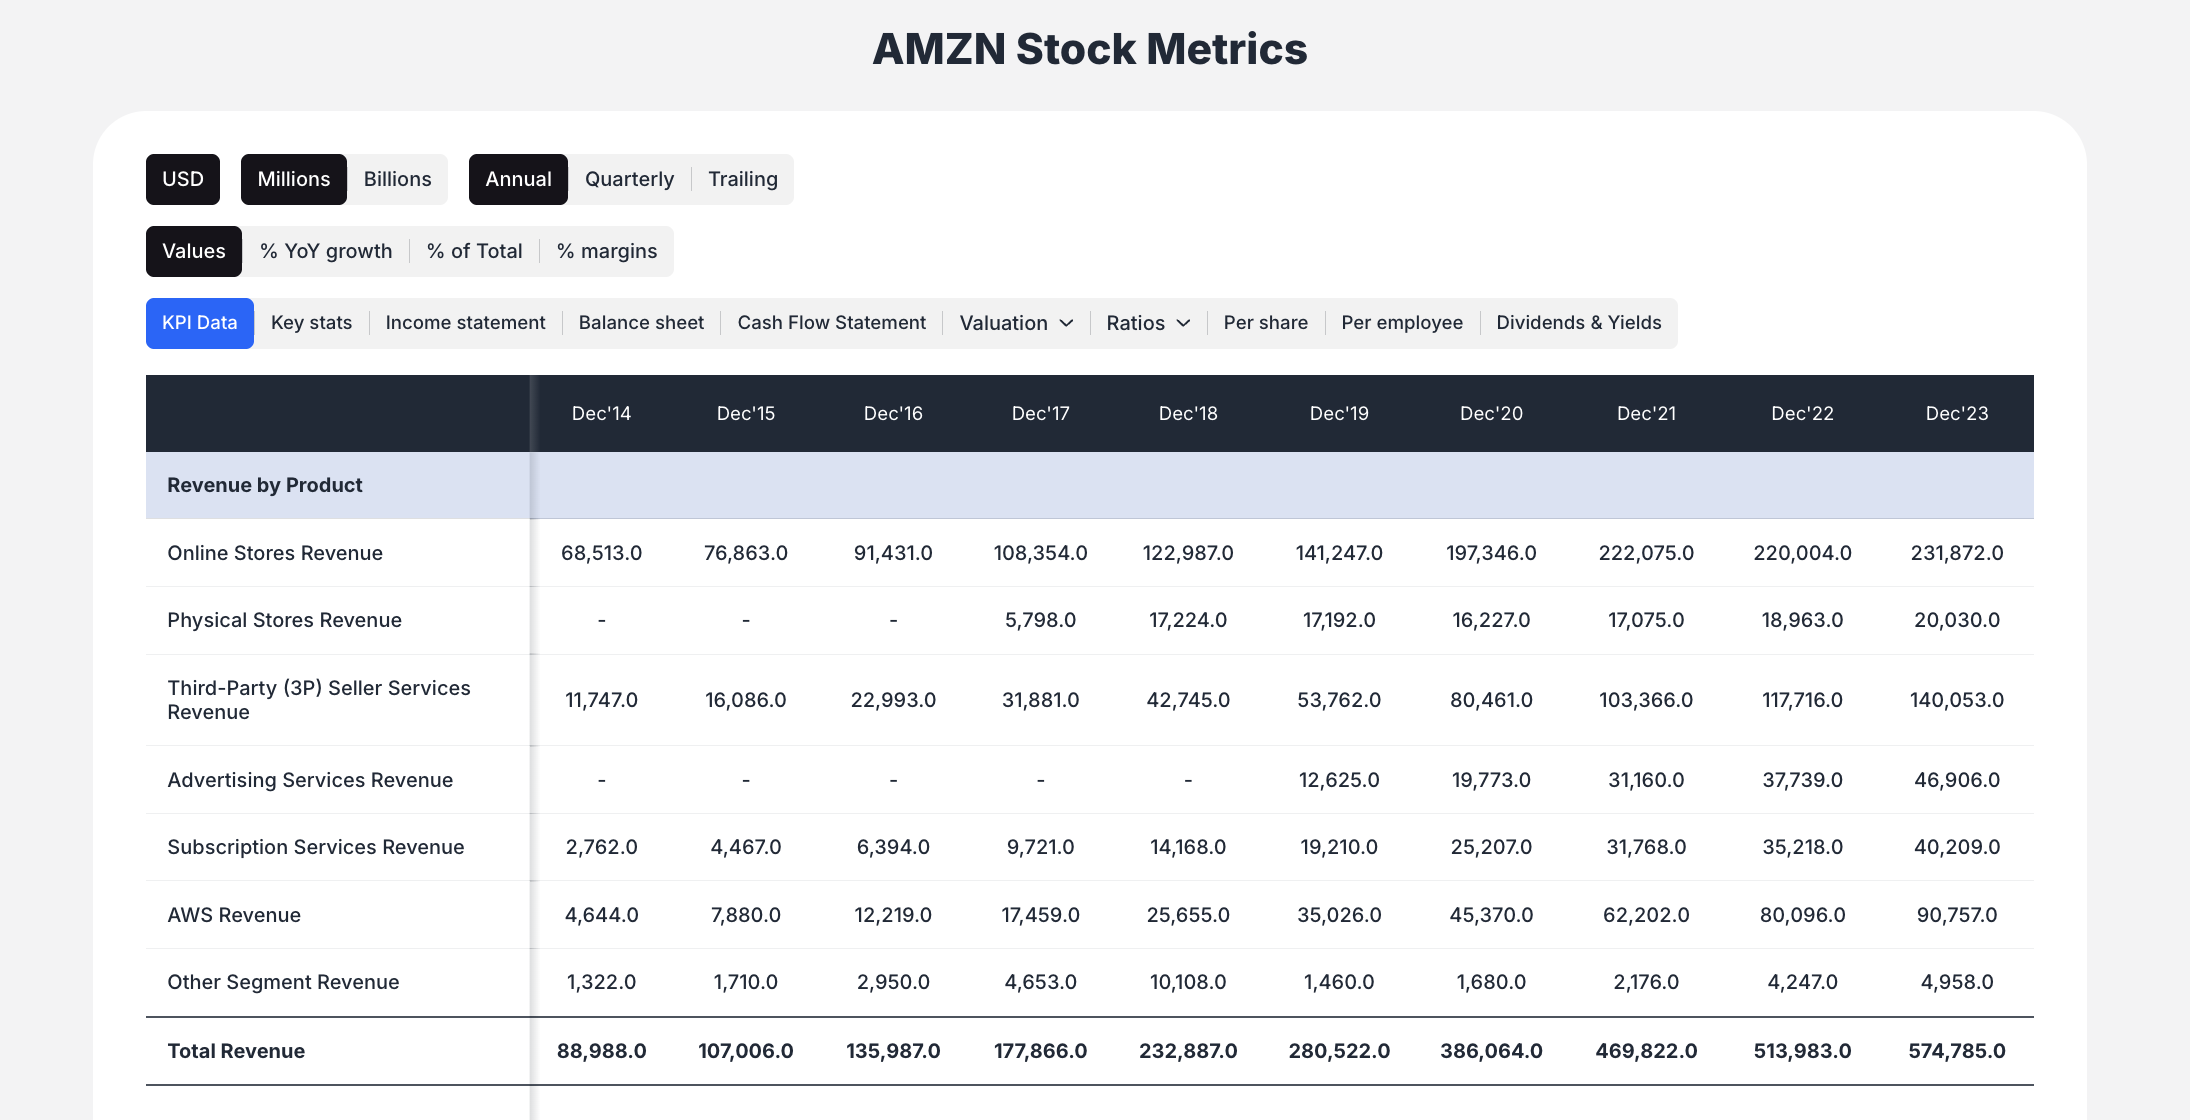
- Total Revenue: $574.79B (+11.8%)
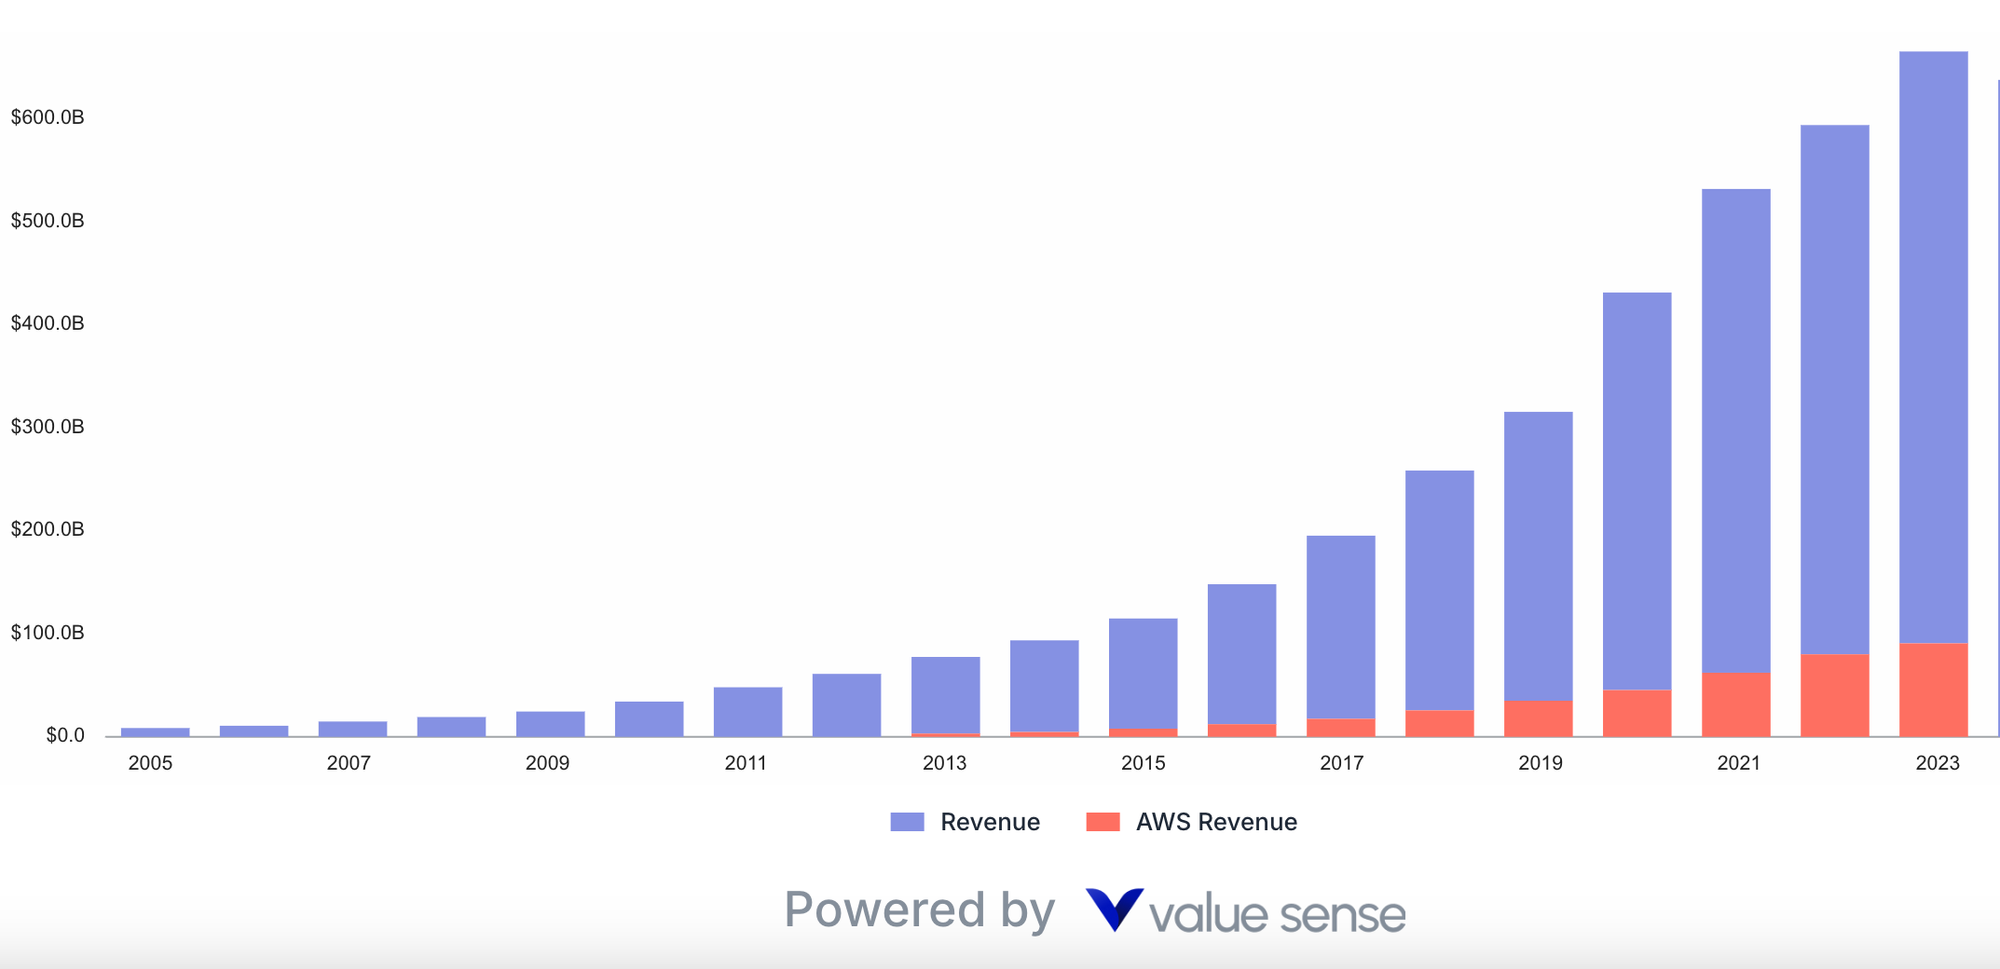
- AWS Revenue: $90.76B (+13.2%)
- Operating Income: $36.85B (+382%)
- AWS Operating Income: $24.63B (+37.7%)
Key Operational Metrics
Google Cloud Performance (Dec 2023)
- Operating Margin: 5.2% (improved from negative in prior year)
- Revenue as % of Total: 10.8%
- Year-over-Year Growth: 25.6%
AWS Performance (Dec 2023)
- Operating Margin: 27.1%
- Revenue as % of Total: 15.8%
- Year-over-Year Growth: 13.2%
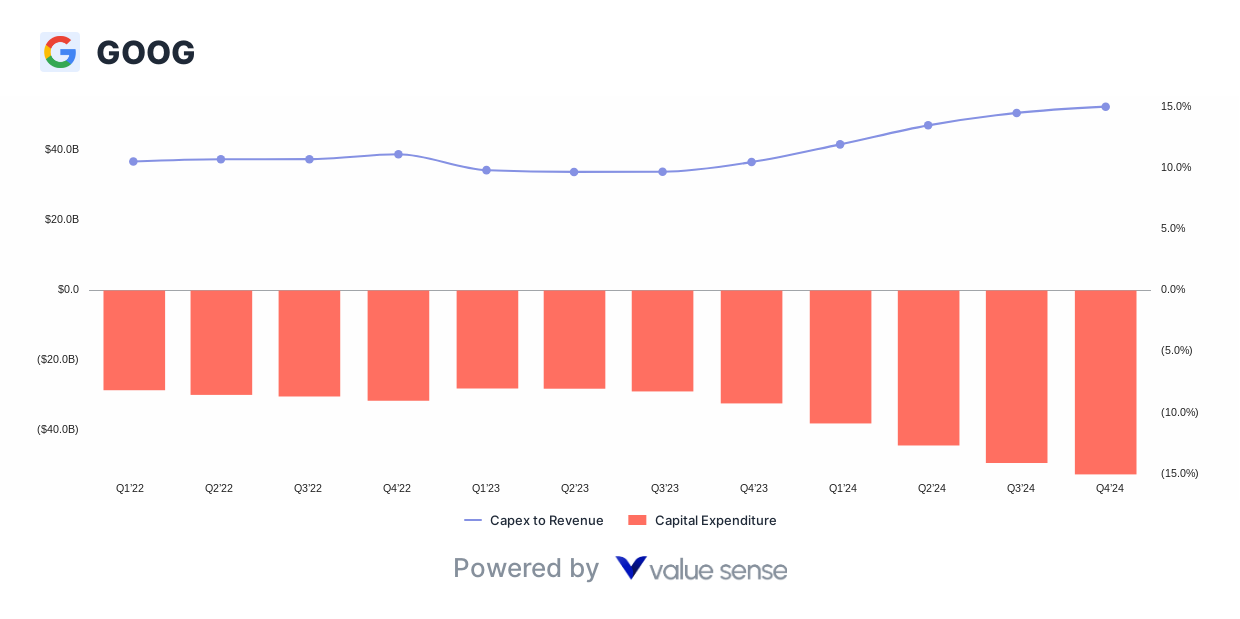
Capital Expenditure Trends
- Q4 2023 CapEx: $8.06B (-18.2% QoQ)
- Annual 2023 CapEx: $32.25B (+28.1% YoY)
- CapEx as % of Revenue: 10.5%
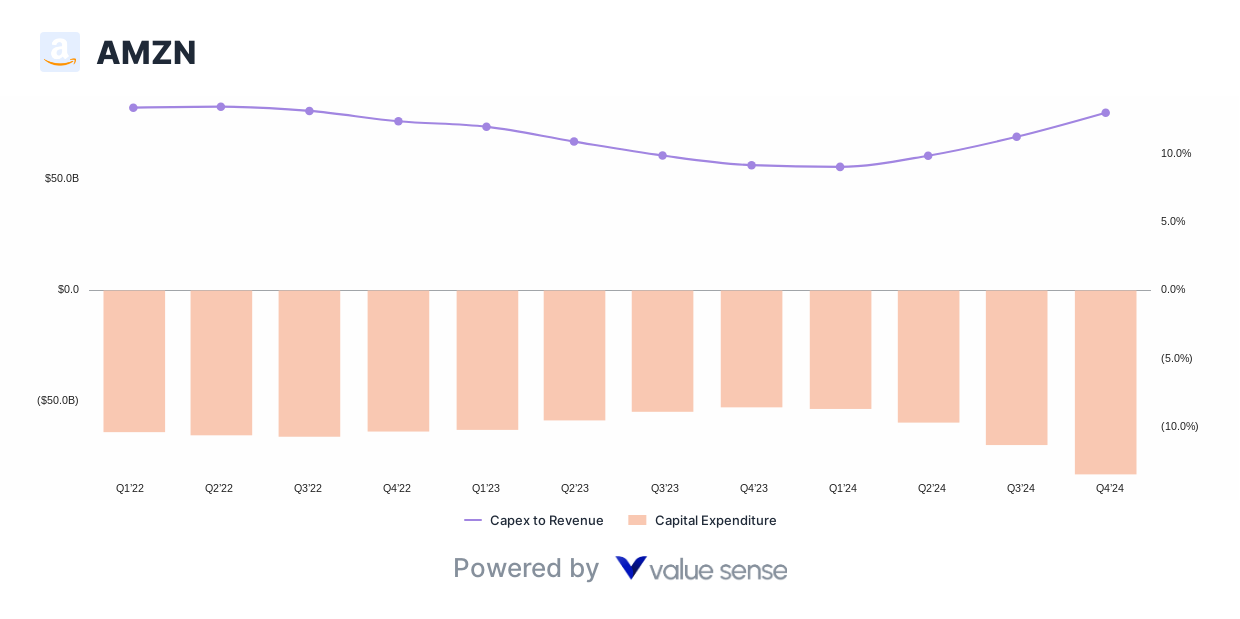
Amazon
- Q4 2023 CapEx: $12.48B (-2.8% QoQ)
- Annual 2023 CapEx: $52.73B (+18.8% YoY)
- CapEx as % of Revenue: 9.2%
The Bottom Line
While AWS maintains its crown as the cloud margin king with an impressive 37% operating margin, Google Cloud's rapid scaling and improving margins present an intriguing investment case. The relatively similar P/OCF multiples suggest the market is balancing AWS's superior profitability against Google Cloud's growth potential.
For investors, the decision between GOOG and AMZN isn't just about cloud performance—it's about balancing current profitability against future growth potential. AWS delivers immediate returns through superior margins, while Google Cloud offers the promise of rapid scaling and margin expansion.
Historical Performance Analysis
Five-Year Revenue CAGR (2019-2023)
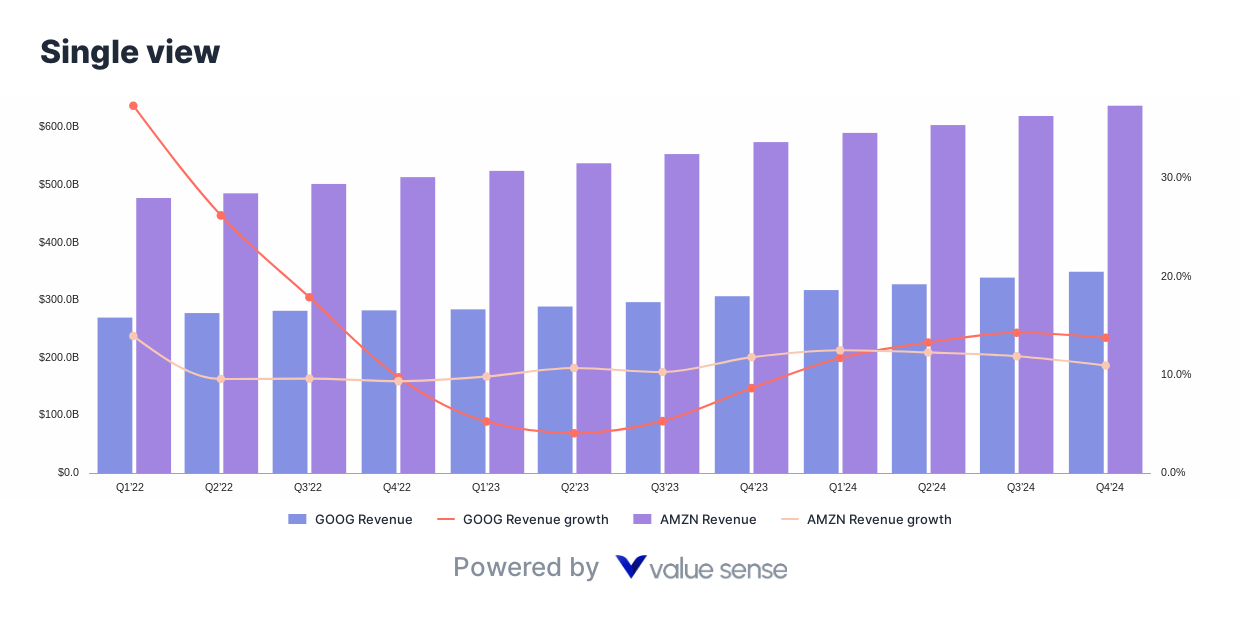
- Google Total Revenue: 18.5% CAGR
- Google Cloud: 44.2% CAGR (from $8.9B to $33.1B)
- Amazon Total Revenue: 22.1% CAGR
- AWS: 29.8% CAGR (from $35.0B to $90.8B)
Operating Efficiency Metrics
Google (2023 Full Year)
- Gross Margin: 56.4%
- Operating Margin: 27.4%
- Cloud Gross Margin: Improving from negative to positive
- R&D as % of Revenue: 15.1%
- Free Cash Flow Margin: 21.2%
Amazon (2023 Full Year)
- Gross Margin: 46.9%
- Operating Margin: 6.4%
- AWS Operating Margin: 30.3%
- R&D as % of Revenue: 11.8%
- Free Cash Flow Margin: 8.1%
Competitive Landscape Analysis
Market Share Trends
- AWS: Maintains ~32% of global cloud infrastructure market
- Google Cloud: Growing to ~11% market share
- Microsoft Azure: ~23% (key competitor for both)
Product Differentiation
- AWS Advantages:
- Broadest service portfolio (200+ services)
- Deepest enterprise relationships
- Strongest partner ecosystem
- Most mature operations
- Google Cloud Advantages:
- Superior AI/ML capabilities
- Best-in-class data analytics
- Kubernetes leadership
- Stronger developer tools
Quarterly Performance Deep Dive
Google Q4 2023 Highlights
- Search Revenue: $48.0B (+12.7% YoY)
- YouTube Ads: $9.2B (+15.5% YoY)
- Network Revenue: $8.3B (-2.1% YoY)
- Other Bets Revenue: $657M (+25.3% YoY)
- Traffic Acquisition Costs: $13.9B (23% of ad revenue)
Amazon Q4 2023 Highlights
- Online Stores: $70.5B (+4.8% YoY)
- Physical Stores: $5.2B (+6.6% YoY)
- Third-Party Seller Services: $43.6B (+18.8% YoY)
- Subscription Services: $10.5B (+14.2% YoY)
- Advertising Services: $14.7B (+26.8% YoY)
Balance Sheet Strength
Google (Dec 2023)
- Cash & Equivalents: $110.9B
- Total Assets: $402.4B
- Total Debt: $28.5B
- Net Cash Position: $82.4B
- Current Ratio: 2.1x
Amazon (Dec 2023)
- Cash & Equivalents: $73.4B
- Total Assets: $527.9B
- Total Debt: $135.6B
- Net Debt Position: $62.2B
- Current Ratio: 0.9x
Strategic Initiatives & Future Growth Drivers
Google's Growth Catalysts
- AI Integration: Gemini AI model deployment across products
- Cloud Enterprise: Expanding enterprise customer base
- YouTube Monetization: Shorts and subscription growth
- Pixel Hardware: Ecosystem expansion
- Waymo: Autonomous driving leadership
Amazon's Growth Catalysts
- AWS Innovation: Generative AI services (Bedrock)
- Advertising: Third-largest digital ad platform
- Healthcare: Amazon Pharmacy and One Medical
- Logistics: Rivian investment and delivery optimization
- International Expansion: India and emerging markets
Looking Ahead
As both companies continue to invest heavily in AI and cloud infrastructure, the key metrics to watch will be:
- Google Cloud's margin expansion trajectory
- AWS's ability to maintain margin leadership
- Market share shifts in the cloud infrastructure space
- Integration of AI capabilities into cloud offerings
The cloud wars are far from over, and both companies remain well-positioned to capitalize on the continued growth of cloud computing and AI adoption.
Risk Factors to Consider
Google Risks
- Regulatory Scrutiny: Antitrust concerns globally
- Search Competition: AI-powered alternatives (ChatGPT, Bing)
- Privacy Regulations: Impact on advertising business
- Cloud Market Competition: Playing catch-up to AWS and Azure
- Economic Sensitivity: Ad spending volatility
Amazon Risks
- Margin Pressure: Retail business profitability
- Labor Relations: Unionization efforts
- Competition: Walmart, Target in retail; Microsoft in cloud
- Regulatory Environment: FTC scrutiny
- Economic Cycles: Consumer spending sensitivity
Investment Thesis Summary
Why Invest in Google (GOOG)
- Dominant search position with 90%+ market share
- YouTube's growing monetization and content dominance
- Rapid cloud growth with improving margins
- Strong balance sheet with significant net cash
- AI leadership potential with DeepMind and Gemini
Why Invest in Amazon (AMZN)
- AWS profitability drives overall margins
- E-commerce dominance with expanding categories
- Advertising growth as third major revenue stream
- Prime ecosystem with high customer retention
- Innovation culture entering new markets
Analyst Recommendations
Google (GOOG)
- Average Price Target: $200 (implies 12% upside)
- Consensus Rating: Strong Buy
- Bull Case: $250 (AI monetization success)
- Bear Case: $150 (regulatory headwinds)
Amazon (AMZN)
- Average Price Target: $225 (implies 20% upside)
- Consensus Rating: Buy
- Bull Case: $275 (AWS margin expansion)
- Bear Case: $160 (retail margin pressure)
Technical Analysis
Google Stock Performance
- 52-Week Range: $120-$180
- RSI: 58 (neutral territory)
- 50-Day MA: $168
- 200-Day MA: $155
- Support Level: $160
Amazon Stock Performance
- 52-Week Range: $125-$190
- RSI: 62 (slightly overbought)
- 50-Day MA: $178
- 200-Day MA: $165
- Support Level: $170

Conclusion
The Google vs Amazon comparison reveals two tech giants with different strengths and growth trajectories. AWS remains the profit powerhouse with unmatched margins, while Google Cloud represents the high-growth challenger with significant upside potential.
For value investors, Amazon's proven cloud profitability and diverse revenue streams offer stability. For growth investors, Google's accelerating cloud business and AI leadership present compelling opportunities.
Both stocks deserve consideration in a diversified technology portfolio, with position sizing based on individual risk tolerance and investment objectives.
This analysis is based on data compiled by Value Sense as of April 2025. Investors should conduct thorough due diligence before making investment decisions.
Explore More Investment Opportunities
For investors seeking undervalued companies with high fundamental quality, our analytics team provides curated stock lists:
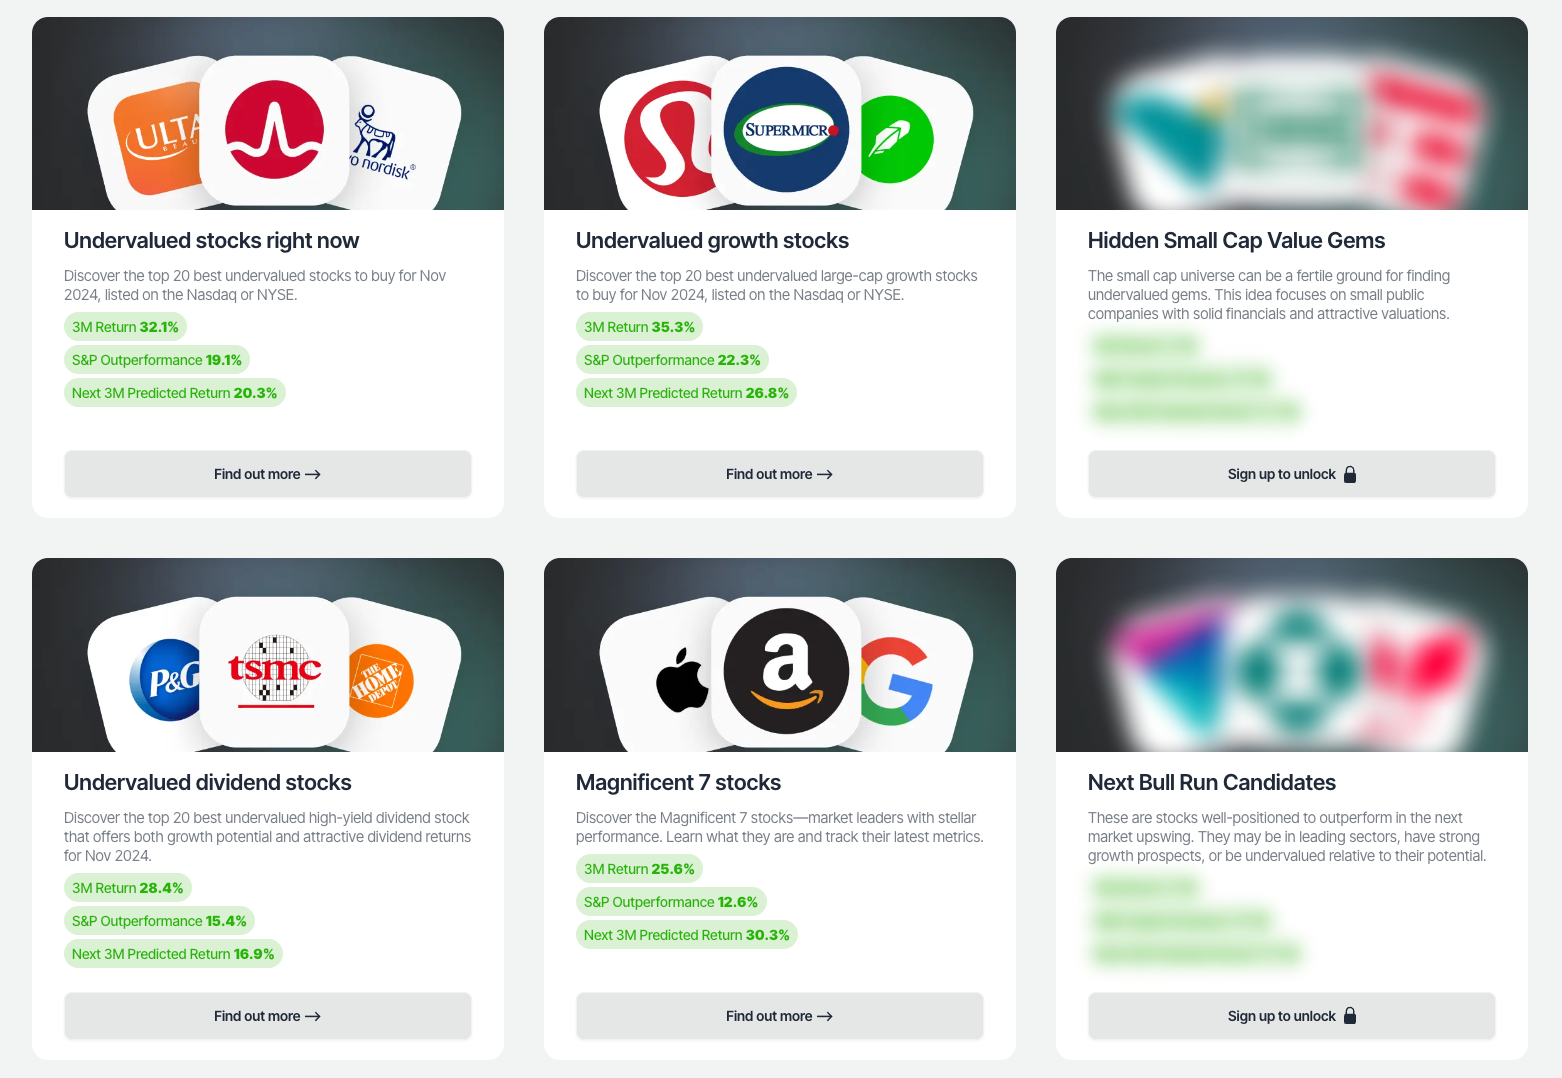
📌 50 Undervalued Stocks (Best overall value plays for 2025)
📌 50 Undervalued Dividend Stocks (For income-focused investors)
📌 50 Undervalued Growth Stocks (High-growth potential with strong fundamentals)
🔍 Check out these stocks on the Value Sense platform for free!
More Articles You Might Like
📖 Rule of 40 Analysis: High-Performance Tech Stocks
📖 S&P 500 Fair Value Heatmap
📖 9 Undervalued Low Debt Stocks to Buy - 2025
FAQ: Google vs Amazon Cloud Analysis
Q: Which company has better cloud margins - Google or Amazon?
A: Amazon Web Services (AWS) has significantly better cloud margins at 37.0% compared to Google Cloud's 14.1% as of Q4 2024. AWS maintains nearly 3x higher margins, demonstrating its maturity and scale efficiencies.
Q: Is Google Cloud catching up to AWS?
A: Yes, Google Cloud is scaling rapidly with 25.6% year-over-year growth compared to AWS's 13.2%. While AWS remains the market leader, Google Cloud's margins have improved from negative territory to 14.1%, showing successful scaling efforts.
Q: Which stock is more expensive - GOOG or AMZN?
A: Both stocks trade at similar valuations with Google at 14.8x P/OCF and Amazon at 15.6x P/OCF (Last Twelve Months). This suggests the market is pricing in Google Cloud's growth potential against AWS's established profitability.
Q: What is the revenue growth comparison between the two companies?
A: Amazon has grown total revenue at 22.1% CAGR over five years versus Google's 18.5%. However, Google Cloud has grown faster at 44.2% CAGR compared to AWS's 29.8% CAGR.
Q: Which company has a stronger balance sheet?
A: Google has a stronger balance sheet with $110.9B in cash and a net cash position of $82.4B, compared to Amazon's $73.4B in cash and net debt position of $62.2B.
Q: How do the companies compare in terms of operating efficiency?
A: Google has higher gross margins (56.4% vs 46.9%) and operating margins (27.4% vs 6.4%) overall. However, AWS specifically has superior operating margins (30.3%) compared to Google Cloud (5.2% annual).
Q: What market share does each cloud provider have?
A: AWS maintains approximately 32% of the global cloud infrastructure market, while Google Cloud has grown to about 11%. Microsoft Azure sits between them at roughly 23%.
Q: What are the key competitive advantages of each cloud platform?
A: AWS offers the broadest service portfolio (200+ services) and deepest enterprise relationships. Google Cloud excels in AI/ML capabilities, data analytics, and developer tools.
Q: How much revenue does each cloud business generate?
A: As of Q4 2023, AWS generates $90.8B annually (15.8% of Amazon's total revenue), while Google Cloud generates $33.1B annually (10.8% of Google's total revenue).
Q: Which stock is better for value investors?
A: Amazon may appeal more to value investors due to AWS's proven profitability and diverse revenue streams, offering more stability despite trading at a slightly higher multiple.
Q: Which stock is better for growth investors?
A: Google may be more attractive to growth investors due to Google Cloud's faster growth rate, improving margins, and potential AI leadership, despite currently lower cloud margins.
Q: What are the main risks for each company?
A: Google faces regulatory scrutiny, search competition from AI alternatives, and privacy regulation impacts. Amazon faces retail margin pressure, labor relations issues, and e-commerce competition.
Q: What are the key growth drivers for each company?
A: Google's growth catalysts include AI integration (Gemini), cloud enterprise expansion, and YouTube monetization. Amazon's drivers include AWS innovation, digital advertising growth, and healthcare expansion.
Q: How much are these companies investing in their cloud businesses?
A: Google's annual CapEx reached $32.25B in 2023 (10.5% of revenue), while Amazon invested $52.73B (9.2% of revenue), with significant portions allocated to cloud infrastructure.
Q: What do analysts predict for these stocks?
A: Analysts have an average price target of $200 for Google (12% upside) with a Strong Buy rating, and $225 for Amazon (20% upside) with a Buy rating.
Q: How do the technical indicators look for both stocks?
A: Google shows neutral RSI at 58 with support at $160, while Amazon has a slightly overbought RSI at 62 with support at $170. Both stocks trade above their 50-day and 200-day moving averages.
Q: Which company has better free cash flow?
A: Google has superior free cash flow margins at 21.2% compared to Amazon's 8.1%, indicating better cash generation efficiency relative to revenue.
Q: How do their capital allocation strategies differ?
A: Google scores 7.5/10 on capital allocation versus Amazon's 6.1/10, reflecting Google's stronger balance sheet management and more conservative debt approach.