ValueSense Intrinsic Value Tools - Ben Graham Fair Value
The Ben Graham Fair Value calculator implements the foundational value investing principles of Benjamin Graham, the "father of value investing." This tool calculates a stock's intrinsic value using Graham's time-tested formula, which combines earnings power, growth expectations, and interest rate conditions to determine whether a stock is trading above or below its fair value.
Accessing the Ben Graham Fair Value Calculator
From the Intrinsic Value Tools Hub
- Navigate to the main ValueSense page and scroll to the "Intrinsic value tools hub"
- Locate the "Ben Graham Fair Value" card
- Click "Find out more →" to access the calculator's main page
- Search for a stock using the search bar or select from suggested tickers


What the Ben Graham Fair Value Method Does
Core Purpose
The tool provides intrinsic value analysis based on Benjamin Graham's investment principles, determining whether a stock is overvalued or undervalued by comparing the calculated fair value to the current market price.
Methodology Foundation
Graham's approach focuses on:
- Earnings Power: Using current earnings per share as the foundation
- Growth Expectations: Incorporating expected earnings growth rates
- Interest Rate Environment: Adjusting for current bond yields
- Conservative Base: Starting with a no-growth P/E ratio assumption
Investment Philosophy
Based on Graham's principle of buying stocks when they trade significantly below their intrinsic value, providing a "margin of safety" for investors.
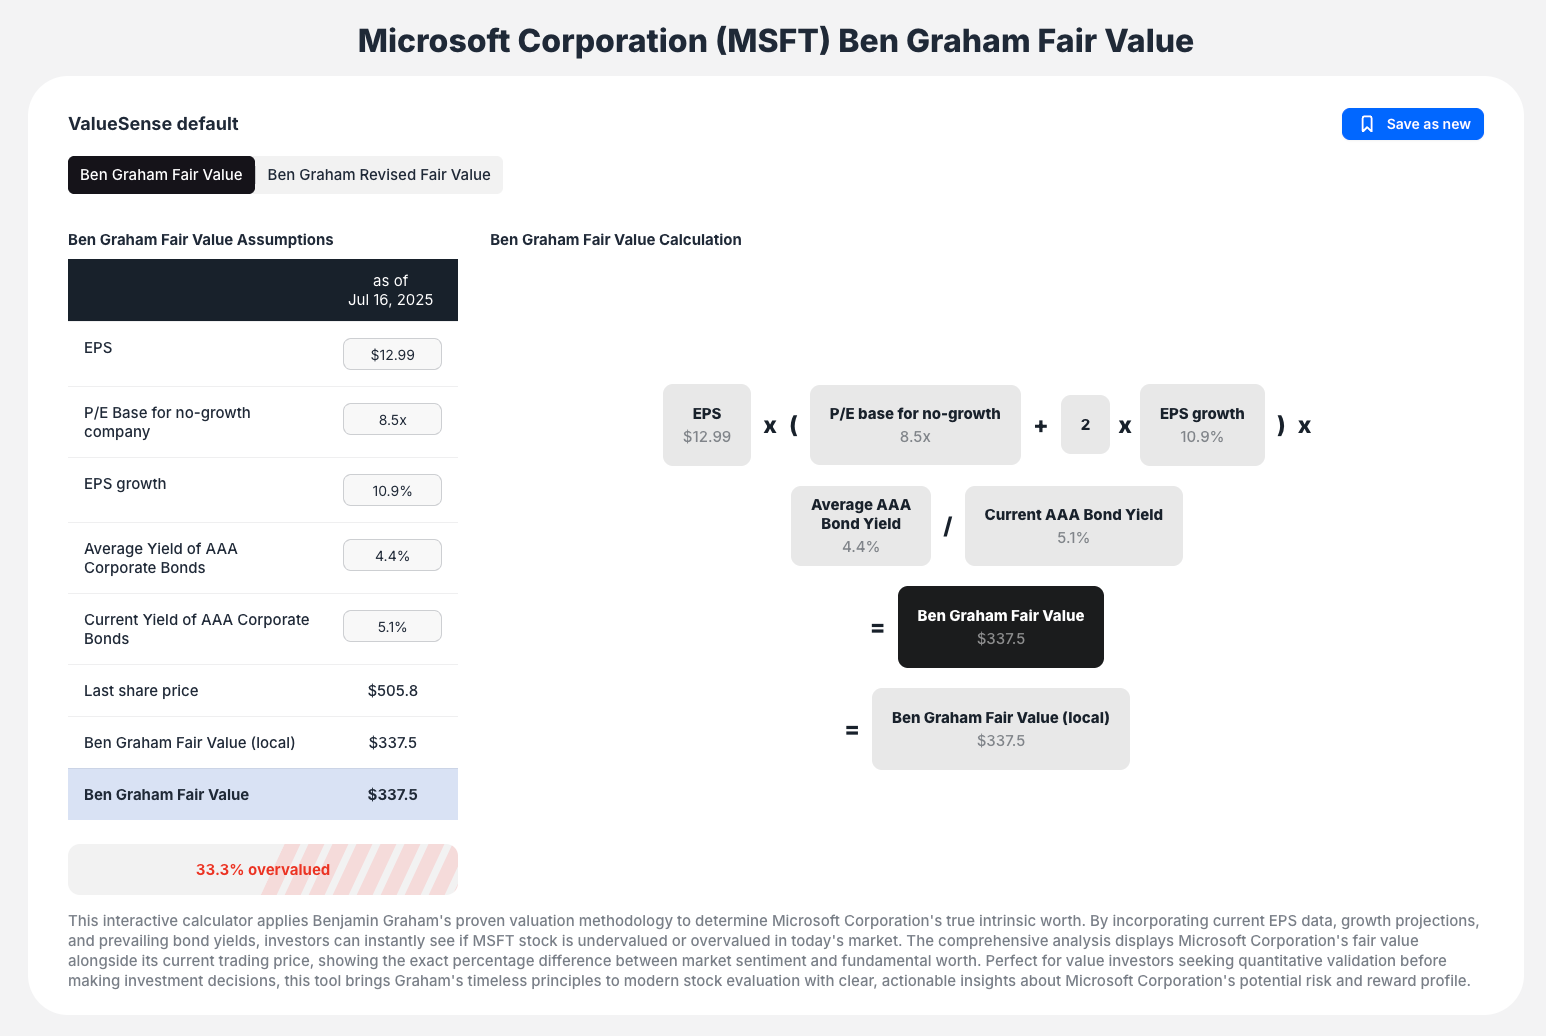
Ben Graham Fair Value Formula
Classic Formula
Fair Value = EPS × (P/E Base for no-growth + 2 × EPS growth) × (Average AAA Bond Yield / Current AAA Bond Yield)
Formula Components
- EPS: Current earnings per share
- P/E Base: Base price-to-earnings ratio for a no-growth company
- EPS Growth: Expected earnings growth rate
- Average AAA Bond Yield: Historical average yield
- Current AAA Bond Yield: Current market yield
Input Data and Customization
Default Parameters
ValueSense provides "ValueSense default" assumptions for all key inputs:
- EPS (Earnings Per Share): Current earnings performance
- P/E Base for no-growth company: Conservative base multiple
- EPS growth: Expected earnings growth rate
- Average Yield of AAA Corporate Bonds: Historical benchmark
- Current Yield of AAA Corporate Bonds: Current market conditions
Customizable Assumptions
- Interactive Fields: Located in "Ben Graham Fair Value Assumptions" section
- Real-time Updates: All outputs update instantly when you modify inputs
- Scenario Testing: Test different growth rates, interest rate environments, and earnings assumptions
- Save Functionality: Use "Save as new" to preserve custom analysis scenarios
Dual Model Options
Ben Graham Fair Value (Original)
- Classic formula as originally developed by Graham
- Time-tested approach used by value investors for decades
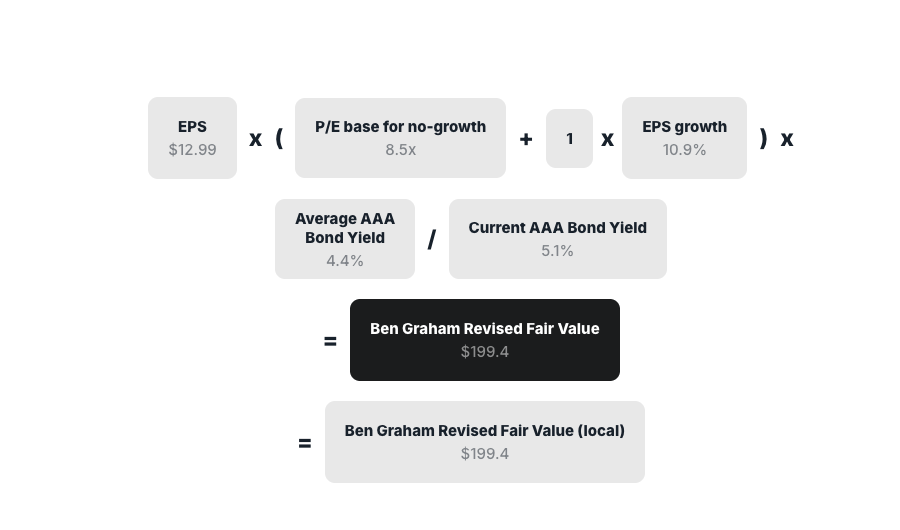
Ben Graham Revised Fair Value
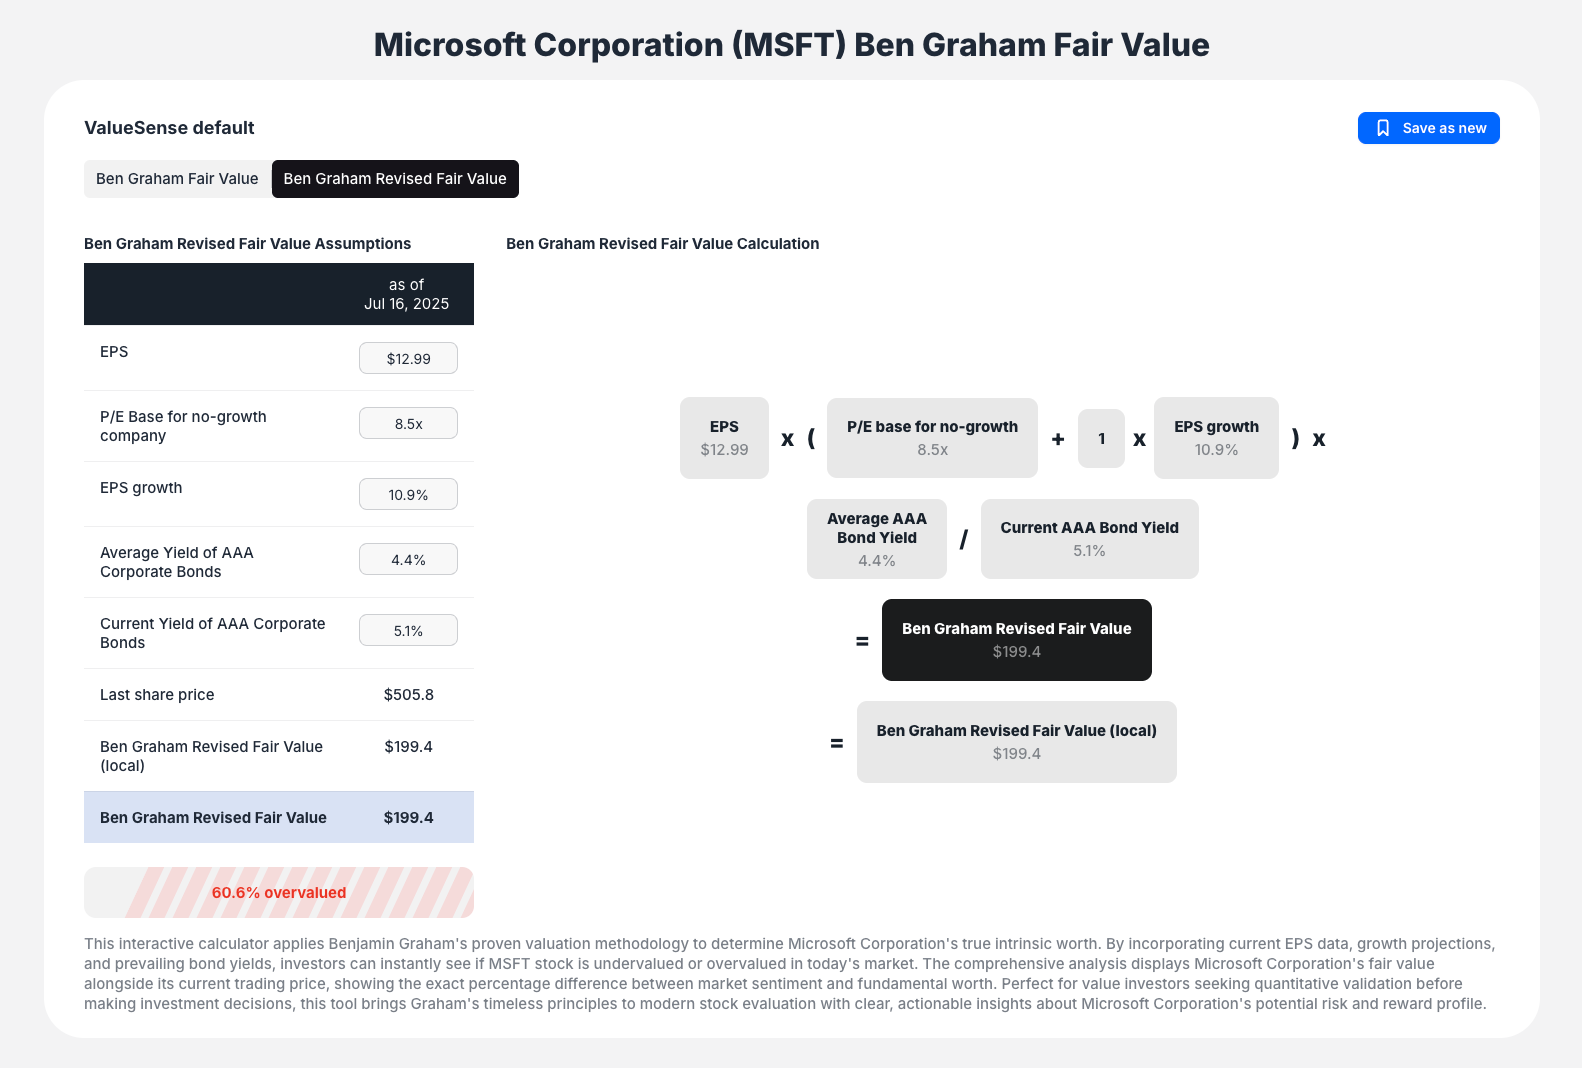
- Modified version of the original formula
- Alternative perspective available via tabbed interface
- Enhanced methodology for modern market conditions
Comprehensive Results and Outputs
Primary Valuation Results
- Ben Graham Fair Value: Calculated dollar value per share (e.g., $337.5)
- Valuation Status: Clear over/undervaluation percentage (e.g., "MSFT is 3.7% overvalued")
- Summary Cards: Key metrics including LTM EPS, EPS growth, and fair value
Visual Formula Display
- Calculation Breakdown: Shows exactly how the fair value is derived
- Transparent Process: All inputs and calculations clearly displayed
- Educational Value: Helps users understand the methodology
Peer Comparison Table
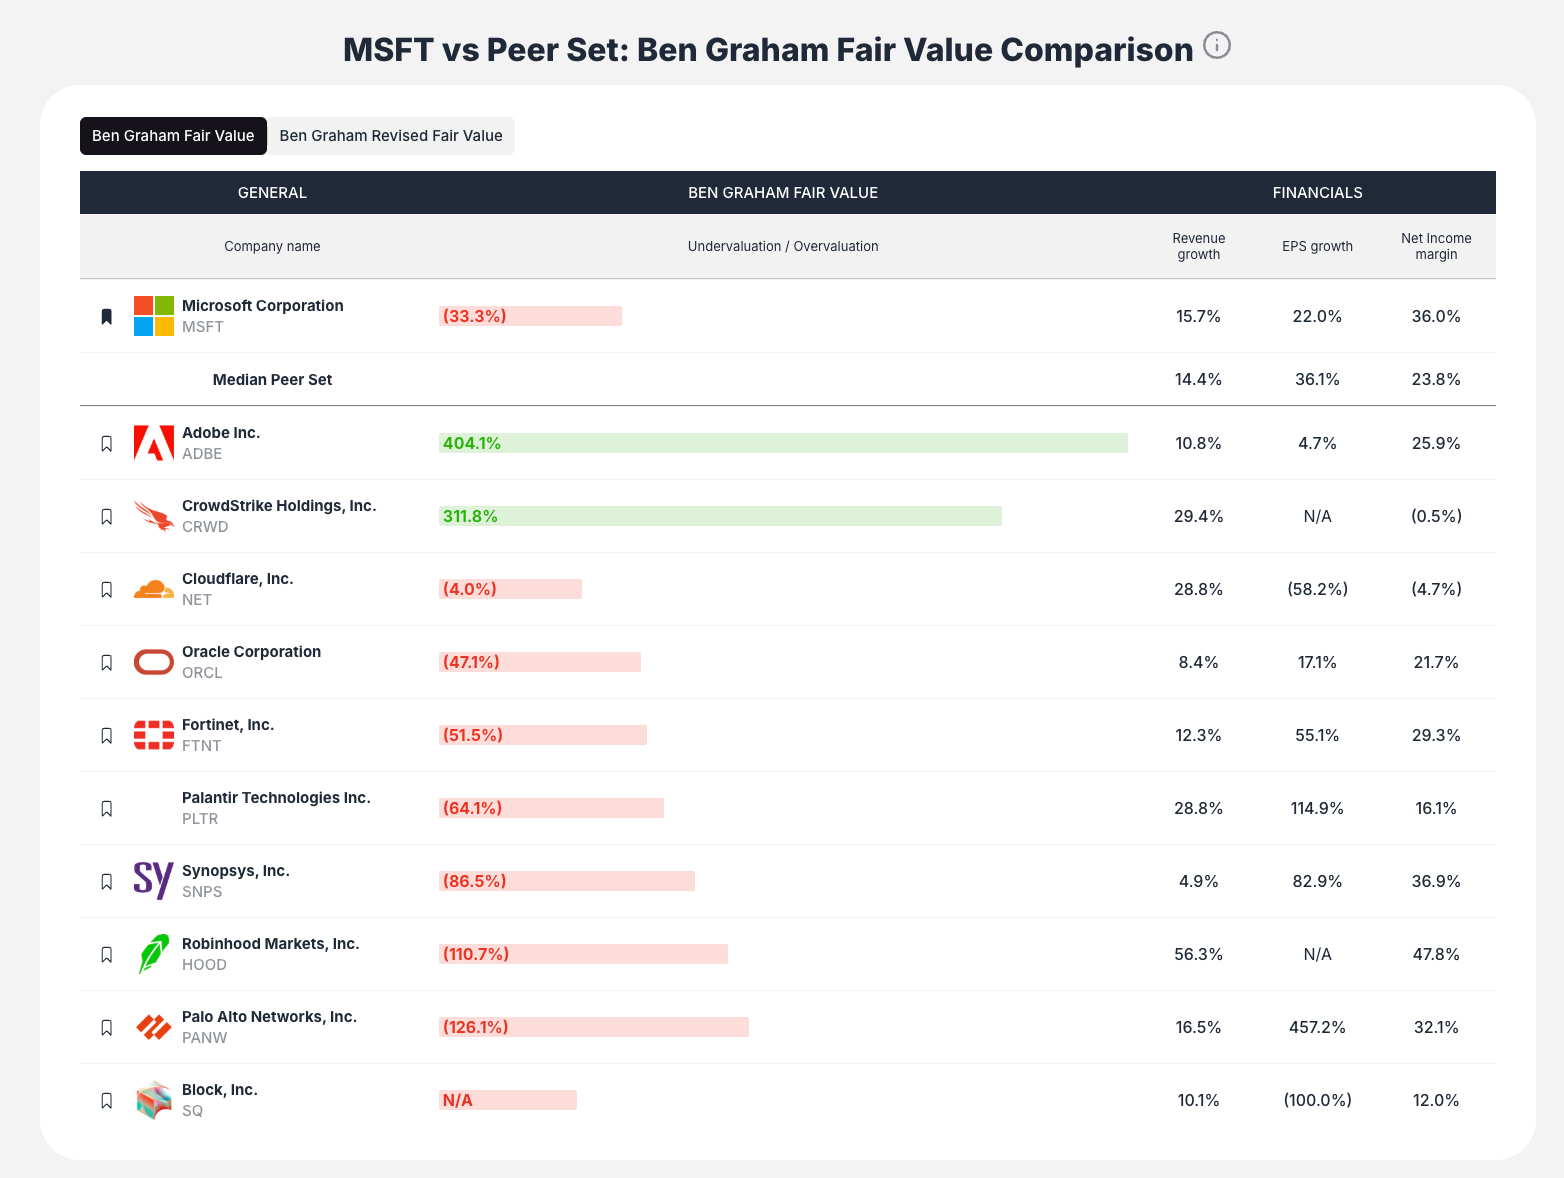
- Industry Context: Compare your stock to direct competitors
- Valuation Benchmarking: See which peers are over/undervalued
- Color-coded Results: Green for undervalued, red for overvalued companies
- Competitive Analysis: Understand relative valuation within industry
Supporting Historical Charts
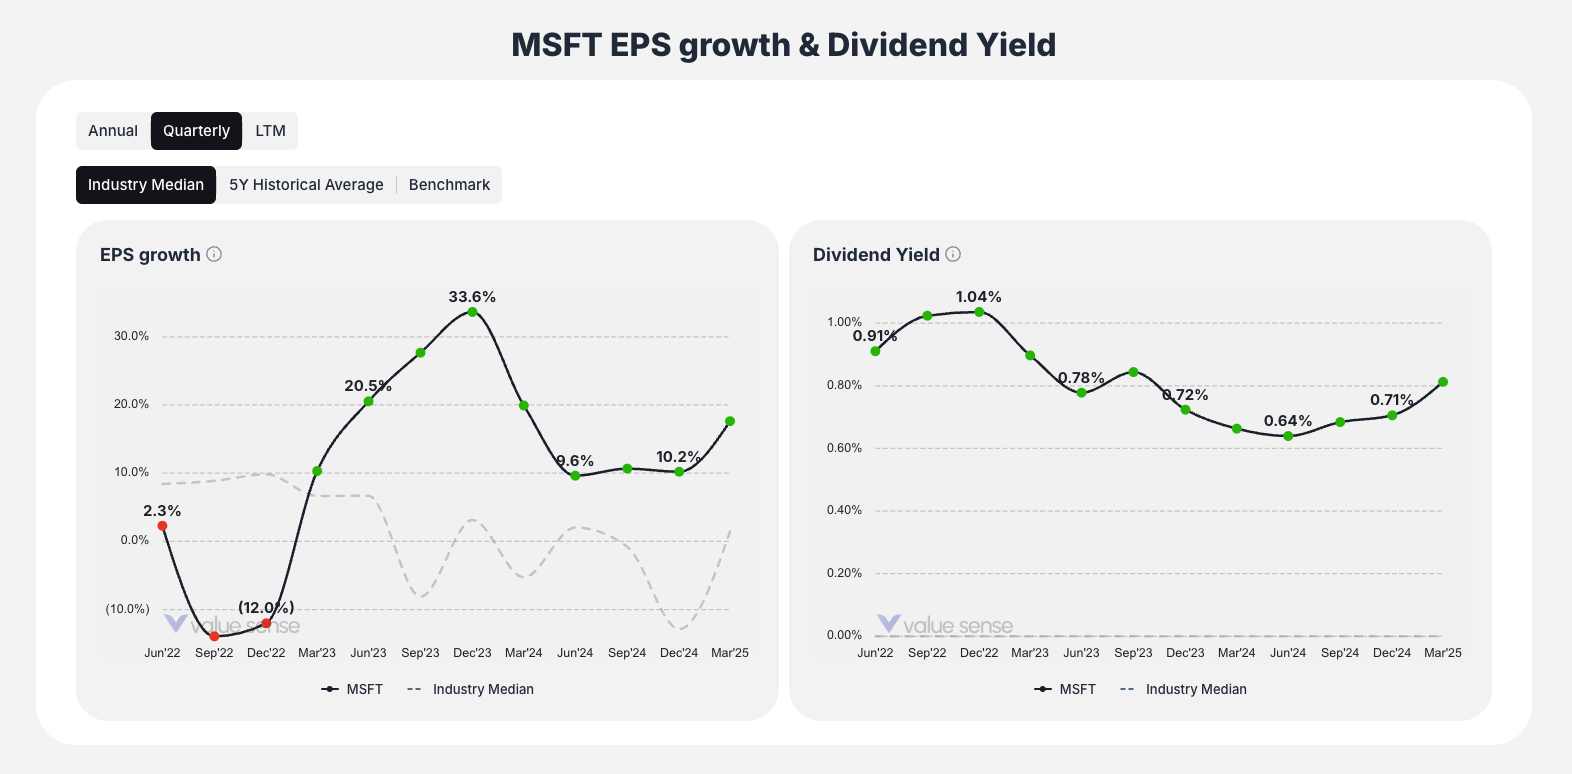
- EPS Growth History: Historical earnings growth patterns
- Dividend Yield Trends: Income component analysis
- Industry Median Comparisons: Context for current metrics
How to Interpret Results
Primary Interpretation
- Compare Fair Value to Current Price
- Higher fair value = potentially undervalued opportunity
- Lower fair value = potentially overvalued risk
- Analyze Over/Undervaluation Percentage
- Negative (red) = trading above fair value
- Positive (green) = trading below fair value
- Larger percentages indicate stronger signals
Advanced Analysis
- Sensitivity Testing: Modify assumptions to see impact on valuation
- Scenario Planning: Test different economic conditions (interest rates, growth rates)
- Peer Context: Use comparison table to understand if valuation is company-specific or industry-wide
Key Workflow Steps
Step 1: Access and Select
Navigate to the Ben Graham Fair Value tool and select your target stock
Step 2: Review Baseline Analysis
- Examine initial valuation using ValueSense default assumptions
- Note the calculated fair value and over/undervaluation status
- Review the visual formula breakdown
Step 3: Customize Assumptions
- Adjust parameters in the "Assumptions" section based on your research
- Test different scenarios (growth rates, interest rate changes)
- Observe real-time updates to fair value calculations
Step 4: Analyze Results
- Compare customized fair value to current market price
- Assess the magnitude of over/undervaluation
- Consider the margin of safety
Step 5: Add Context
- Review peer comparison table for industry perspective
- Examine historical charts for trend validation
- Understand competitive positioning
Step 6: Save and Explore
- Save custom scenarios for future reference
- Explore other valuation tools for the same stock
- Consider adding to watchlist if attractive
Best Practices
Assumption Validation
- Review historical EPS growth patterns before setting growth assumptions
- Consider current interest rate environment and trends
- Use conservative estimates for margin of safety
Comparative Analysis
- Always review peer comparison table
- Understand industry-specific factors affecting valuations
- Consider competitive positioning and market dynamics
Scenario Testing
- Test multiple growth scenarios (conservative, base, optimistic)
- Vary interest rate assumptions based on economic outlook
- Understand sensitivity to key assumptions
Graham's Principles
- Look for significant undervaluation (margin of safety)
- Consider earnings quality and sustainability
- Focus on established companies with predictable earnings
Key Questions the Tool Answers
- "What is this stock worth according to Ben Graham's method?"
- Direct answer through fair value calculation
- "Is this stock undervalued enough to provide a margin of safety?"
- Over/undervaluation percentage shows safety margin
- "How sensitive is the valuation to my assumptions?"
- Interactive inputs allow immediate sensitivity analysis
- "How does this compare to similar companies?"
- Peer comparison table provides industry context
- "What if interest rates or growth rates change?"
- Customizable inputs allow scenario testing
Limitations and Considerations
Best Suited For
- Established companies with consistent earnings
- Value-oriented investment strategies
- Conservative valuation approaches
Less Suitable For
- High-growth companies with minimal current earnings
- Cyclical companies with volatile earnings
- Companies in rapidly changing industries
The Ben Graham Fair Value calculator brings the wisdom of value investing's founding father to your analysis toolkit, providing a disciplined, conservative approach to stock valuation that has withstood the test of time and market cycles.