
Best Dividend Growth Stocks: 13 Quality Companies with Strong Payout Momentum
Welcome to the Value Sense Blog, your resource for insights on the stock market! At Value Sense, we focus on intrinsic value tools and offer stock ideas with undervalued companies. Dive into our research products and learn more about our unique approach at valuesense.io
Explore diverse stock ideas covering technology, healthcare, and commodities sectors. Our insights are crafted to help investors spot opportunities in undervalued growth stocks, enhancing potential returns. Visit us to see evaluations and in-depth market research.
Market Overview & Selection Criteria
The dividend growth investing strategy has proven resilient across market cycles, offering investors both income stability and capital appreciation potential. This curated collection focuses on companies demonstrating strong dividend fundamentals across multiple metrics: sustainable payout ratios, consistent dividend per share (DPS) growth trajectories, and attractive yields on cost for long-term holders.
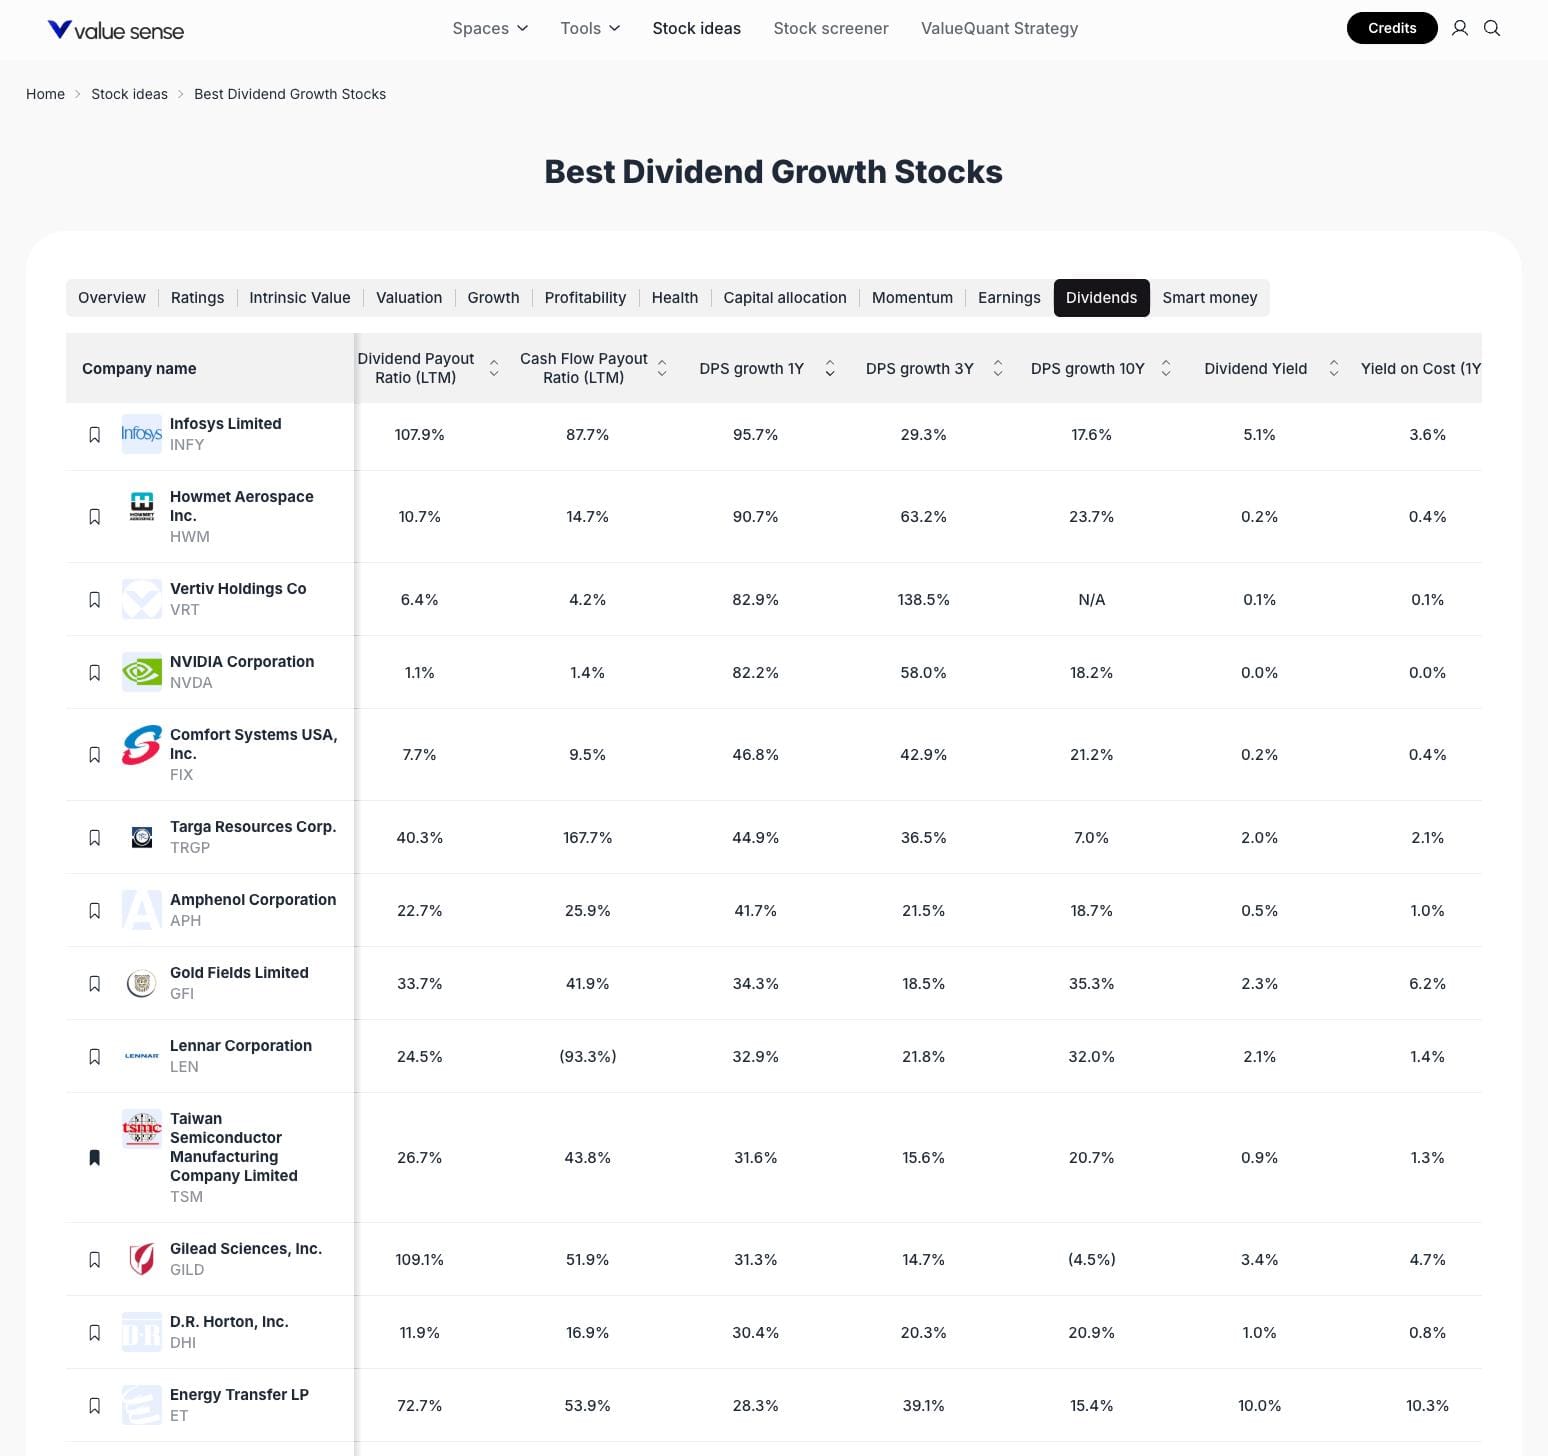
Our selection methodology prioritizes companies with dividend payout ratios below 110% (indicating sustainable distributions from earnings), positive DPS growth over 1-year and 3-year periods, and cash flow payout ratios that suggest financial health. The featured stocks span technology, industrials, commodities, healthcare, and consumer sectors, providing diversification opportunities while maintaining focus on income generation.
Featured Stock Analysis
Stock #1: Infosys Limited (INFY)
| Metric | Value |
|---|---|
| Dividend Payout Ratio (LTM) | 107.9% |
| Cash Flow Payout Ratio (LTM) | 87.7% |
| DPS Growth 1Y | 95.7% |
| DPS Growth 3Y | 29.3% |
| DPS Growth 10Y | 17.6% |
| Dividend Yield | 5.1% |
| Yield on Cost (10Y) | 3.6% |
Investment Thesis: Infosys represents a compelling opportunity in the IT services sector with exceptional dividend growth momentum. The company delivered remarkable 95.7% DPS growth over the past year, reflecting management's confidence in cash generation capabilities and shareholder return priorities. While the payout ratio of 107.9% appears elevated above the 100% threshold, the more sustainable cash flow payout ratio of 87.7% suggests the dividend remains well-covered by actual cash generation rather than just accounting earnings.
The 5.1% current dividend yield positions Infosys competitively among technology stocks, which typically offer lower yields. Long-term holders benefit from a 3.6% yield on cost based on 10-year purchase prices, demonstrating meaningful dividend growth compounding. The company's consistent DPS growth across multiple timeframes (29.3% over 3 years, 17.6% over 10 years) indicates sustainable growth rather than one-time special dividends.
Key Catalysts:
- Digital transformation spending driving revenue growth in core IT services
- Strong free cash flow generation supporting dividend sustainability
- Geographic diversification across North America, Europe, and emerging markets
- Expanding margin profile from automation and offshore delivery advantages
Risk Factors:
- Elevated payout ratio above 100% requires monitoring for potential dividend cuts
- Currency fluctuation exposure with significant USD-denominated revenues
- Competition from Indian IT peers and global consulting firms
- Client concentration risk in financial services and retail sectors
Stock #2: Howmet Aerospace Inc. (HWM)
| Metric | Value |
|---|---|
| Dividend Payout Ratio (LTM) | 10.7% |
| Cash Flow Payout Ratio (LTM) | 14.7% |
| DPS Growth 1Y | 90.7% |
| DPS Growth 3Y | 63.2% |
| DPS Growth 10Y | 23.7% |
| Dividend Yield | 0.2% |
| Yield on Cost (10Y) | 0.4% |
Investment Thesis: Howmet Aerospace presents a unique profile among dividend growth stocks with an exceptionally low 10.7% payout ratio that signals substantial room for future dividend increases. The aerospace components manufacturer demonstrated explosive recent dividend growth of 90.7% year-over-year and 63.2% over three years, reflecting the company's post-pandemic recovery and management's commitment to returning capital to shareholders.
The conservative payout metrics (10.7% of earnings, 14.7% of cash flow) indicate Howmet prioritizes balance sheet strength and reinvestment in growth opportunities while maintaining dividend flexibility. While the current 0.2% yield appears modest compared to traditional income stocks, the rapid dividend growth trajectory suggests this yield could expand significantly for new investors. The 23.7% DPS growth over 10 years demonstrates long-term commitment to shareholder distributions despite cyclical industry dynamics.
Key Catalysts:
- Commercial aerospace recovery driving demand for engine components
- Defense spending trends supporting military aircraft programs
- Capacity for substantial dividend increases given low payout ratios
- Vertical integration advantages in titanium and aluminum processing
Risk Factors:
- Low current yield may not satisfy immediate income requirements
- Cyclical exposure to commercial aerospace demand patterns
- Concentration risk in engine components manufacturing
- Supply chain dependencies for raw materials
Stock #3: Vertiv Holdings Co (VRT)
| Metric | Value |
|---|---|
| Dividend Payout Ratio (LTM) | 6.4% |
| Cash Flow Payout Ratio (LTM) | 4.2% |
| DPS Growth 1Y | 82.9% |
| DPS Growth 3Y | 138.5% |
| DPS Growth 10Y | N/A |
| Dividend Yield | 0.1% |
| Yield on Cost (10Y) | 0.1% |
Investment Thesis: Vertiv operates in the critical infrastructure space providing power management and cooling solutions for data centers, representing a growth sector with increasing dividend potential. The company's minuscule 6.4% payout ratio offers extraordinary runway for dividend expansion as management balances growth investments with shareholder returns. Recent dividend growth metrics of 82.9% annually and 138.5% over three years signal aggressive dividend acceleration from a low base.
The 4.2% cash flow payout ratio indicates Vertiv converts earnings to cash efficiently while maintaining conservative distribution policies. Though the 0.1% current yield ranks among the lowest in this collection, the company's positioning in AI infrastructure and data center expansion creates a compelling case for investors prioritizing dividend growth over current income. The lack of 10-year DPS growth data reflects Vertiv's relatively recent dividend initiation following its business combination.
Key Catalysts:
- AI computing infrastructure driving data center capacity expansion
- 5G network buildout requiring edge computing power solutions
- Thermal management innovation for high-density computing environments
- Recurring revenue streams from service and maintenance contracts
Risk Factors:
- Negligible current yield provides minimal income in near term
- Competition from established electrical equipment manufacturers
- Technology transition risks in rapidly evolving data center market
- Customer concentration among hyperscale cloud providers
Stock #4: NVIDIA Corporation (NVDA)
| Metric | Value |
|---|---|
| Dividend Payout Ratio (LTM) | 1.1% |
| Cash Flow Payout Ratio (LTM) | 1.4% |
| DPS Growth 1Y | 82.2% |
| DPS Growth 3Y | 58.0% |
| DPS Growth 10Y | 18.2% |
| Dividend Yield | 0.0% |
| Yield on Cost (10Y) | 0.0% |
Investment Thesis: NVIDIA exemplifies the growth-oriented dividend stock with nominal current yield but extraordinary capital appreciation potential coupled with emerging dividend growth. The 1.1% payout ratio represents one of the lowest among dividend-paying stocks, leaving immense capacity for future distribution increases as the company matures. Recent dividend growth of 82.2% year-over-year and 58.0% over three years demonstrates management's willingness to accelerate shareholder returns despite prioritizing reinvestment in R&D and strategic initiatives.
The semiconductor leader's position in AI accelerators and data center GPUs generates exceptional cash flow that supports both aggressive business expansion and shareholder distributions. While the 0.0% dividend yield (rounded from minimal actual yield) won't attract traditional income investors, the combination of dividend growth and stock price appreciation creates compelling total return potential. The 18.2% DPS growth over 10 years illustrates consistent commitment to dividends throughout various market cycles.
Key Catalysts:
- Generative AI adoption driving unprecedented demand for GPU computing
- Data center revenue growth outpacing gaming and professional visualization segments
- Software ecosystem development creating competitive moats
- Manufacturing partnerships ensuring supply chain resilience
Risk Factors:
- Virtually no current income generation for dividend-focused portfolios
- Valuation premiums vulnerable to technology sector corrections
- Competition from AMD, Intel, and custom AI chip development
- Geopolitical tensions affecting Taiwan semiconductor manufacturing exposure
Stock #5: Comfort Systems USA, Inc. (FIX)
| Metric | Value |
|---|---|
| Dividend Payout Ratio (LTM) | 7.7% |
| Cash Flow Payout Ratio (LTM) | 9.5% |
| DPS Growth 1Y | 46.8% |
| DPS Growth 3Y | 42.9% |
| DPS Growth 10Y | 21.2% |
| Dividend Yield | 0.2% |
| Yield on Cost (10Y) | 0.4% |
Investment Thesis: Comfort Systems operates in the mechanical and electrical contracting sector with impressive dividend growth characteristics backed by conservative payout policies. The 7.7% payout ratio ranks among the lowest in this collection, providing substantial flexibility for dividend increases even during economic downturns. The company achieved 46.8% DPS growth over the past year and 42.9% over three years, demonstrating accelerating shareholder return momentum.
Cash flow metrics remain equally strong with a 9.5% cash flow payout ratio, indicating the company generates more than sufficient cash to support distributions while funding working capital and growth investments. The 21.2% DPS growth over 10 years reflects management's long-term commitment to dividend progression despite construction industry cyclicality. While the 0.2% current yield won't satisfy immediate income needs, the growth trajectory suggests meaningful yield expansion for patient investors.
Key Catalysts:
- Infrastructure spending benefiting mechanical contracting demand
- Data center construction driving specialized HVAC and electrical work
- Energy efficiency retrofit opportunities in commercial buildings
- Acquisition strategy consolidating fragmented contractor market
Risk Factors:
- Low current yield limits near-term income generation
- Construction cycle exposure creating revenue volatility
- Labor availability constraints in skilled trades
- Project-based revenue recognition affecting earnings predictability
Stock #6: Targa Resources Corp. (TRGP)
| Metric | Value |
|---|---|
| Dividend Payout Ratio (LTM) | 40.3% |
| Cash Flow Payout Ratio (LTM) | 107.7% |
| DPS Growth 1Y | 44.9% |
| DPS Growth 3Y | 36.5% |
| DPS Growth 10Y | 7.0% |
| Dividend Yield | 2.0% |
| Yield on Cost (10Y) | 2.1% |
Investment Thesis: Targa Resources operates midstream energy infrastructure with a balanced approach to dividends combining moderate current yield and consistent growth. The 40.3% payout ratio sits comfortably in sustainable territory, though the 107.7% cash flow payout ratio requires monitoring as it suggests distributions exceed operating cash flow in the trailing period. Recent dividend growth of 44.9% year-over-year and 36.5% over three years reflects the company's recovery from energy sector challenges and improved financial positioning.
The 2.0% dividend yield provides meaningful current income while maintaining growth potential, positioning Targa favorably among midstream operators. Long-term holders experience a 2.1% yield on cost based on 10-year purchase prices, indicating modest but positive dividend growth compounding. The 7.0% DPS growth over 10 years demonstrates commitment to distributions through volatile energy markets, though the pace trails shorter-term growth rates.
Key Catalysts:
- Natural gas production growth in Permian Basin driving volume increases
- LNG export terminal development creating takeaway capacity demand
- Fee-based contract structures providing revenue stability
- Permian Basin positioning in premier US production region
Risk Factors:
- Cash flow payout ratio above 100% suggests potential dividend sustainability concerns
- Commodity price volatility affecting producer activity levels
- Regulatory risks related to pipeline and processing infrastructure
- Capital intensity requirements competing with shareholder distributions
Stock #7: Amphenol Corporation (APH)
| Metric | Value |
|---|---|
| Dividend Payout Ratio (LTM) | 22.7% |
| Cash Flow Payout Ratio (LTM) | 25.9% |
| DPS Growth 1Y | 41.7% |
| DPS Growth 3Y | 21.5% |
| DPS Growth 10Y | 18.7% |
| Dividend Yield | 0.5% |
| Yield on Cost (10Y) | 1.0% |
Investment Thesis: Amphenol manufactures interconnect systems and components with a well-established dividend growth track record spanning multiple decades. The 22.7% payout ratio provides ample room for dividend increases while supporting reinvestment in R&D and strategic acquisitions that drive organic growth. The company delivered 41.7% DPS growth over the past year, representing acceleration from the 21.5% three-year and 18.7% ten-year growth rates.
Conservative cash flow management evidenced by the 25.9% cash flow payout ratio ensures distributions remain sustainable through business cycles while funding capital expenditures and bolt-on acquisitions. The 0.5% current yield reflects the company's growth orientation, though long-term holders benefit from 1.0% yield on cost based on decade-old purchase prices. Amphenol's diversification across automotive, industrial, military, and telecommunications end markets provides stability for consistent dividend progression.
Key Catalysts:
- Electric vehicle adoption driving demand for specialized connectors
- 5G infrastructure buildout requiring high-speed interconnect solutions
- Military modernization programs supporting defense electronics revenue
- Industrial automation trends increasing sensor and connectivity needs
Risk Factors:
- Low current yield may not satisfy income-focused investment objectives
- Cyclical exposure to automotive and industrial production volumes
- Currency translation effects from international manufacturing operations
- Technology transitions requiring continuous R&D investment
Stock #8: Gold Fields Limited (GFI)
| Metric | Value |
|---|---|
| Dividend Payout Ratio (LTM) | 33.7% |
| Cash Flow Payout Ratio (LTM) | 41.9% |
| DPS Growth 1Y | 34.3% |
| DPS Growth 3Y | 18.5% |
| DPS Growth 10Y | 35.3% |
| Dividend Yield | 2.3% |
| Yield on Cost (10Y) | 6.2% |
Investment Thesis: Gold Fields operates as a global gold mining company offering exposure to precious metals with attractive dividend characteristics. The 33.7% payout ratio balances shareholder returns with capital requirements for mine development and exploration activities. The company achieved 34.3% DPS growth over the past year while maintaining a 41.9% cash flow payout ratio that suggests sustainable distributions from operating activities.
The 2.3% dividend yield provides competitive current income among mining stocks, enhanced by the company's dividend growth trajectory. Long-term investors benefit significantly from 6.2% yield on cost based on 10-year holding periods, demonstrating substantial dividend growth compounding. The impressive 35.3% DPS growth over 10 years reflects gold price appreciation cycles and operational improvements across the company's mine portfolio in South Africa, Ghana, Australia, and Peru.
Key Catalysts:
- Gold price strength driven by inflation concerns and geopolitical uncertainty
- Mine life extensions through exploration success and resource expansion
- Cost reduction initiatives improving margins and cash generation
- Currency dynamics benefiting South African rand-denominated operations
Risk Factors:
- Gold price volatility directly impacting revenue and cash flow generation
- Operational risks including safety incidents, labor disputes, and production interruptions
- Regulatory and political challenges in emerging market mining jurisdictions
- Capital intensity requirements for maintaining and expanding production capacity
Stock #9: Lennar Corporation (LEN)
| Metric | Value |
|---|---|
| Dividend Payout Ratio (LTM) | 24.5% |
| Cash Flow Payout Ratio (LTM) | (93.3%) |
| DPS Growth 1Y | 32.9% |
| DPS Growth 3Y | 21.8% |
| DPS Growth 10Y | 32.0% |
| Dividend Yield | 2.1% |
| Yield on Cost (10Y) | 1.4% |
Investment Thesis: Lennar represents one of America's largest homebuilders with a developing dividend growth profile supported by housing market fundamentals. The 24.5% payout ratio provides conservative coverage while allowing the company to navigate housing market cycles and fund land acquisition and development. Recent dividend growth of 32.9% year-over-year and 21.8% over three years demonstrates management's confidence in sustainable profitability despite cyclical industry dynamics.
The negative 93.3% cash flow payout ratio reflects the timing nature of homebuilding cash flows, where land purchases and construction spending precede closings and cash collections. This metric requires context within the homebuilding business model rather than indicating distribution concerns. The 2.1% current yield offers meaningful income with growth potential, while the 32.0% DPS growth over 10 years showcases long-term dividend progression through multiple housing cycles.
Key Catalysts:
- Housing undersupply supporting demand despite elevated mortgage rates
- First-time homebuyer programs and incentives driving entry-level volume
- Build-to-rent strategy creating recurring revenue opportunities
- Geographic diversification across high-growth Sun Belt markets
Risk Factors:
- Negative cash flow payout ratio reflects timing mismatches in homebuilding model
- Interest rate sensitivity affecting mortgage affordability and buyer demand
- Cyclical exposure to housing market downturns and recessions
- Land inventory risks during market corrections
Stock #10: Taiwan Semiconductor Manufacturing Company Limited (TSM)
| Metric | Value |
|---|---|
| Dividend Payout Ratio (LTM) | 26.7% |
| Cash Flow Payout Ratio (LTM) | 43.8% |
| DPS Growth 1Y | 31.6% |
| DPS Growth 3Y | 15.6% |
| DPS Growth 10Y | 20.7% |
| Dividend Yield | 0.9% |
| Yield on Cost (10Y) | 1.3% |
Investment Thesis: Taiwan Semiconductor Manufacturing Company dominates the semiconductor foundry industry with consistent dividend growth backed by technological leadership. The 26.7% payout ratio reflects management's balanced approach between returning capital to shareholders and funding extensive capital expenditures required for next-generation chip manufacturing. The company achieved 31.6% DPS growth over the past year, accelerating from the 15.6% three-year and 20.7% ten-year growth rates.
The 43.8% cash flow payout ratio demonstrates sustainable distributions despite the capital-intensive nature of semiconductor manufacturing. While the 0.9% current yield appears modest, the combination of dividend growth and stock appreciation creates attractive total returns for long-term investors. The 1.3% yield on cost for decade-long holders illustrates steady dividend compounding. TSMC's monopolistic position in advanced node manufacturing provides pricing power and visibility supporting dividend reliability.
Key Catalysts:
- AI chip demand driving advanced node capacity utilization
- Apple and NVIDIA design wins securing long-term revenue visibility
- Geographic expansion with Arizona and Japan fab construction
- Technology leadership in 3nm and future 2nm process nodes
Risk Factors:
- Geopolitical tensions between China and Taiwan creating supply chain concerns
- Capital intensity requirements potentially constraining dividend growth
- Customer concentration risk with Apple representing significant revenue
- Competition from Samsung and Intel foundry ambitions
Stock #11: Gilead Sciences, Inc. (GILD)
| Metric | Value |
|---|---|
| Dividend Payout Ratio (LTM) | 109.1% |
| Cash Flow Payout Ratio (LTM) | 51.9% |
| DPS Growth 1Y | 31.3% |
| DPS Growth 3Y | 14.7% |
| DPS Growth 10Y | (4.3%) |
| Dividend Yield | 3.4% |
| Yield on Cost (10Y) | 4.7% |
Investment Thesis: Gilead Sciences offers an established biopharmaceutical dividend with attractive current yield despite recent growth challenges. The elevated 109.1% payout ratio exceeds earnings coverage, though the more sustainable 51.9% cash flow payout ratio suggests the dividend remains supported by actual cash generation rather than accounting profits. Recent dividend growth of 31.3% year-over-year and 14.7% over three years indicates management's commitment to distributions despite patent expiration headwinds.
Explore More Investment Opportunities

For investors seeking undervalued companies with high fundamental quality, our analytics team provides curated stock lists:
📌 50 Undervalued Stocks (Best overall value plays for 2025)
📌 50 Undervalued Dividend Stocks (For income-focused investors)
📌 50 Undervalued Growth Stocks (High-growth potential with strong fundamentals)
🔍 Check out these stocks on the Value Sense platform for free!
More Articles You Might Like
📖 10 Best GARP Stock Picks for 2025
📖 12 Best High Quality Low EV/EBIT Stocks - October-November 2025
📖 11 Best Undervalued Large Cap Moat Stocks for 2025