
Buyback Cash Coverage
Welcome to the Value Sense Blog, your resource for insights on the stock market! At Value Sense, we focus on intrinsic value tools and offer stock ideas with undervalued companies. Dive into our research products and learn more about our unique approach at valuesense.io.
Explore diverse stock ideas covering technology, healthcare, and commodities sectors. Our insights are crafted to help investors spot opportunities in undervalued growth stocks, enhancing potential returns. Visit us to see evaluations and in-depth market research.
What is Buyback Cash Coverage ratio?
Buyback Cash Coverage ratio compares the free cash flow to the amount spent on share buybacks, indicating the sustainability of the buyback program.
How do you interpret Buyback Cash Coverage ratio?
Buyback Cash Coverage ratio indicates whether the company’s buybacks are sustainable based on free cash flow. A high ratio suggests the company can continue buybacks without compromising its financial health.
How to Calculate Buyback Cash Coverage ratio?
The Buyback Cash Coverage Ratio can be calculated by dividing the company's available cash by the total amount of the planned buyback.
Buyback Cash Coverage Ratio=Available Cash/Total Buyback Amount
where
- Available Cash: Cash or cash equivalents the company holds.
- Total Buyback Amount: The total cost of the share repurchase plan.
Why is Buyback Cash Coverage ratio important?
This ratio is important because it shows the company’s financial strength and flexibility. Companies with a higher Buyback Cash Coverage Ratio can carry out buybacks without compromising other financial obligations, while those with lower ratios might need to borrow funds or reduce investments in other areas to complete their buybacks.
How does Buyback Cash Coverage ratio benefit investors?
Investors can use this ratio to assess the sustainability and impact of a company’s buyback programs. A high ratio indicates that the company can support share repurchases without negatively affecting its liquidity or operational investments, which could lead to enhanced shareholder value through reduced share count and improved earnings per share (EPS).
Using Buyback Cash Coverage ratio to Evaluate Stock Performance
Investors can evaluate a company's stock performance by looking at the Buyback Cash Coverage Ratio alongside stock price movements during buybacks. If buybacks are funded sustainably and lead to a reduction in outstanding shares, they often contribute positively to stock performance by increasing EPS.
FAQ about Buyback Cash Coverage ratio
What is a Good Buyback Cash Coverage ratio?
A ratio greater than 1 indicates that the company has more than enough cash to cover its buybacks, which is considered favorable. Lower ratios suggest potential financial strain or the need to fund buybacks through other means.
What Is the Difference Between Metric 1 and Metric 2?
Buyback Cash Coverage Ratio focuses specifically on whether a company has enough cash to cover buybacks. Free Cash Flow Yield measures how much cash a company generates relative to its market capitalization and is broader, covering overall financial health rather than focusing only on buybacks.
Is it bad to have a negative Buyback Cash Coverage ratio?
A negative ratio suggests that the company does not have the cash available to fund buybacks and may need to take on debt or forgo other investments to finance the program, which can be a red flag for investors.
What Causes Buyback Cash Coverage ratio to Increase?
Increases in available cash through higher earnings, lower capital expenditures, or selling assets can lead to a higher ratio. Reducing the total amount allocated for buybacks can also increase the ratio.
What are the Limitations of Buyback Cash Coverage ratio?
The ratio doesn’t account for future cash flow needs, debt obligations, or investment opportunities. A company may have high cash levels at present, but unexpected future needs could make buybacks less prudent.
When should I not use Buyback Cash Coverage ratio?
This metric may not be useful if the company does not plan on performing buybacks. Additionally, if a company operates in an industry where capital reinvestment is critical for growth, focusing on buybacks could mislead investors into undervaluing important long-term investments.
How does Buyback Cash Coverage ratio compare across industries?
The ratio varies widely across industries depending on capital intensity. For example, technology companies with strong cash flow might have higher ratios, while industries like utilities, which require heavy capital investment, may have lower ratios but still maintain financial stability.
Explore More Investment Opportunities
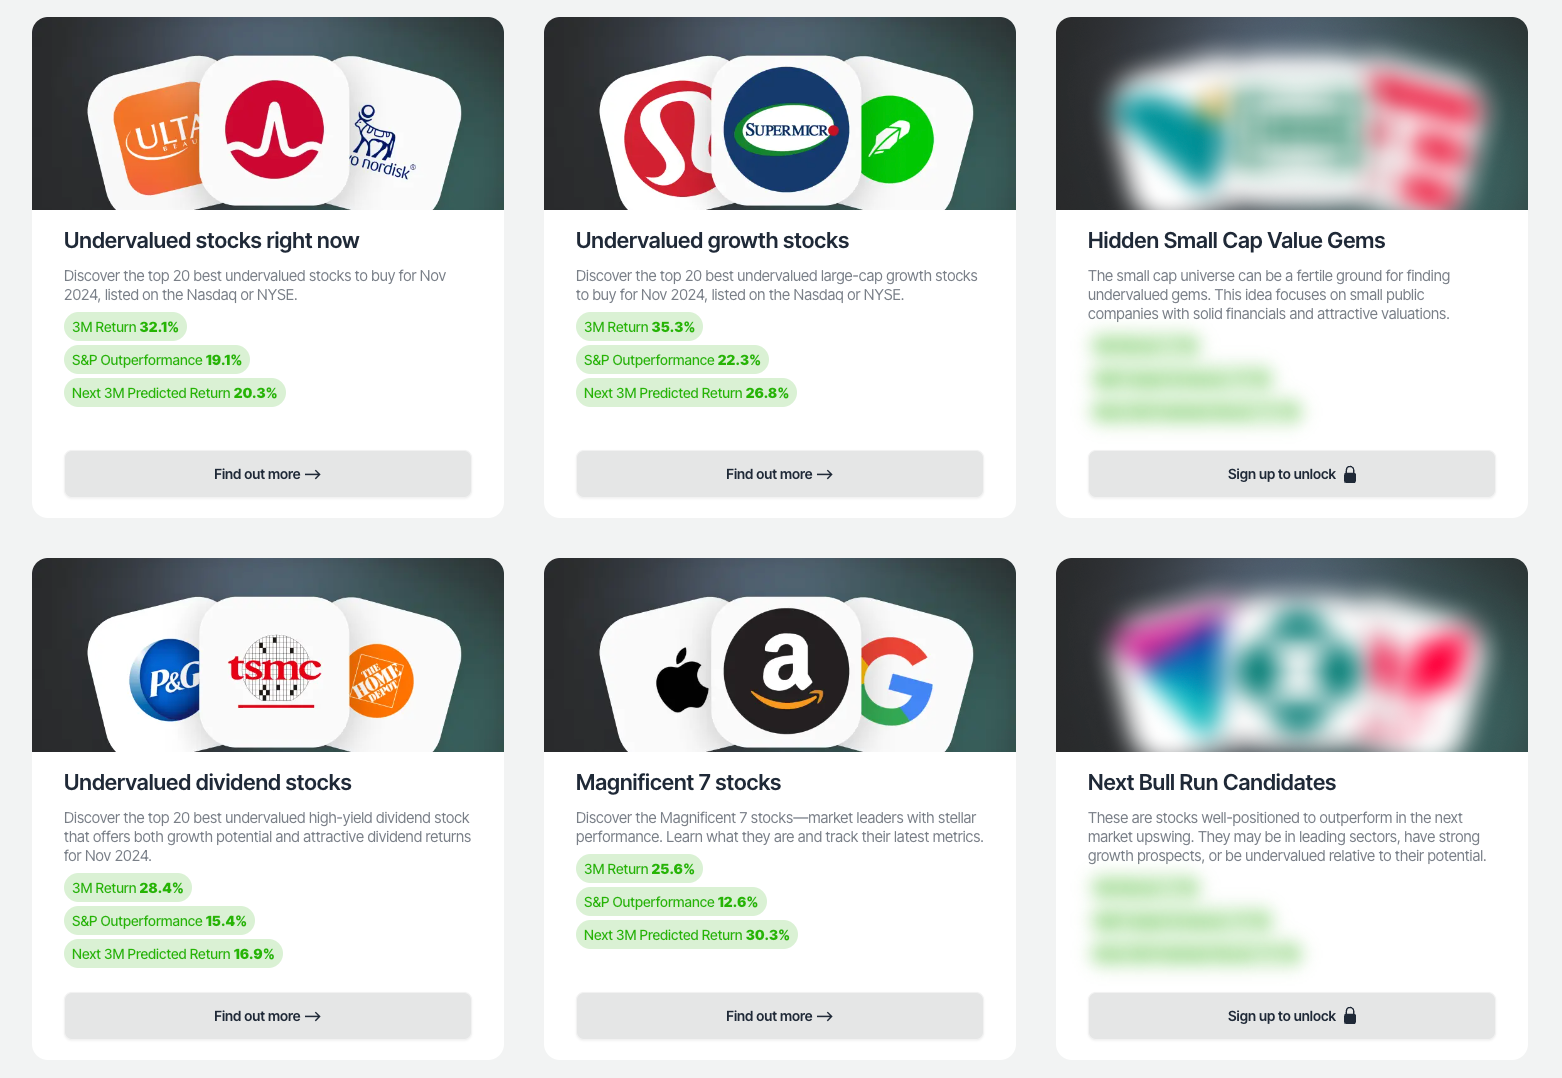
For investors seeking undervalued companies with high fundamental quality, our analytics team provides curated stock lists:
📌 50 Undervalued Stocks (Best overall value plays for 2025)
📌 50 Undervalued Dividend Stocks (For income-focused investors)
📌 50 Undervalued Growth Stocks (High-growth potential with strong fundamentals)
🔍 Check out these stocks on the Value Sense platform for free!