
CAPEX To Depreciation
Welcome to the Value Sense Blog, your resource for insights on the stock market! At Value Sense, we focus on intrinsic value tools and offer stock ideas with undervalued companies. Dive into our research products and learn more about our unique approach at valuesense.io.
Explore diverse stock ideas covering technology, healthcare, and commodities sectors. Our insights are crafted to help investors spot opportunities in undervalued growth stocks, enhancing potential returns. Visit us to see evaluations and in-depth market research.
What is Capex to Depreciation?
Capex to Depreciation compares capital expenditures to depreciation expense, indicating whether a company is investing enough to maintain or grow its asset base.
How do you interpret Capex to Depreciation?
Capex to Depreciation compares capital expenditures to depreciation expense, indicating whether a company is investing enough to maintain or grow its asset base.
How to Calculate Capex to Depreciation?
To calculate Capex to Depreciation, you divide the company's total capital expenditures by its depreciation expense over a certain period.
Capex to Depreciation = Capex / Depreciation Expense
where - Capex refers to the money spent by the company on acquiring, upgrading, or maintaining physical assets. - Depreciation Expense is the reduction in the value of fixed assets over time due to wear and tear or obsolescence.
Why is Capex to Depreciation important?
This metric is crucial for understanding a company's reinvestment in its long-term assets. It indicates whether the firm is adequately maintaining and expanding its infrastructure or allowing its asset base to decline. It is particularly important for capital-intensive industries such as manufacturing, telecommunications, and utilities.
How does Capex to Depreciation benefit investors?
Investors use this ratio to assess a company’s growth prospects. A higher ratio indicates that a company is expanding its operations and investing in future growth, which may lead to higher future earnings. Conversely, a lower ratio might raise concerns about the company’s ability to sustain growth or its long-term operational efficiency.
Using Capex to Depreciation to Evaluate Stock Performance
When a company consistently has a high Capex to Depreciation ratio, it signals potential for future growth, which could positively impact stock performance. However, excessive Capex without corresponding revenue growth may lead to reduced free cash flow, potentially limiting dividends and lowering stock performance.
FAQ about Capex to Depreciation
What is a Good Capex to Depreciation?
A Capex to Depreciation ratio of around 1 to 2 is generally considered good, depending on the industry. Ratios significantly above 2 may indicate aggressive expansion, while those below 1 could suggest underinvestment in assets.
What Is the Difference Between Metric 1 and Metric 2?
While Capex to Depreciation focuses on the investment in and maintenance of fixed assets, Fixed Asset Turnover measures how efficiently a company utilizes its fixed assets to generate revenue.
Is it bad to have a negative Capex to Depreciation?
A negative ratio is not possible, as both Capex and depreciation are positive values. However, a very low ratio close to zero could indicate that the company is not investing enough in its assets, which could be problematic in capital-intensive industries.
What Causes Capex to Depreciation to Increase?
An increase in the ratio could result from higher capital expenditures due to expansion projects, upgrades to current facilities, or the acquisition of new assets.
What are the Limitations of Capex to Depreciation?
Industry Sensitivity: The ideal ratio varies significantly across industries. What is considered a good ratio in one industry may be too low or too high in another. Short-term Distortion: The ratio can fluctuate significantly in the short term due to timing differences in capital spending.
When should I not use Capex to Depreciation?
The Capex to Depreciation ratio may not be meaningful for companies that do not rely heavily on physical assets, such as technology or service-based companies, where intangible assets and R&D play a bigger role.
How does Capex to Depreciation compare across industries?
Industries with high levels of fixed assets, such as utilities or manufacturing, typically have higher Capex to Depreciation ratios than industries like software or services, which are less capital-intensive.
Explore More Investment Opportunities
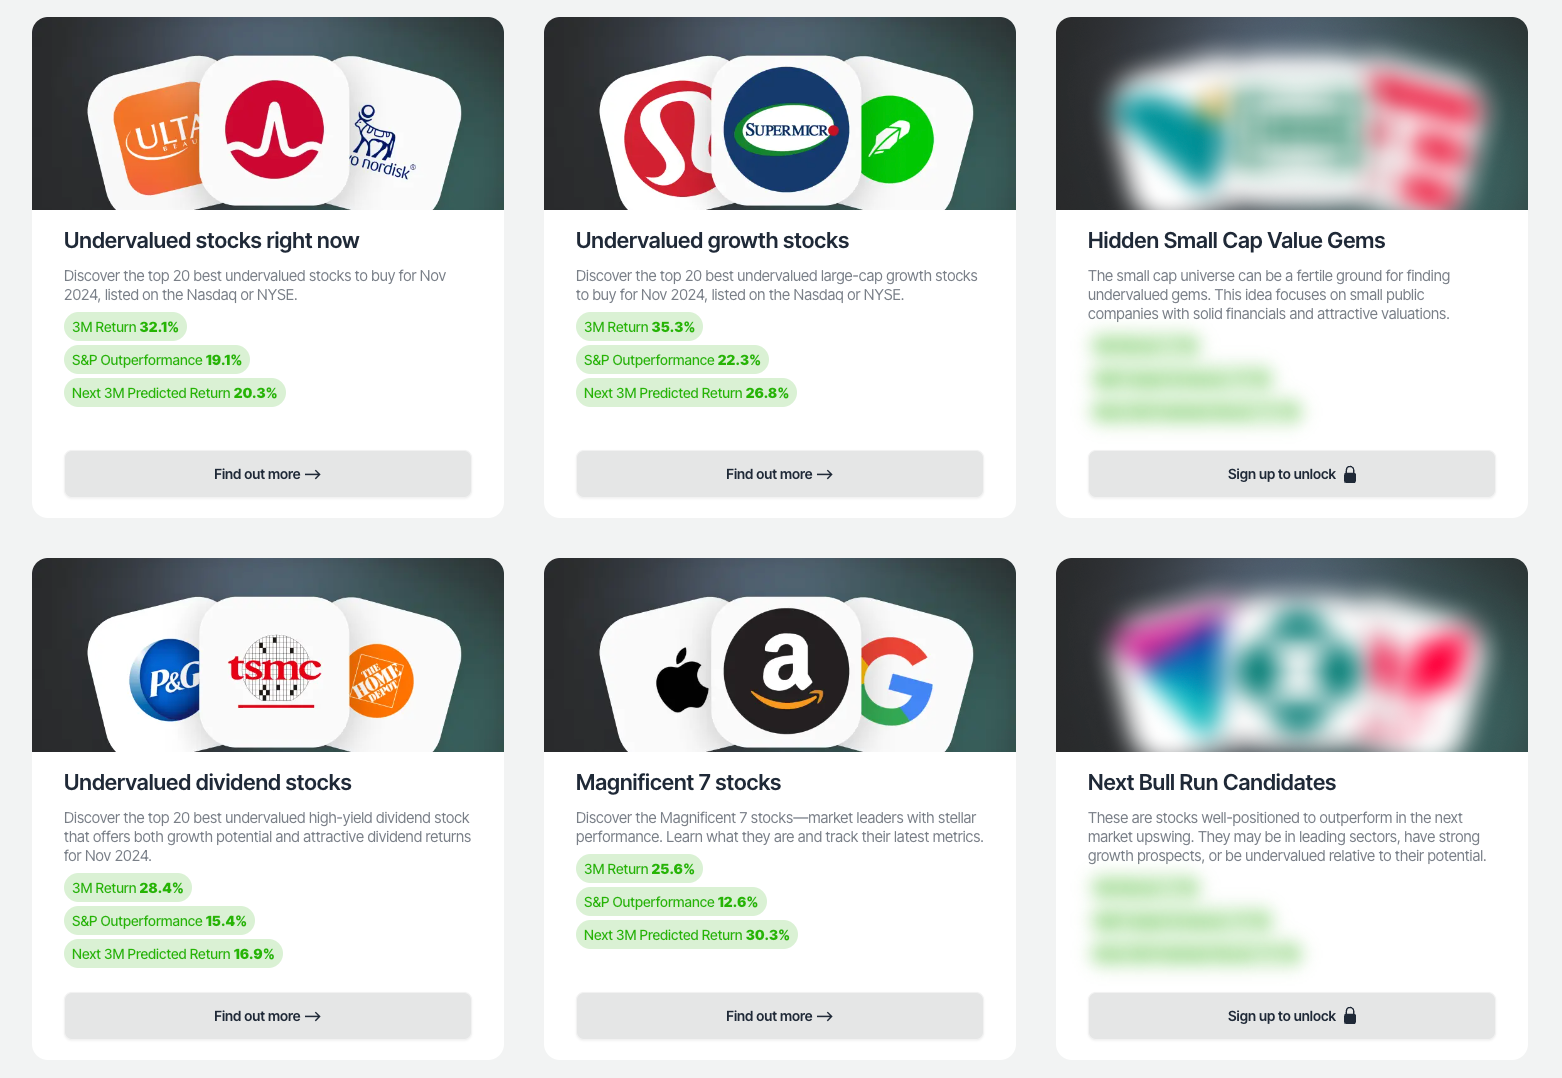
For investors seeking undervalued companies with high fundamental quality, our analytics team provides curated stock lists:
📌 50 Undervalued Stocks (Best overall value plays for 2025)
📌 50 Undervalued Dividend Stocks (For income-focused investors)
📌 50 Undervalued Growth Stocks (High-growth potential with strong fundamentals)
🔍 Check out these stocks on the Value Sense platform for free!