ValueSense features - Dashboards
Dashboards in ValueSense allow users to create comprehensive analytical views by combining multiple saved charts into a single, cohesive presentation. This feature enables users to build narratives around their data analysis and share insights with the community.
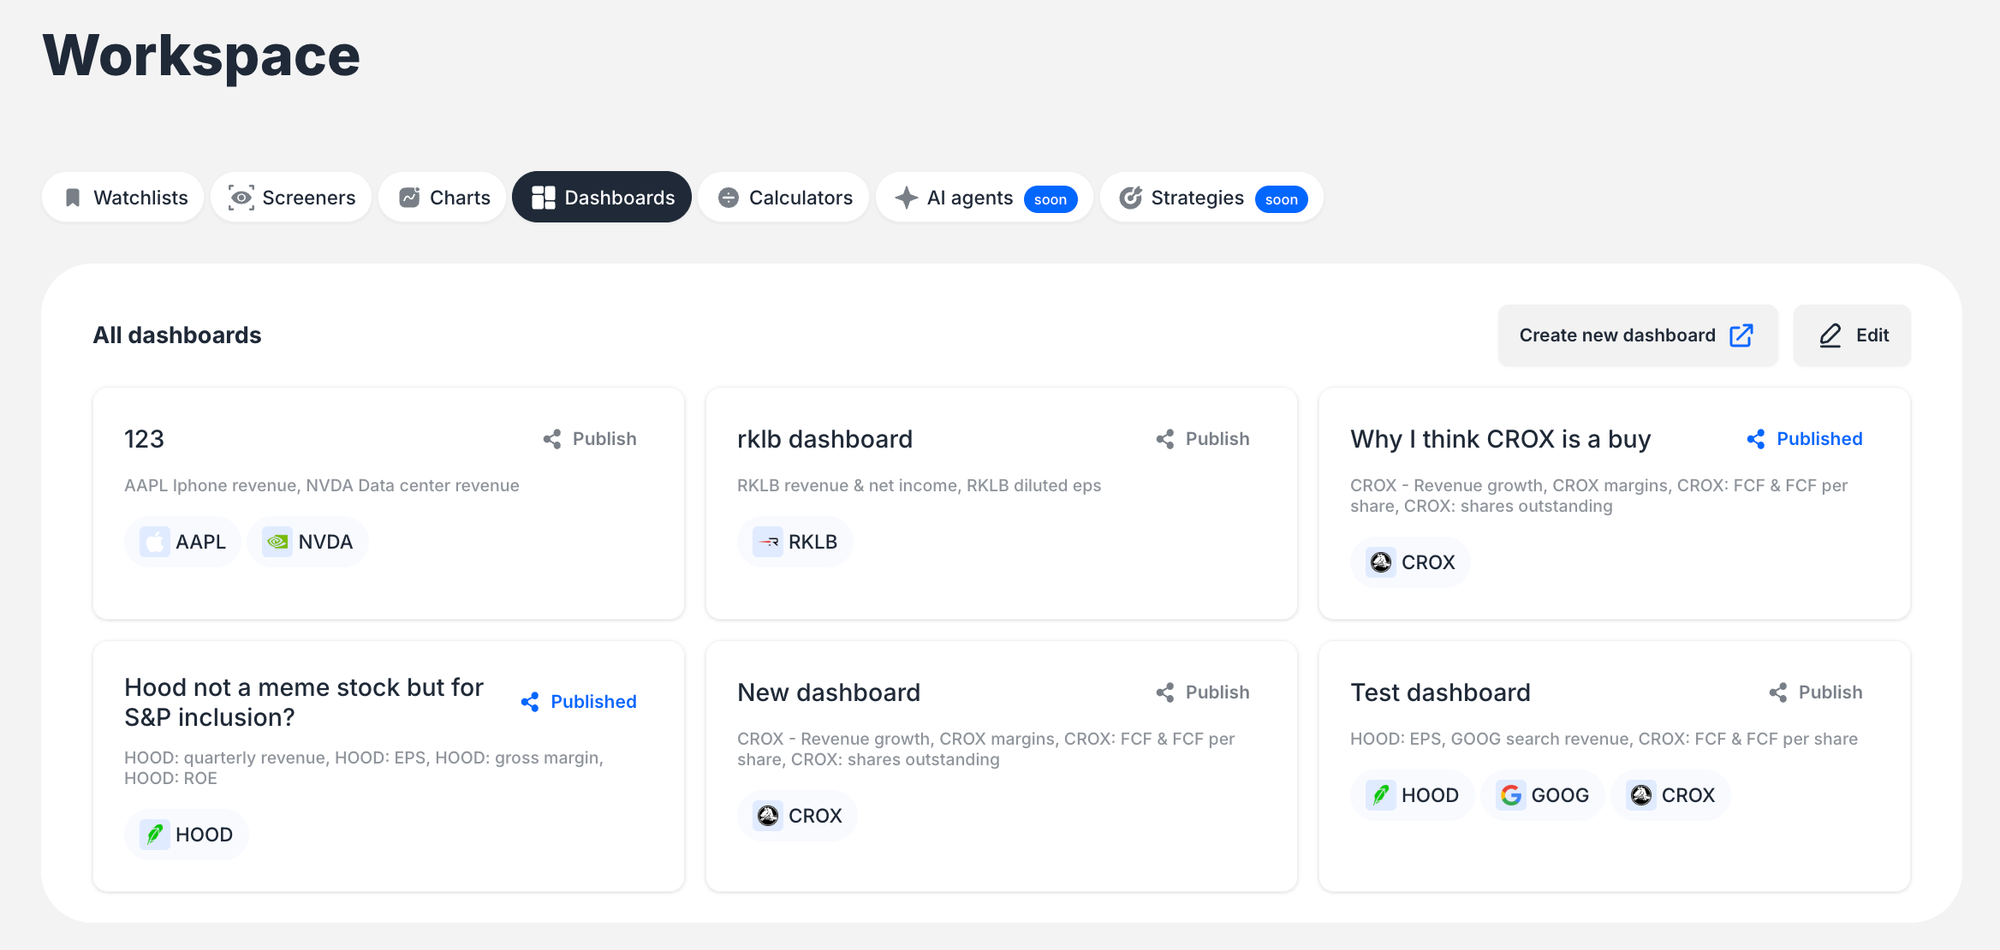
Accessing Dashboards
To access the Dashboards feature:
- Navigate to your Workspace
- Click on the Dashboards tab in the secondary navigation menu
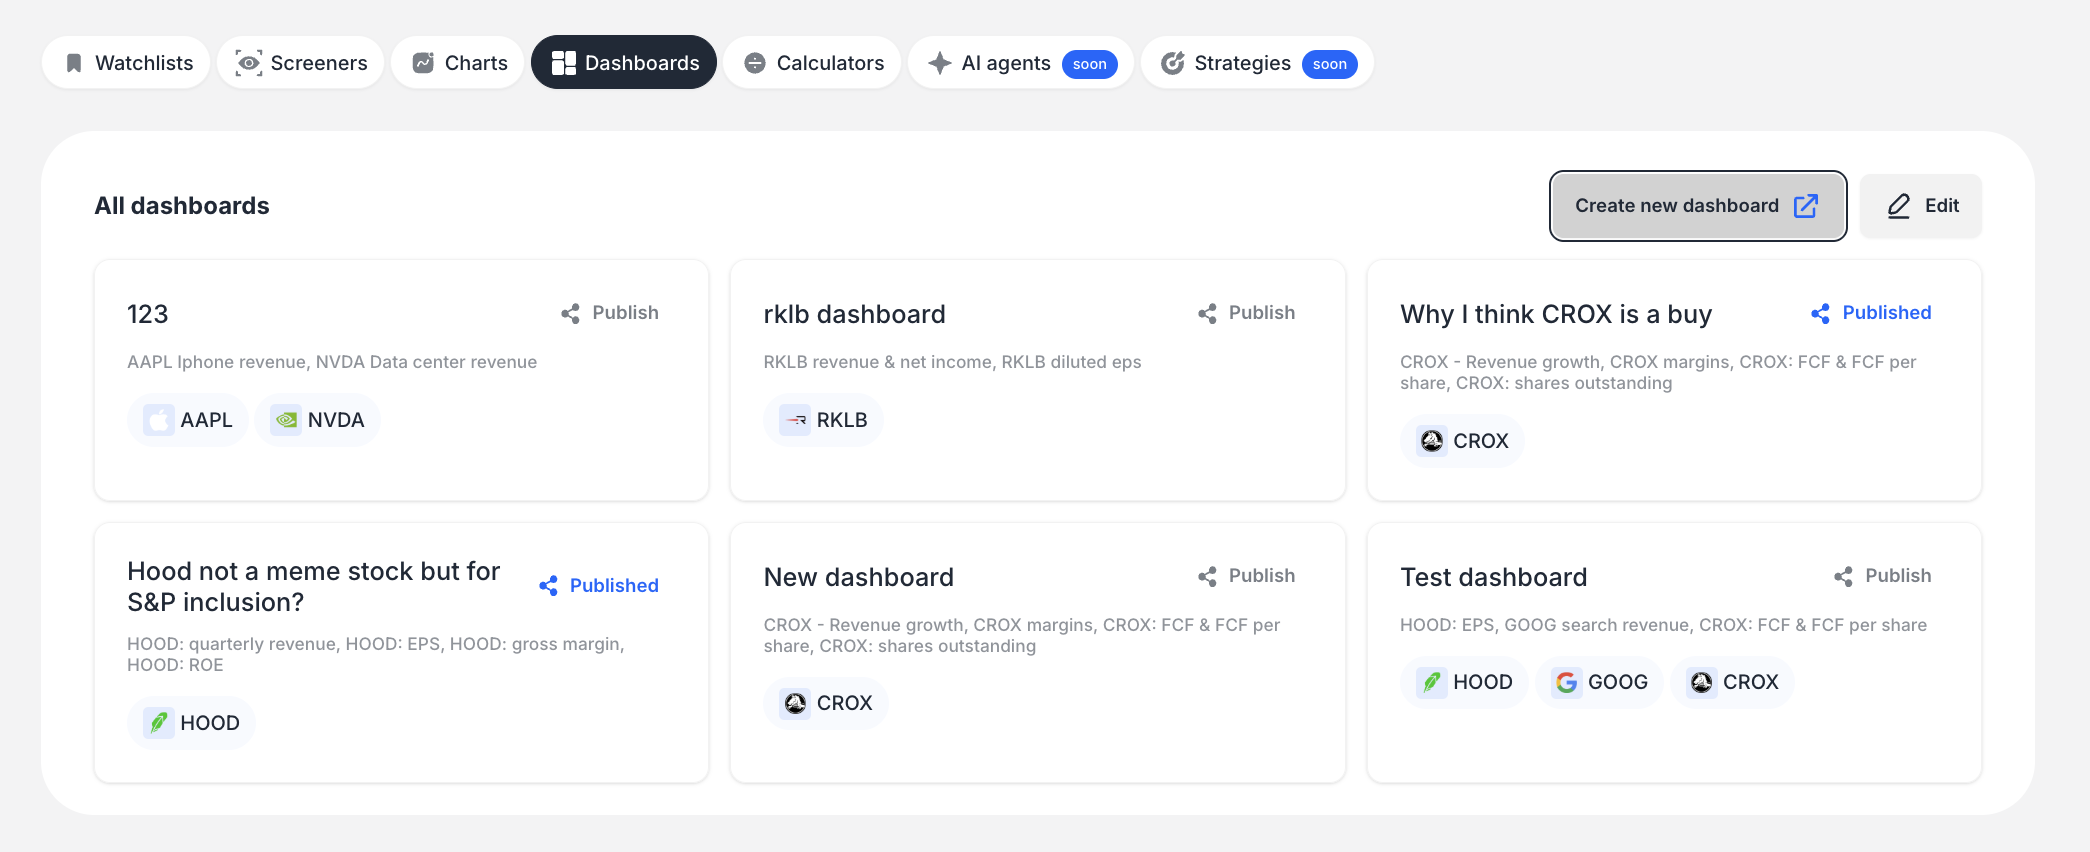
- You'll see the "All dashboards" view displaying all your saved dashboards as individual cards

Creating a Dashboard
Dashboards are created by aggregating pre-existing, saved charts. You cannot create new dashboards directly within the chart creation workflow.
Step-by-Step Creation Process:
Initiate Creation: From the "All dashboards" view, click the "Create new dashboard" button
Open Modal: A modal window titled "Add charts to dashboard" will appear
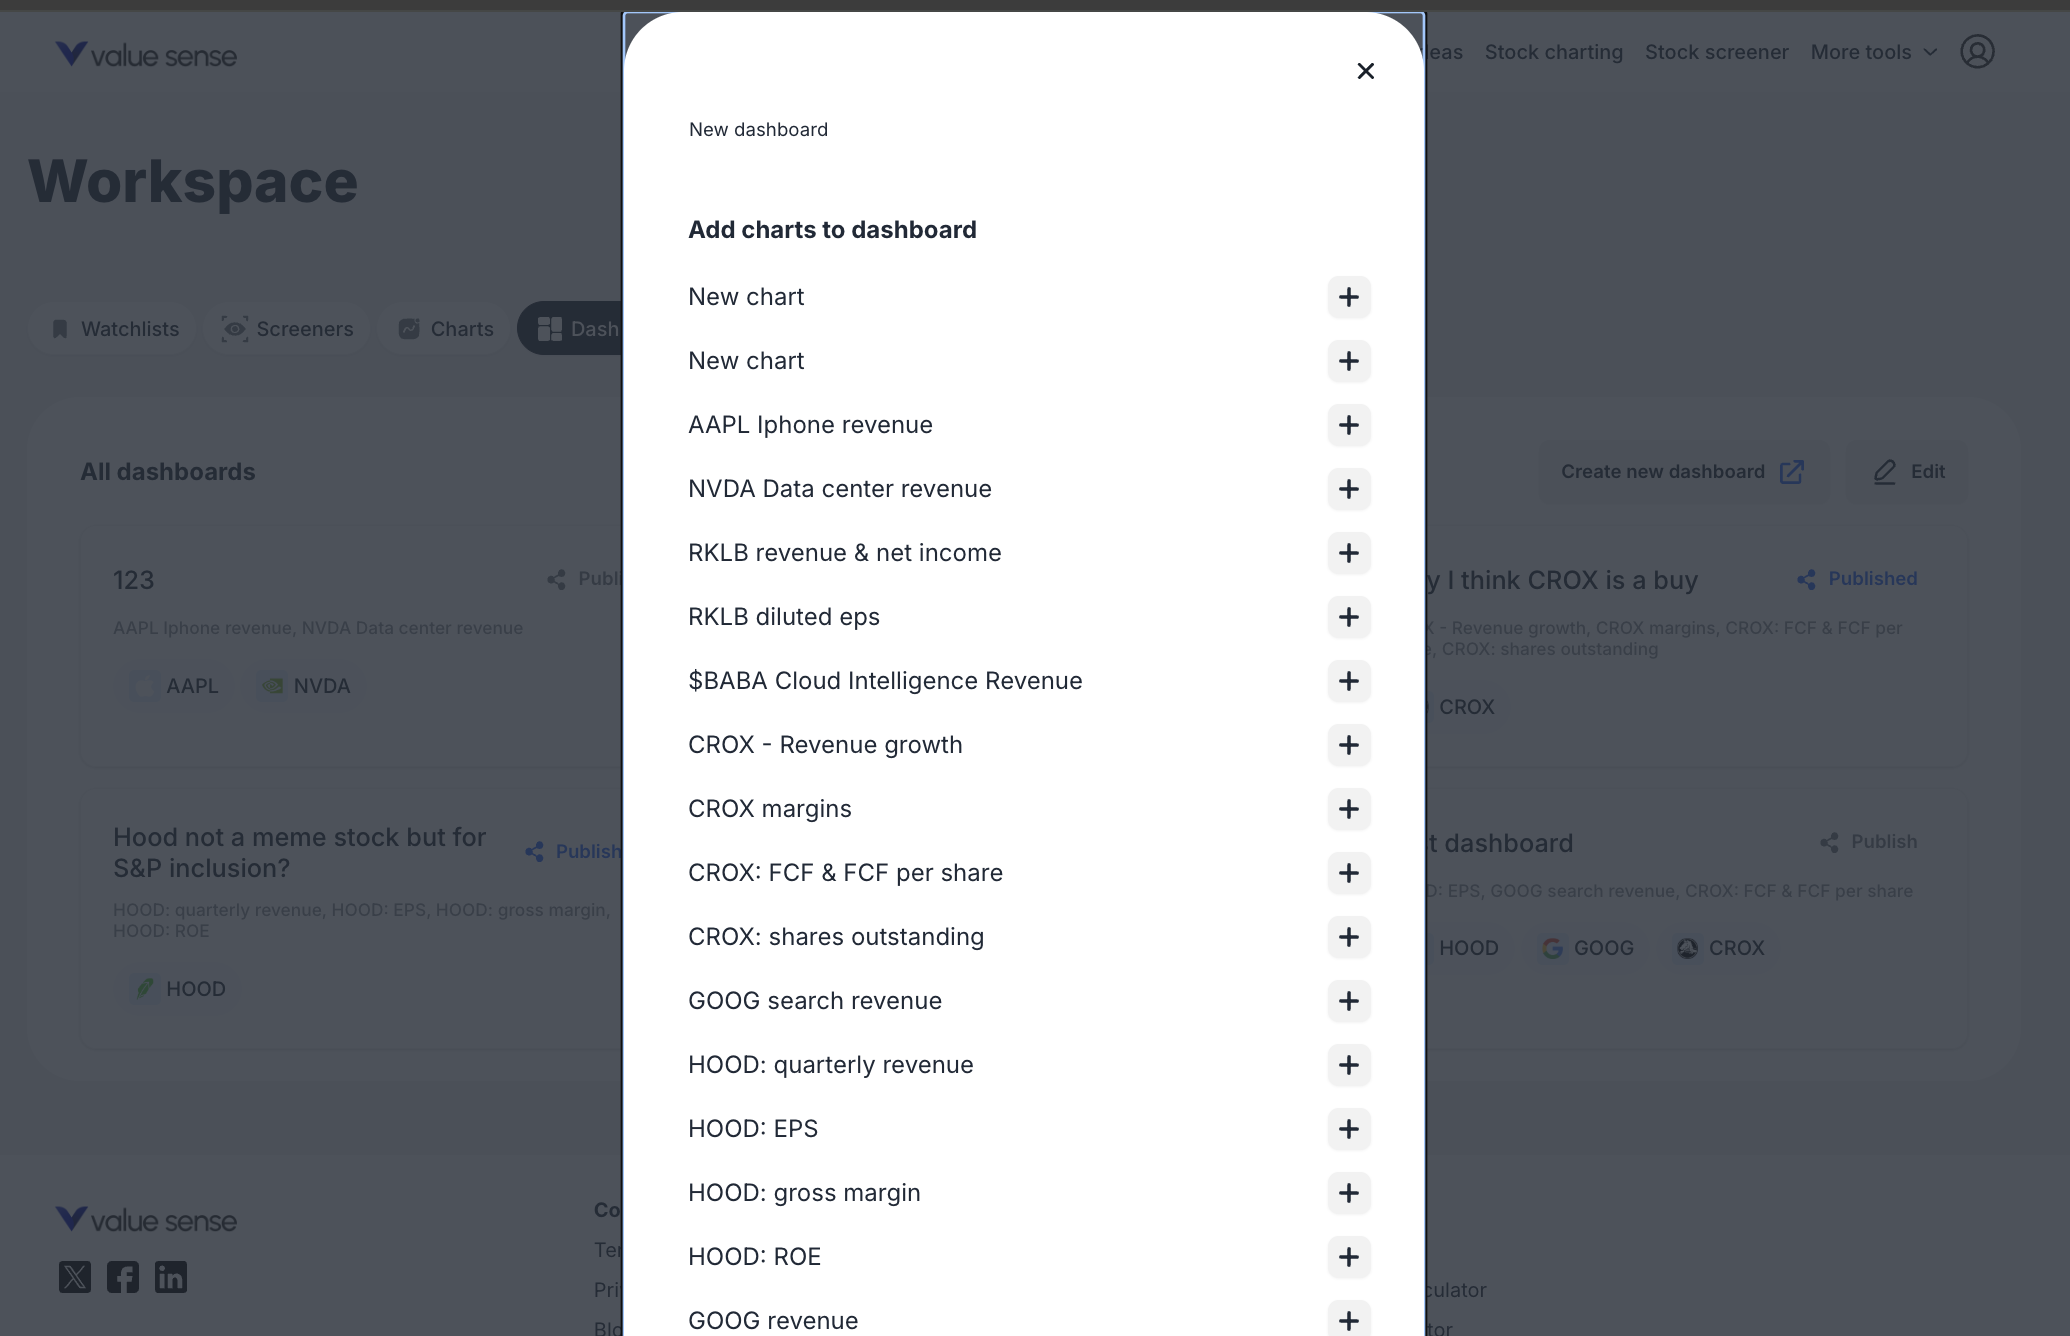
Name the Dashboard: Enter a name for your new dashboard in the top text field (placeholder: "New dashboard")
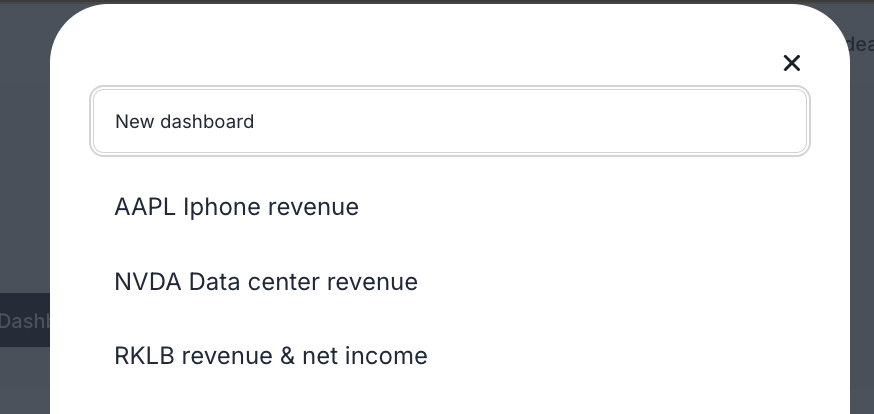
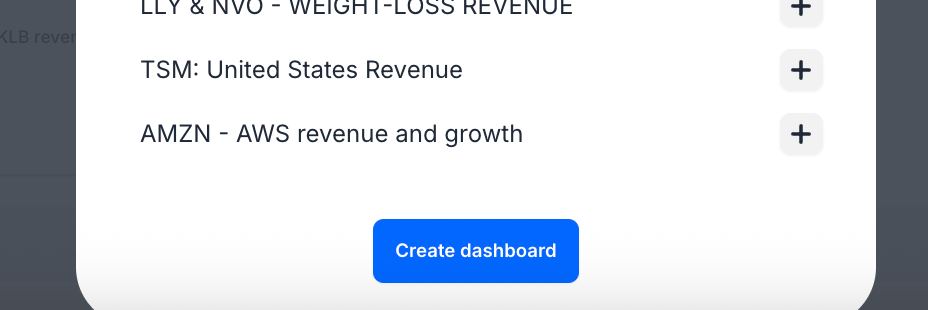
Select Charts:
- Scroll through the list of your saved charts
- Click the plus icon (+) next to each chart you want to include
- Multiple charts can be selected for a single dashboard
Finalize Creation: Click the blue "Create dashboard" button at the bottom of the modal
Confirmation: A green notification "Dashboard saved to workspace" will appear, and the new dashboard card becomes immediately visible in your dashboard list
Adding Comments to Dashboards
Users can add commentary or notes directly within a dashboard. Comments are associated with individual charts, not the dashboard as a whole.
Commenting Process:
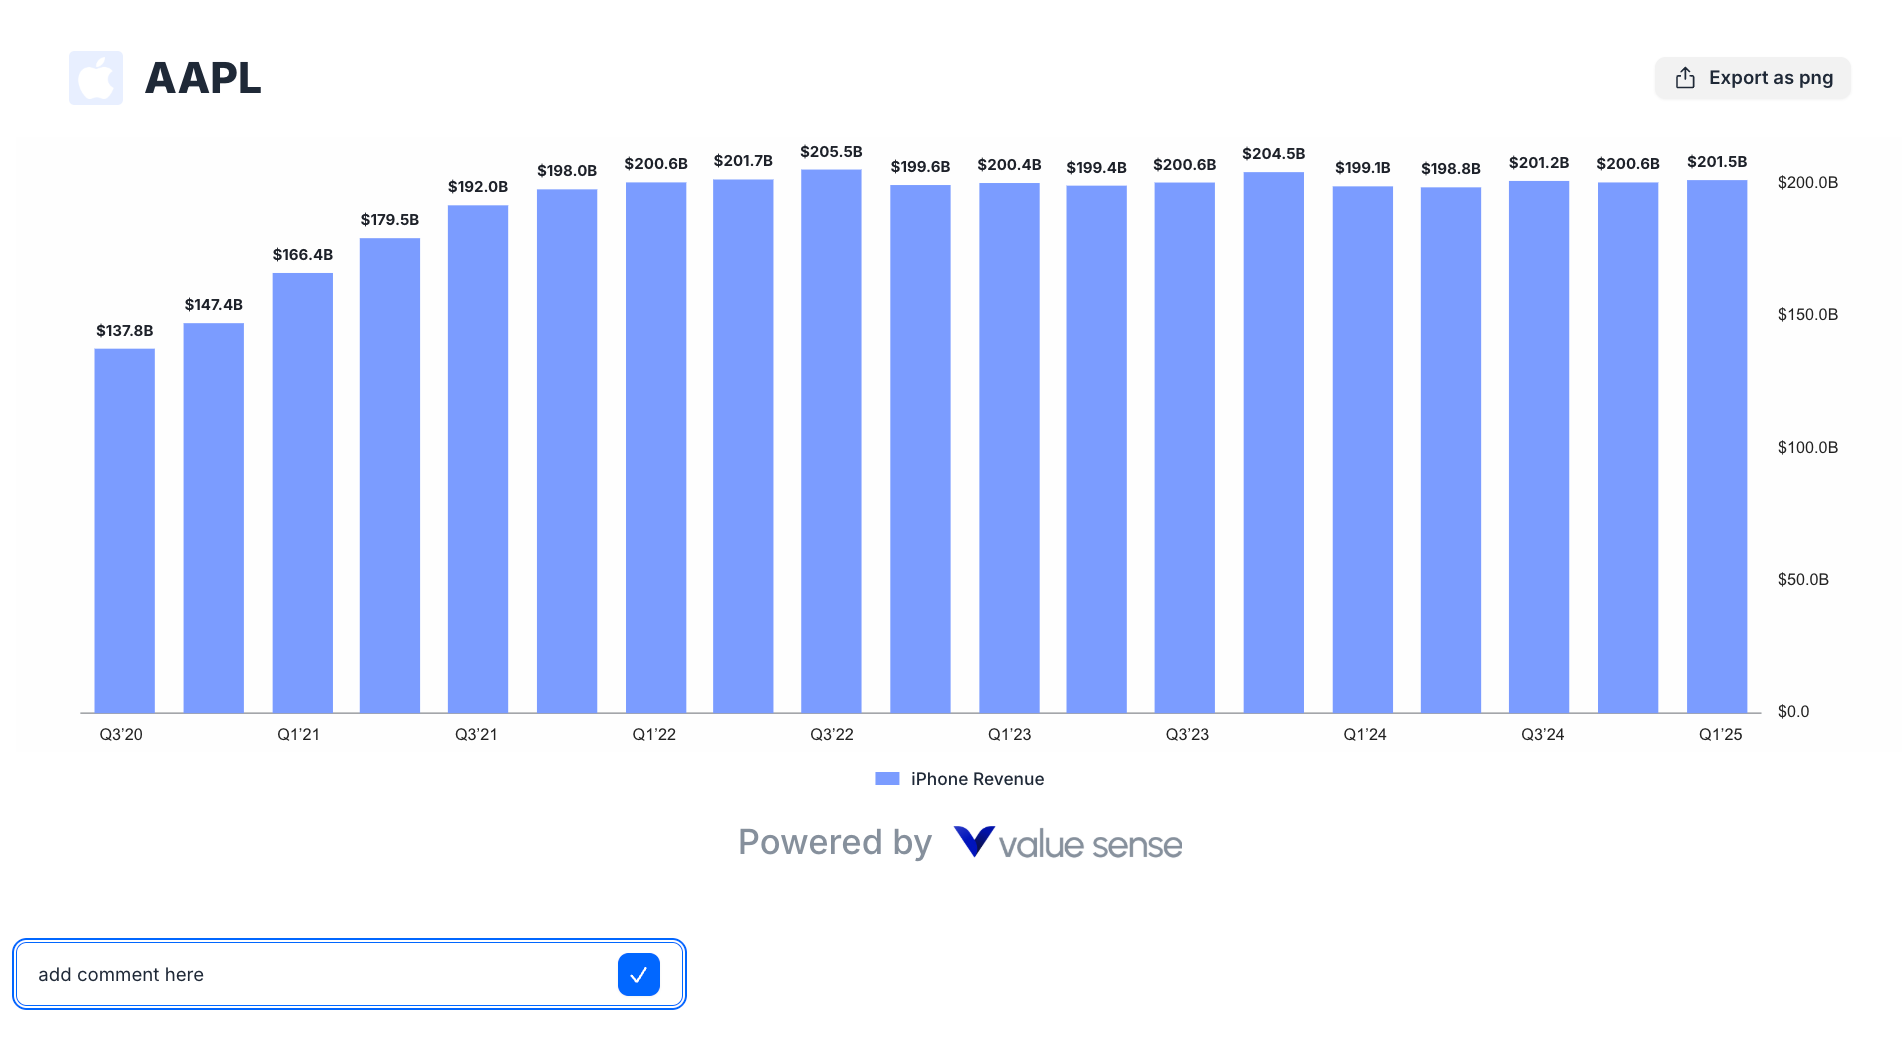
- Open Dashboard: Click on a dashboard card to open its detailed view
- Locate Comment Box: Scroll to the chart you wish to comment on. Below each chart, there's an "Add comment" text input box
- Write and Submit: Type your comment and click the blue checkmark button to save
- View Comment: The saved comment appears as plain text below the comment box and above the subsequent chart
Publishing Dashboards to Public Space
Users can share their dashboards with the ValueSense community by publishing them to the "Public space."
Publishing Workflow:
- Locate Dashboard: In your "All dashboards" view, find the card for the dashboard you want to publish
- Initiate Publish: Click the "Publish" link/icon on the dashboard card
- Confirm in Modal: A "Publish to Community" modal appears with the dashboard's current title (editable for the public-facing version)
- Publish: Click the "Save" button to publish the dashboard
- View in Public Space: Published dashboards become visible to other users in the Public space > Dashboards section

Dashboard Interface and Features
Dashboard Cards
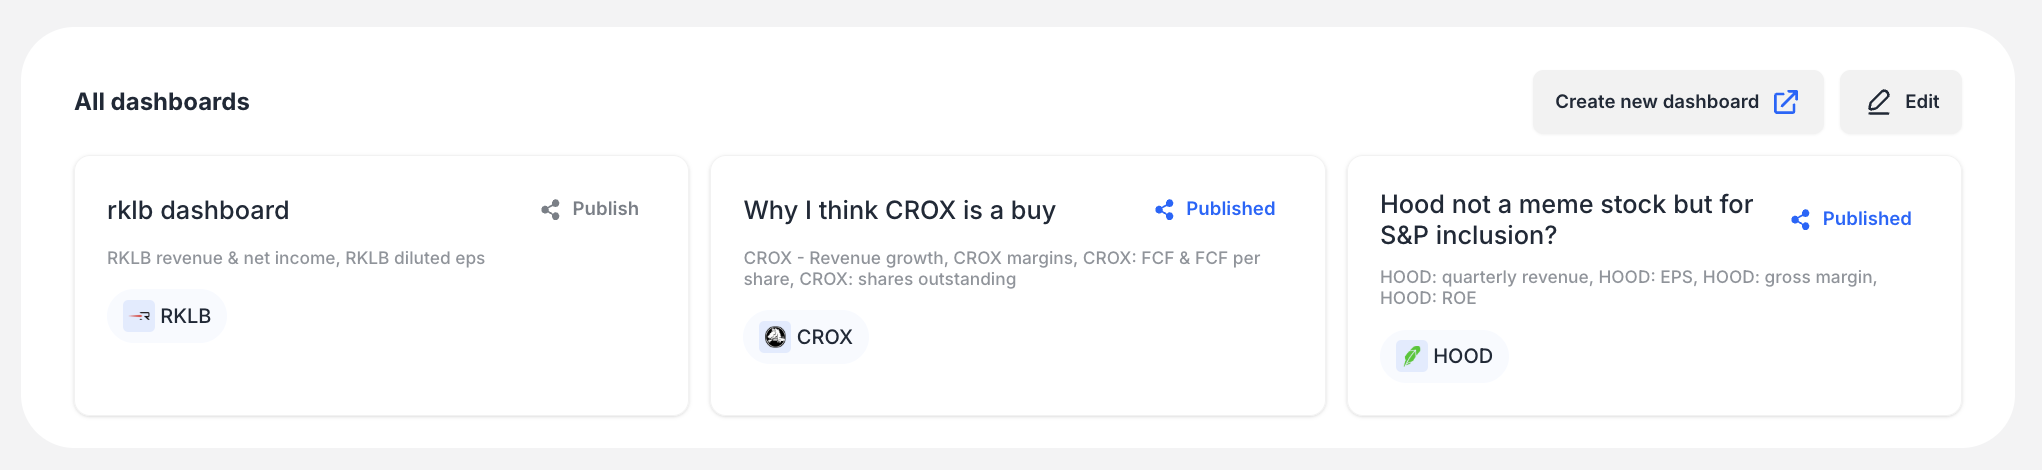
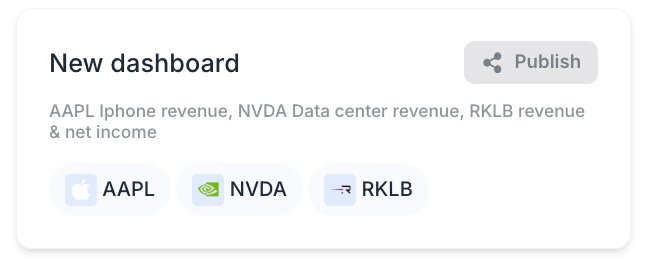
Each dashboard is represented by a card containing:
- Title: The name of the dashboard
- Description: Auto-generated list of included charts or metrics
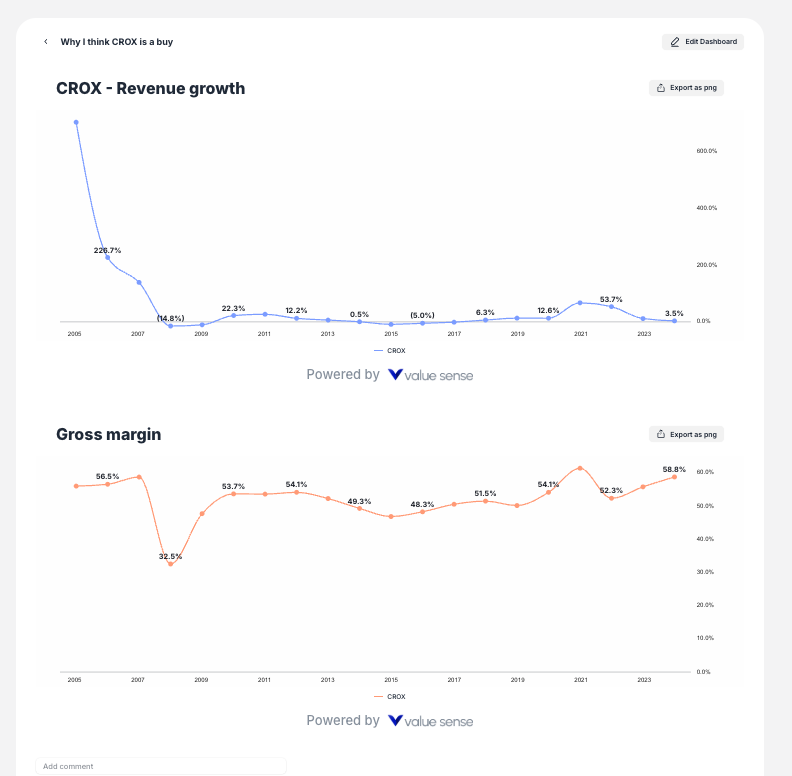
- Tickers: Company logos/tickers featured in the charts (e.g., HOOD, GOOG, CROX)
- Publish Status: "Publish" link or "Published" label if already shared
Individual Dashboard View
When opened, a dashboard presents:
- Header: Back button with the dashboard's name
- Actions: "Edit Dashboard" and "Export as png" buttons
- Layout: Charts displayed as large, distinct blocks in vertical scroll format
- Loading State: "Crunching data... Almost there!" message while charts generate
Additional Features
- Edit Dashboard: Modify dashboard contents and chart order after creation
- Export Chart: Individual charts can be exported as PNG images
- Private vs. Public: Clear separation between private Workspace and Public space
- Modular Workflow: Separation of chart creation from dashboard assembly
Key Capabilities
Compositional Nature
Dashboards are composed of existing, saved charts, with core value in aggregating and arranging previously created analyses.
Contextual Comments
Per-chart commenting allows users to build narratives around data, explaining the significance of each visual in the dashboard context.
Community Sharing
The publish feature transforms personal analysis into community content, fostering collaboration and idea sharing.
Granular Export
Users can export individual charts as images rather than entire dashboards, useful for reports or external platforms.
Best Practices
- Plan Your Story: Before creating a dashboard, consider the narrative you want to tell with your selected charts
- Use Descriptive Names: Give your dashboards clear, descriptive titles for easy identification
- Add Context: Use comments to explain insights, trends, or important observations for each chart
- Community Consideration: When publishing, ensure your dashboard provides value to the broader ValueSense community
- Regular Updates: Keep your dashboards current by updating the underlying charts as new data becomes available
This comprehensive dashboard feature enables ValueSense users to create powerful analytical presentations that combine multiple data visualizations into cohesive, shareable insights.