ValueSense Intrinsic Value Tools - DCF Value Calculator
The DCF Value Calculator is a comprehensive tool that determines the intrinsic value of a stock using a Discounted Cash Flow (DCF) model. It automates the complex calculations involved in projecting a company's future cash flows and discounting them back to present value, while providing full transparency and customization options for advanced users.
Accessing the DCF Value Calculator
From the Value Investing Tools Hub
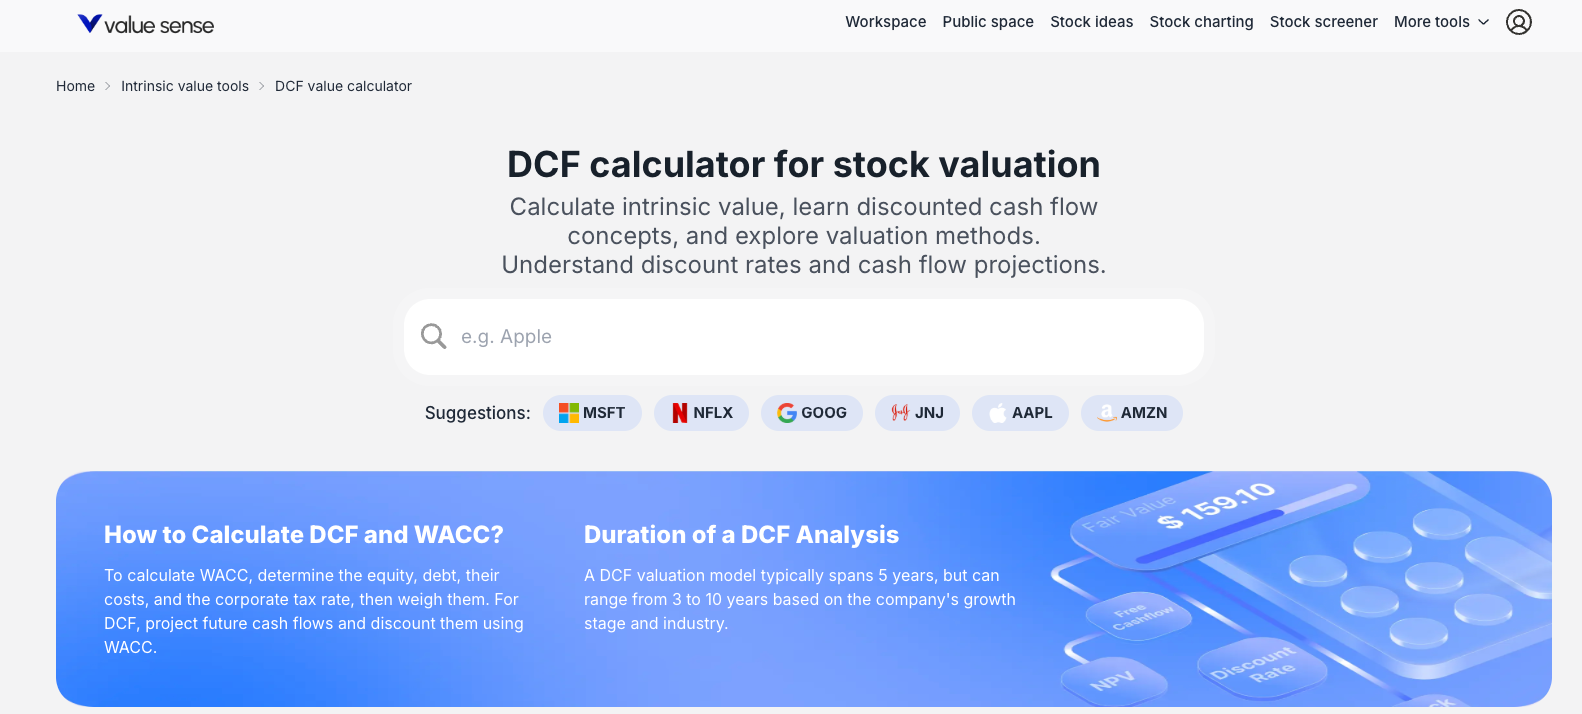
- Navigate to the main "Intrinsic Value tools" page
- Locate the "DCF value calculator" card in the tools grid
- Click on the card to access the calculator's landing page
- Search for a company (e.g., "Apple") or select from suggested tickers (MSFT, NFLX, AAPL)
Free DCF Calculator - Discounted Cash Flow Valuation
Free discounted cash flow (DCF) analysis tool for stock valuation based on FCF, terminal value, present value, WACC and enterprise value.

What the DCF Value Calculator Does
Core Purpose
The calculator determines the intrinsic value of a stock by:
- Projecting Future Cash Flows: Estimates a company's future free cash flows
- Discounting to Present Value: Applies appropriate discount rates to future cash flows
- Comparing to Market Price: Provides immediate over/undervaluation assessment
- Educational Resource: Helps users learn discounted cash flow concepts and valuation methods
Key Benefits
- Automated Calculations: Eliminates manual DCF modeling complexity
- Multiple Methodologies: Supports different DCF approaches
- Transparency: Shows every step of the valuation process
- Customization: Allows users to input their own assumptions
Multiple DCF Models Available
Free Cash Flow to Firm (FCFF) Model
- Default model focusing on cash flows available to all investors
- Enterprise Value approach before debt and equity considerations
- Most comprehensive for complete company valuation
Free Cash Flow to Equity (FCFE) Model
- Cash flows available specifically to equity holders
- Direct equity valuation approach
- Accounts for debt service and financing effects
Net Income Model
- Based on earnings rather than cash flows
- Useful for companies with predictable earnings patterns
- Alternative perspective on company value
Input Data and Customization
Pre-populated Data
- Automatic Population: Financial data and projections loaded automatically
- Analyst Estimates: Uses current analyst forecasts and historical data
- Key Assumptions: Discount rate and long-term growth rate prominently displayed
Customizable Parameters
- Revenue Growth: Modify year-by-year growth projections
- Operating Margins: Adjust EBIT percentage margins
- Tax Rates: Update effective tax rate assumptions
- Capital Expenditures: Modify capex as percentage of revenue
- Discount Rate (WACC): Critical valuation driver
- Long-Term Growth Rate: Terminal value assumption
Key Model Drivers
- Discount Rate: Default 8.6% (based on company-specific WACC)
- Long-Term Growth Rate: Default 4.0% (terminal growth assumption)
- Forecast Period: Typically 5-10 years of explicit projections
Comprehensive Results and Outputs
Top-Level Summary
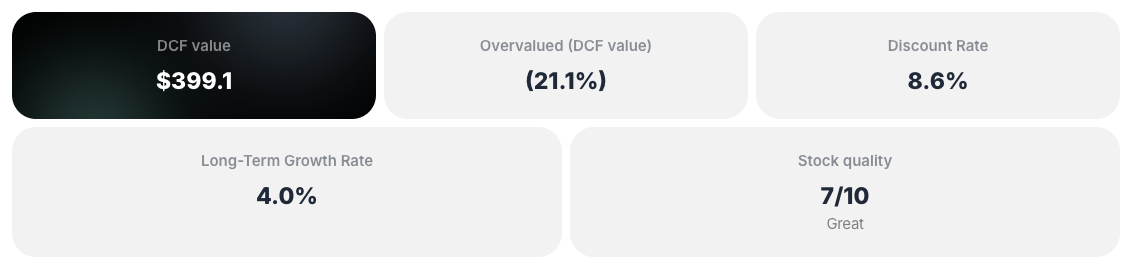
- Final DCF Value: Clear intrinsic value per share (e.g., "$399.1")
- Valuation Status: Over/undervaluation percentage (e.g., "MSFT is 3.7% overvalued")
- Key Assumptions: Discount rate and long-term growth rate displayed prominently
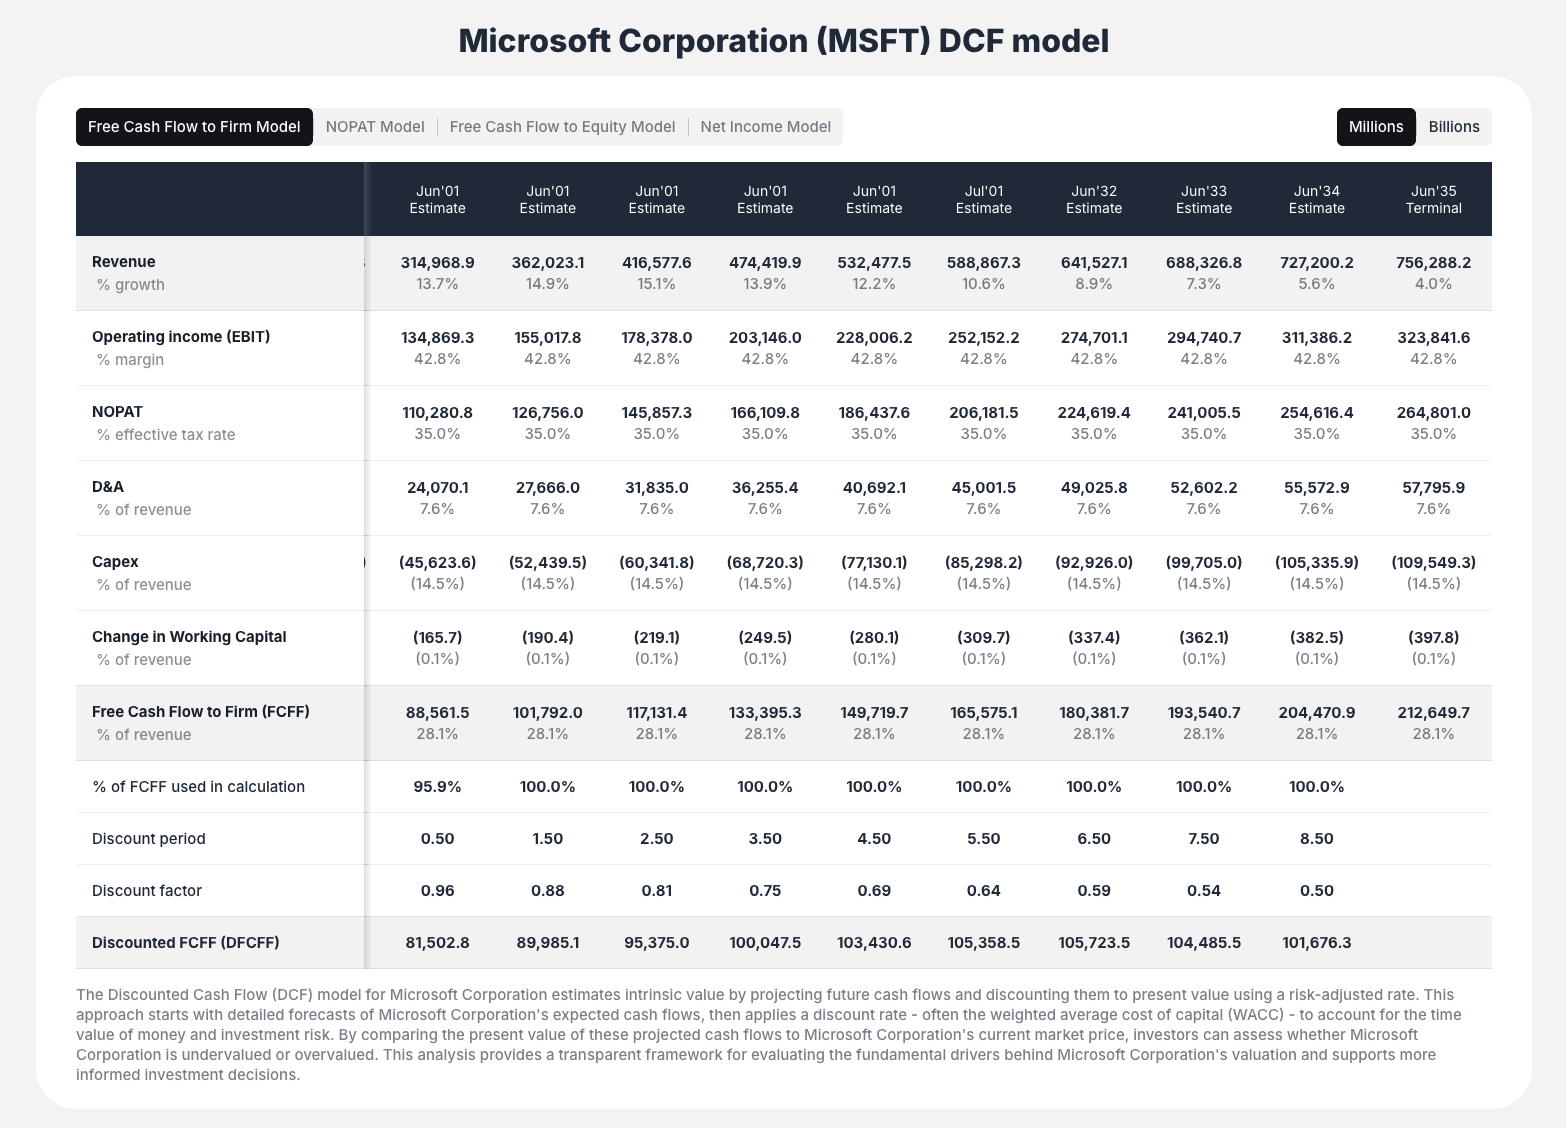
Detailed DCF Model Table
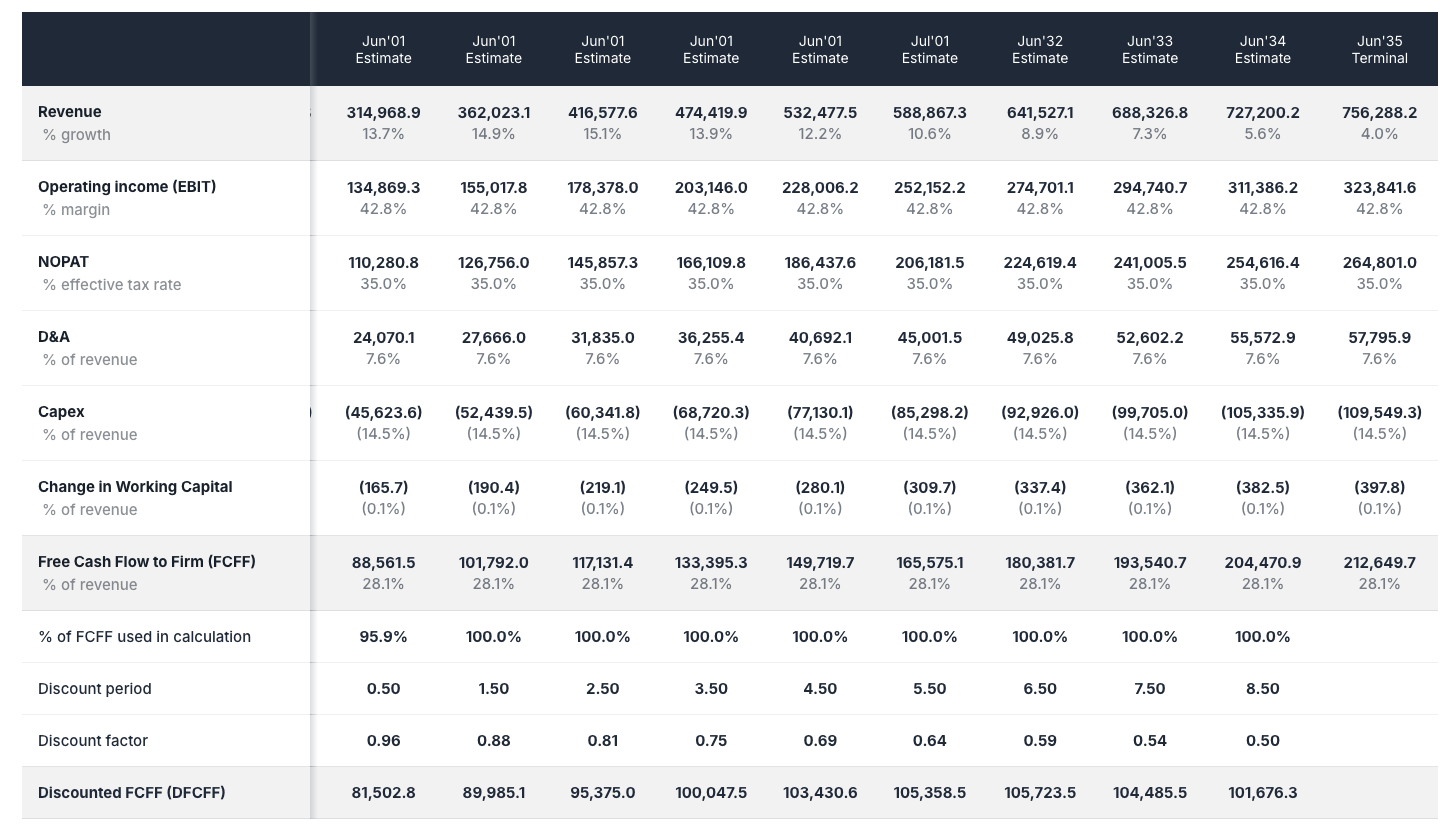
- Year-by-Year Projections: Complete financial forecast
- Revenue to Free Cash Flow: Full calculation transparency
- Multiple Scenarios: Different growth and margin assumptions
- Terminal Value: Long-term value calculation
Equity Value Bridge
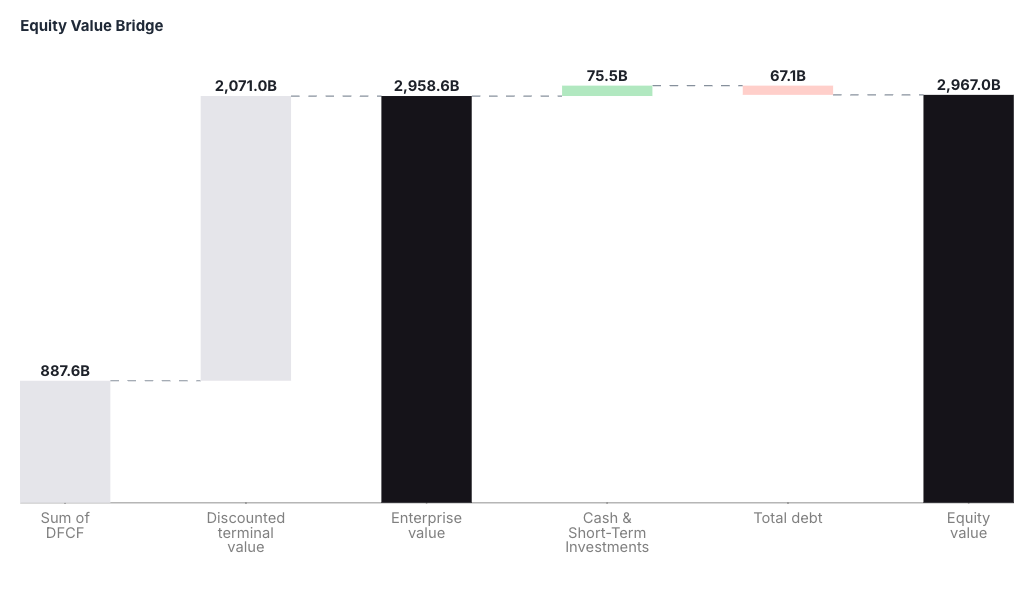
- Visual Waterfall Chart: Shows progression from cash flows to equity value
- Component Breakdown:
- Sum of Discounted Free Cash Flows
- Present Value of Terminal Value
- Cash and Short-term Investments (added)
- Total Debt (subtracted)
- Final Equity Value
DCF Financials Chart
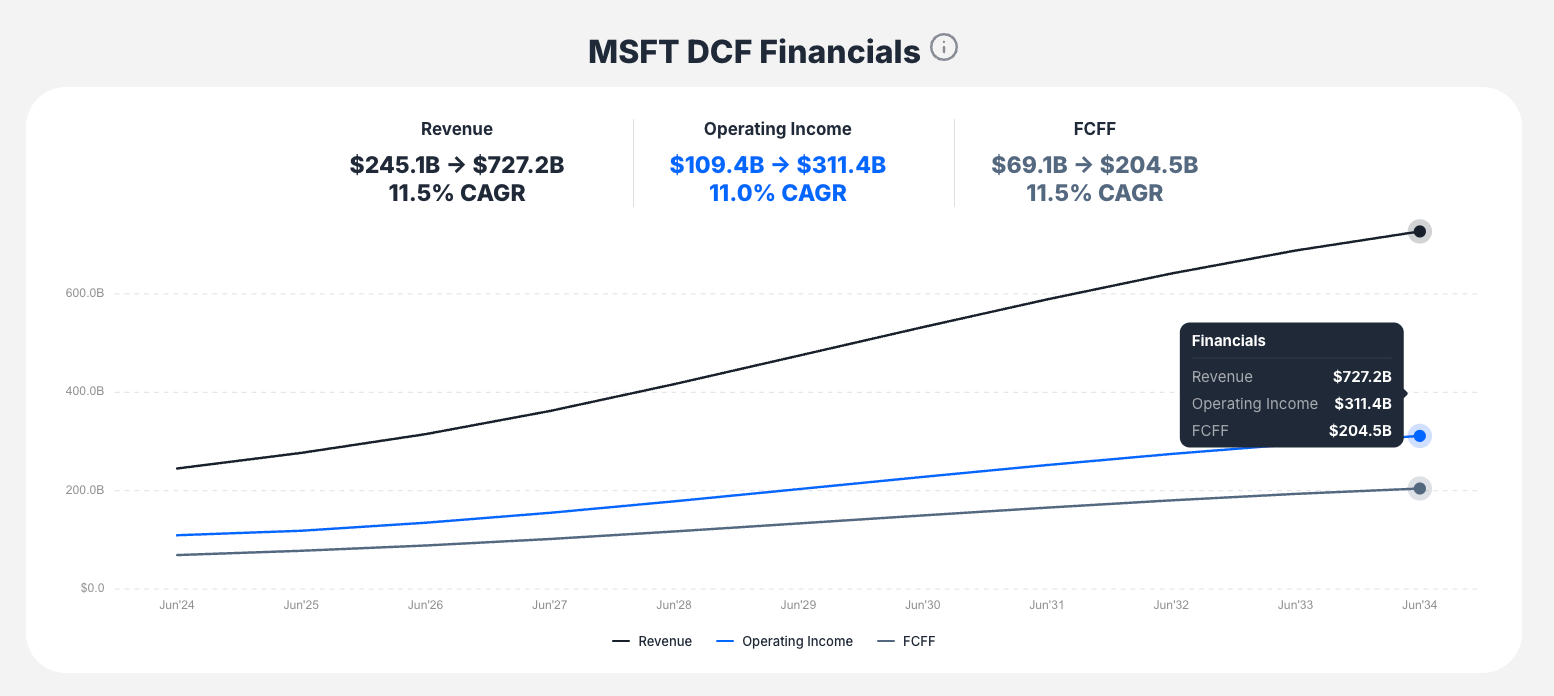
- Growth Trajectory Visualization: Revenue, Operating Income, and FCFF trends
- Interactive Elements: Hover for specific data points
- Projection Period: Visual representation of forecast assumptions
Sensitivity Analysis Tables
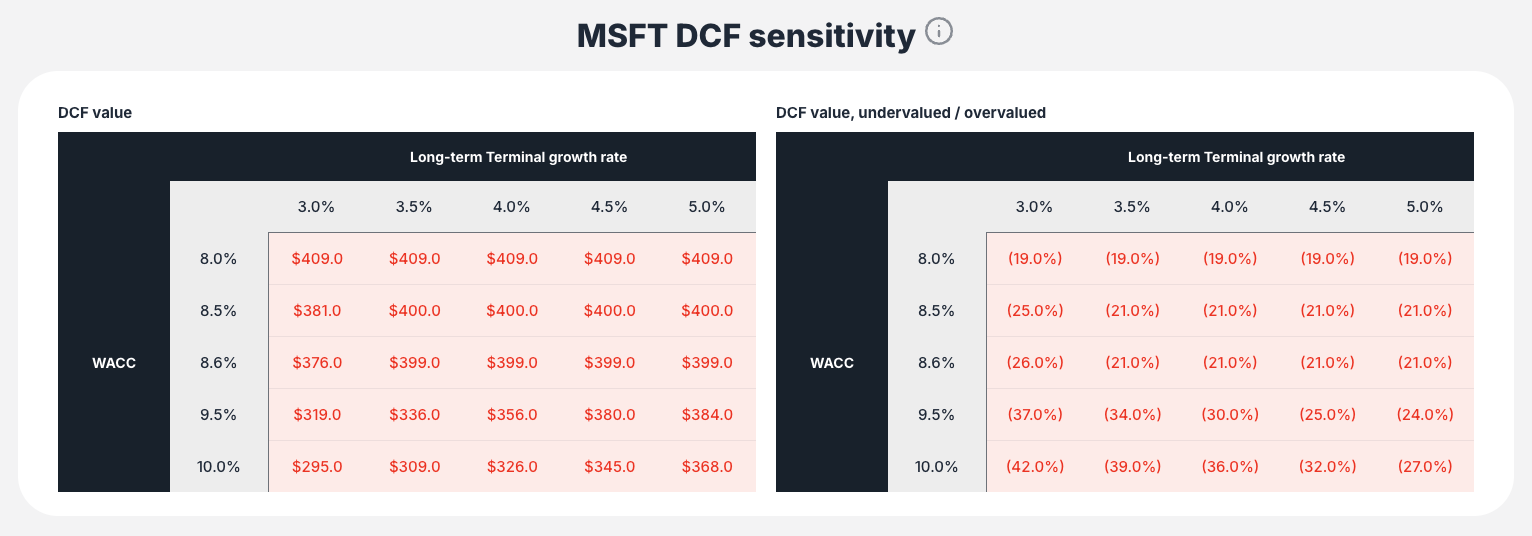
- WACC Sensitivity: How valuation changes with different discount rates
- Growth Rate Sensitivity: Impact of terminal growth rate variations
- Combined Analysis: Matrix showing various scenario outcomes
- Risk Assessment: Understanding assumption sensitivity
Interactive Features
Model Switching
- Tab Navigation: Switch between FCFF, FCFE, and Net Income models
- Methodology Comparison: See how different approaches affect valuation
- Consistent Data: Same underlying assumptions across models
User Interface Controls
- Unit Toggle: Switch between millions and billions for readability
- Interactive Charts: Hover functionality for detailed data points
- Scrollable Layout: Seamless navigation between sections
Data Exploration
- Detailed Tables: Full access to all calculation components
- Visual Analytics: Charts and graphs for pattern recognition
- Assumption Testing: Real-time updates when parameters change
Interpretation and Usage
Primary Interpretation
- Compare DCF Value to Current Price
- Higher DCF value = potentially undervalued
- Lower DCF value = potentially overvalued
- Magnitude indicates degree of mispricing
- Assess Assumption Reasonableness
- Review discount rate appropriateness
- Evaluate growth rate sustainability
- Consider forecast period assumptions
Advanced Analysis
- Sensitivity Testing: Use sensitivity tables to understand valuation ranges
- Value Driver Analysis: Identify which assumptions most impact valuation
- Scenario Planning: Test different economic or company-specific scenarios
Risk Assessment
- Terminal Value Dependency: Understand how much value comes from terminal period
- Assumption Sensitivity: Identify most critical inputs
- Range of Outcomes: Consider multiple scenarios for decision-making
Key Workflow Steps
Step 1: Access and Select
Navigate to DCF calculator and choose your target stock
Step 2: Review Default Analysis
- Examine summary valuation and over/undervaluation status
- Check key assumptions (discount rate, growth rate)
- Understand initial assessment
Step 3: Inspect Detailed Model
- Review year-by-year projections in DCF table
- Understand revenue, margin, and cash flow assumptions
- Identify areas for potential customization
Step 4: Customize Key Assumptions
- Adjust growth rates based on your research
- Modify margin assumptions if needed
- Update discount rate if you have different risk assessment
Step 5: Analyze Sensitivity
- Use sensitivity tables to understand assumption impact
- Test different WACC and growth rate scenarios
- Assess range of potential outcomes
Step 6: Synthesize Results
- Combine DCF results with other valuation methods
- Consider sensitivity analysis in investment decision
- Use integrated platform tools for comprehensive analysis
Best Practices
Model Validation
- Cross-Check Assumptions: Verify growth rates against historical performance
- Industry Context: Compare assumptions to industry averages
- Scenario Testing: Use sensitivity analysis extensively
Customization Guidelines
- Start with Defaults: Review pre-populated assumptions first
- Gradual Adjustments: Modify one parameter at a time
- Document Changes: Keep track of assumption modifications
Results Interpretation
- Range Thinking: Use sensitivity analysis for valuation ranges
- Assumption Dependency: Understand which inputs drive results
- Multiple Methods: Compare DCF results with other valuation approaches
Educational Value
Learning DCF Concepts
- Transparent Calculations: See every step of the valuation process
- Multiple Models: Understand different DCF approaches
- Sensitivity Analysis: Learn importance of assumption testing
Professional Development
- Industry Standards: Uses institutional-grade methodologies
- Practical Application: Real-world valuation experience
- Comprehensive Analysis: Complete valuation workflow
Key Questions the Tool Answers
- "What is this stock's intrinsic value?"
- Direct answer through DCF calculation
- "How sensitive is the valuation to my assumptions?"
- Sensitivity analysis shows assumption impact
- "What drives this company's value?"
- Detailed model breakdown shows value drivers
- "How does this compare to other valuation methods?"
- Integration with other ValueSense tools
- "What if my assumptions are different?"
- Customizable inputs allow scenario testing
The DCF Value Calculator transforms one of finance's most powerful but complex valuation methods into an accessible, transparent, and customizable tool that maintains academic rigor while providing practical investment insights.