ValueSense Intrinsic Value Tools - Discount Rate Calculator
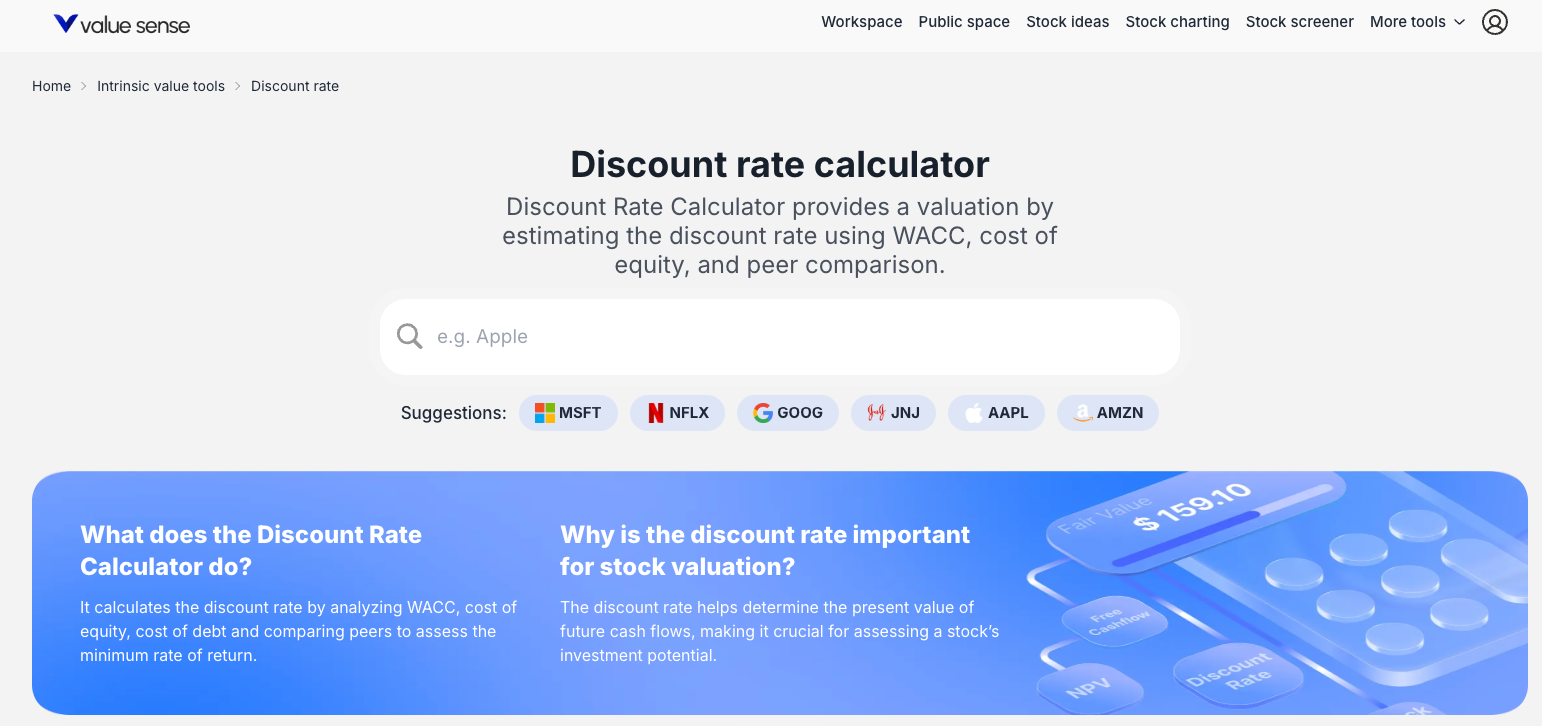
The Discount Rate Calculator is a specialized tool that determines a company's discount rate, which is a critical input for stock valuation models like Discounted Cash Flow (DCF) analysis. It calculates both the Weighted Average Cost of Capital (WACC) and Cost of Equity using industry-standard methodologies, providing the minimum rate of return an investor requires to invest in a stock based on its risk profile.
Accessing the Discount Rate Calculator
From the Value Investing Tools Hub
- Navigate to the main "Value investing tools" page
- Locate the "Discount rate" card
- Click "Find out more →" to access the calculator's landing page
- Search for a company (e.g., "Apple") or click on suggested tickers (like "MSFT")

What the Discount Rate Calculator Does
Core Purpose
The calculator determines the discount rate that represents the minimum rate of return an investor requires to invest in a stock, considering its risk profile. This rate is crucial for assessing a stock's investment potential because it's used to determine the present value of a company's future cash flows.
Key Functions
- WACC Calculation: Computes the Weighted Average Cost of Capital
- Cost of Equity: Determines the return required by equity investors
- Risk Assessment: Quantifies company-specific risk factors
- Valuation Foundation: Provides critical input for DCF and other valuation models
Automated Calculation Process
Primary Input
- Stock Selection: Enter ticker symbol or company name
- Automated Data: Tool automatically pulls all necessary financial data
- No Manual Parameters: No user customization of underlying inputs required
Methodology Standards
- CAPM for Cost of Equity: Uses Capital Asset Pricing Model
- Standard WACC Formula: Industry-standard weighted average calculation
- Current Market Data: Real-time financial information
- Transparent Process: All calculation components clearly displayed
Comprehensive Results and Outputs
Top Summary Metrics
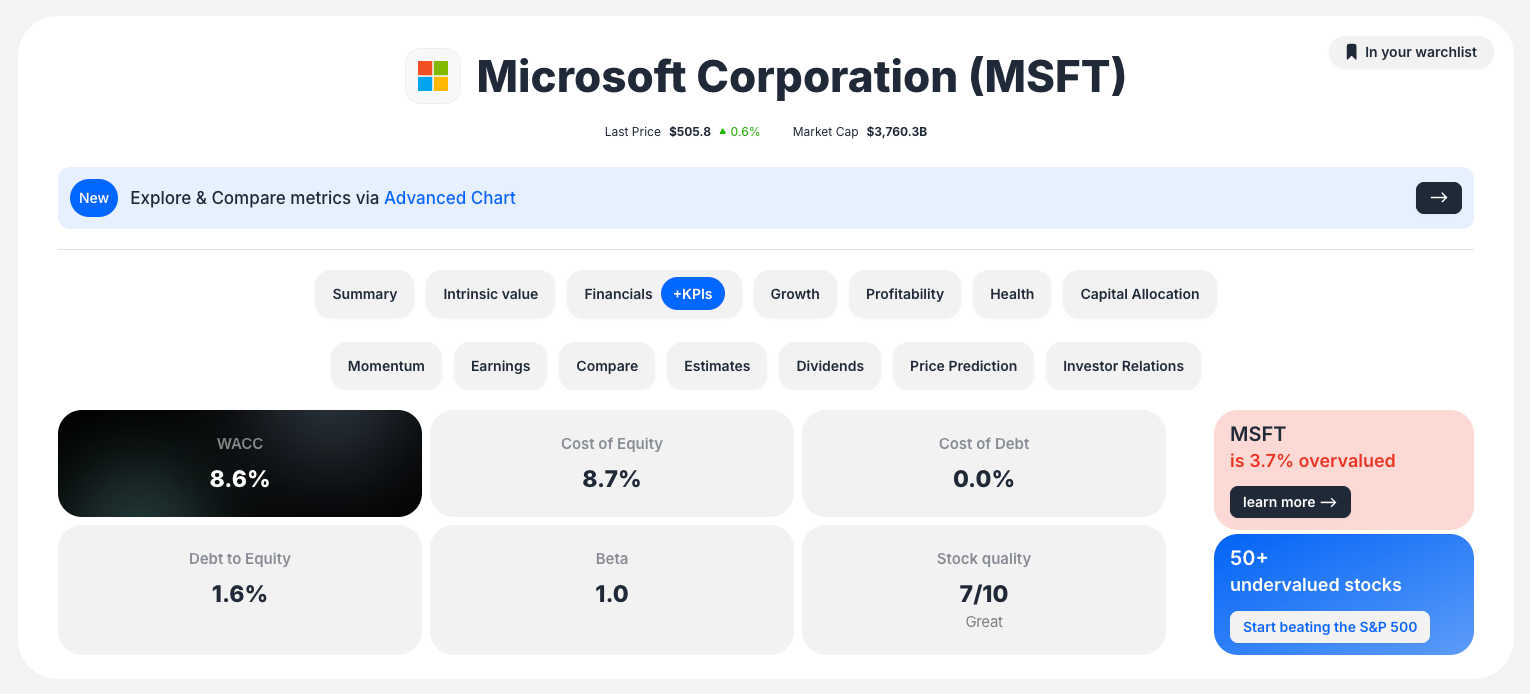
- WACC: Weighted Average Cost of Capital (e.g., 8.6%)
- Cost of Equity: Return required by equity investors (e.g., 8.7%)
- Cost of Debt: After-tax cost of debt financing (e.g., 0.0%)
- Debt to Equity: Capital structure ratio (e.g., 1.6%)
- Beta: Systematic risk measure (e.g., 1.0)
- Stock Quality: Quality score (e.g., 7/10)
- Valuation Summary: Over/undervaluation assessment
Recent WACC Calculation Table
- Detailed breakdown of WACC components
- Cost of Equity and Cost of Debt contributions
- Capital structure weights (% equity, % debt)
- Effective tax rate impact
WACC Dynamics Chart
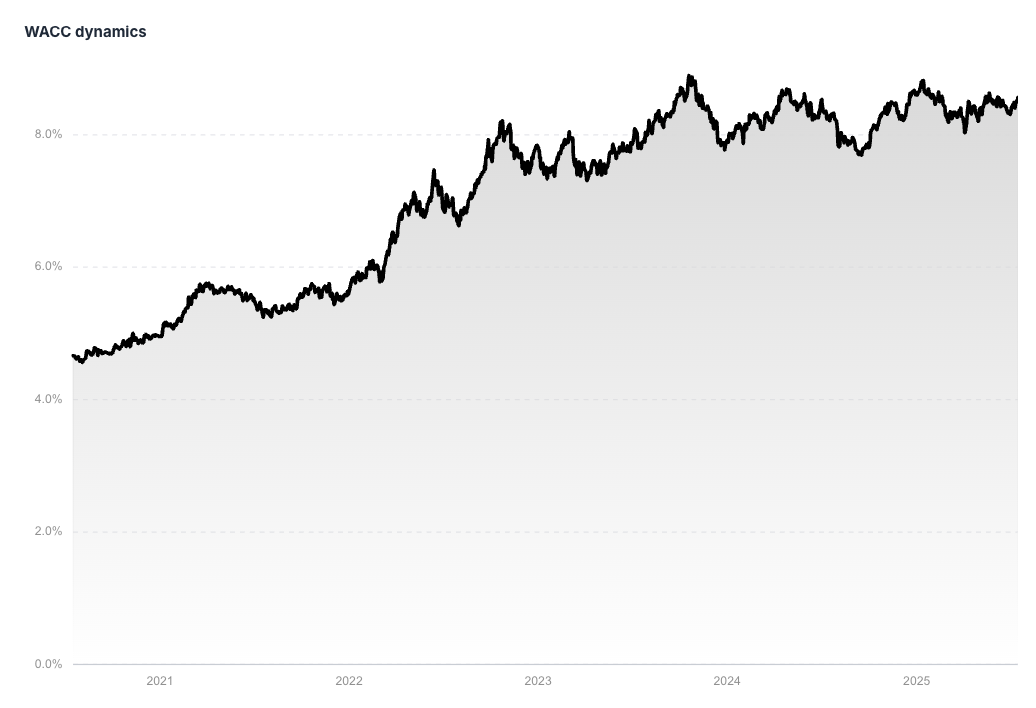
- Interactive line chart showing historical WACC trends
- Hover functionality for specific data points
- Multi-year historical perspective
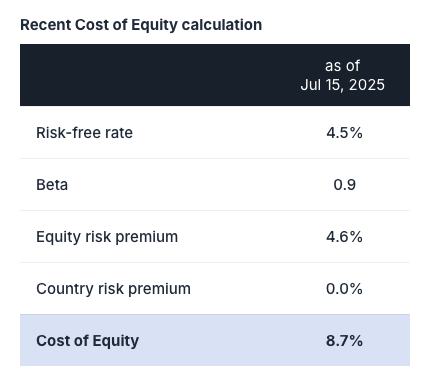
Recent Cost of Equity Calculation Table
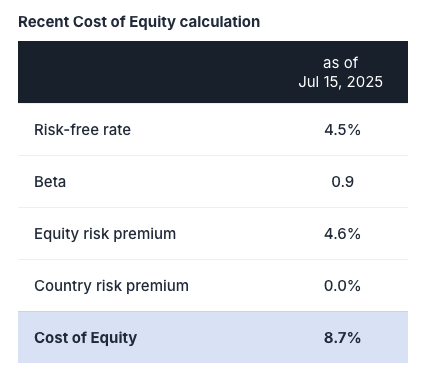
- CAPM model component breakdown:
- Risk-free rate
- Beta coefficient
- Equity risk premium
- Country risk premium
Cost of Equity Dynamics Chart
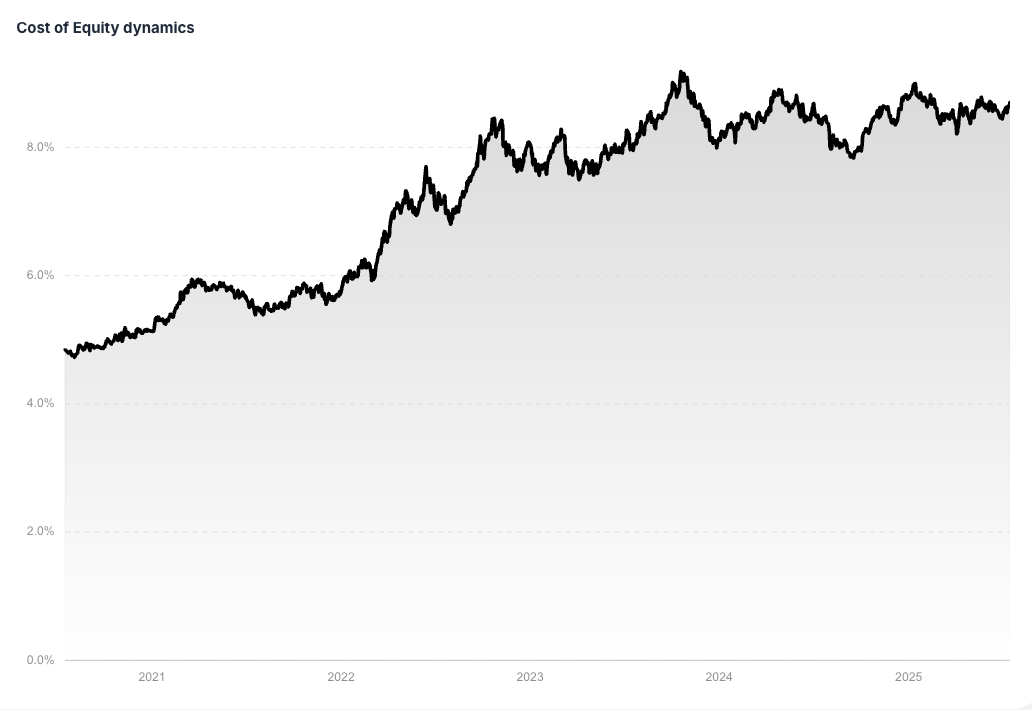
- Historical trend of Cost of Equity
- Interactive data exploration
- Risk profile evolution over time
Peer Set Comparison Table
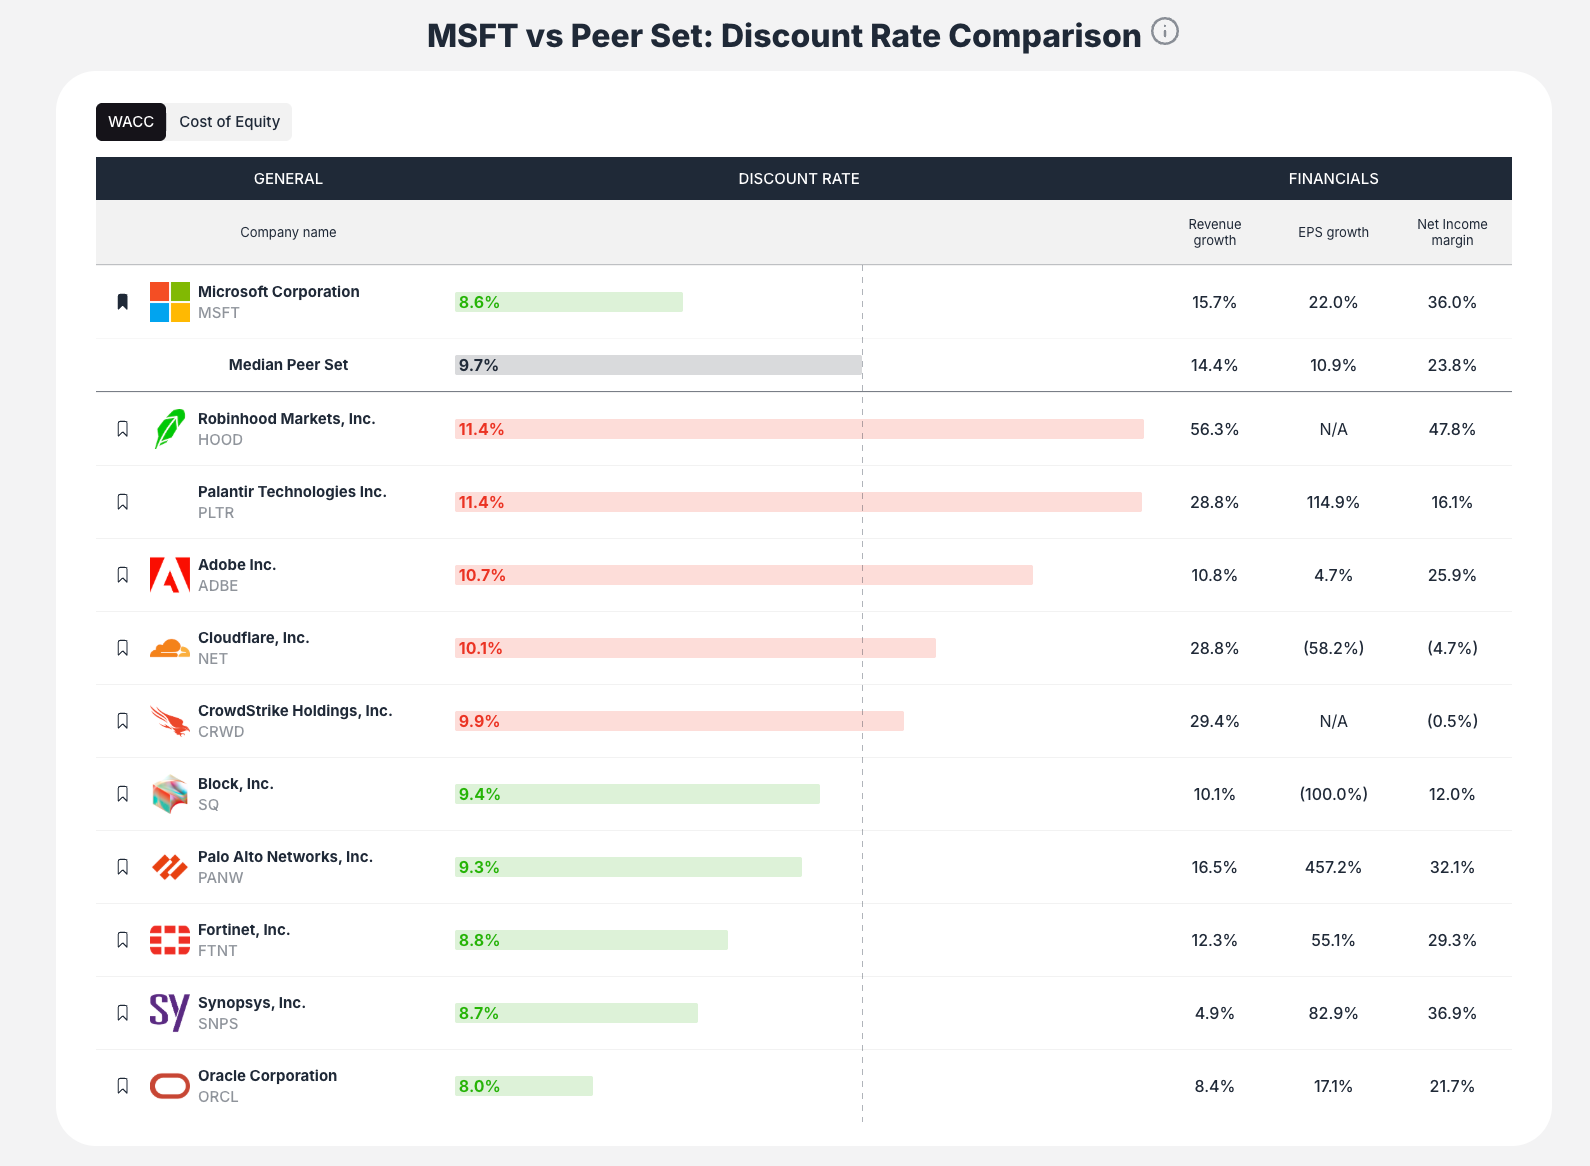
- Benchmark against industry competitors
- Discount Rate comparison (visual bar chart)
- Revenue Growth comparisons
- EPS Growth analysis
- Net Income Margin benchmarking
- Median Peer Set for industry context
- Toggle Views: Switch between WACC and Cost of Equity comparisons
Key Formulas and Methodologies
Cost of Equity (CAPM)
Cost of Equity = Risk-Free Rate + (Beta × Equity Risk Premium) + Country Risk Premium
WACC Formula
WACC = (% Equity × Cost of Equity) + (% Debt × Cost of Debt × (1 - Tax Rate))
Component Definitions
- Risk-Free Rate: Government bond yield (e.g., 4.5%)
- Beta: Stock's correlation with market movements
- Equity Risk Premium: Additional return for equity risk
- Country Risk Premium: Additional return for country-specific risk
Interactive Features
Chart Functionality
- Hover for Details: See specific values and dates on historical charts
- Trend Analysis: Understand historical discount rate patterns
- Visual Comparison: Easy-to-read graphical presentations
Tabbed Interface
- Integrated Analysis: Part of comprehensive stock analysis page
- Peer Comparison Tabs: Toggle between WACC and Cost of Equity views
- Seamless Navigation: Access other analysis sections easily
How to Interpret Results
Primary Interpretation
- WACC as Discount Rate: Use this rate for DCF valuation models
- Risk Assessment: Higher WACC = higher perceived risk
- Peer Comparison: Compare to industry median for relative risk
Advanced Analysis
- Historical Context: Use dynamics charts to understand if current rates are high/low/average
- Relative Risk: Lower WACC suggests market perceives company as less risky than peers
- Capital Structure: Analyze debt-to-equity impact on overall cost of capital
Practical Application
- DCF Modeling: Direct input for discounted cash flow calculations
- Investment Decisions: Higher discount rates require higher returns
- Risk Comparison: Benchmark risk across different investment opportunities
Key Workflow Steps
Step 1: Access and Select
Navigate to the Discount Rate Calculator and choose your target company
Step 2: Review Key Metrics
- Check WACC and Cost of Equity values
- Note stock quality score and valuation summary
- Understand basic risk profile
Step 3: Analyze WACC Components
- Review detailed calculation breakdown
- Understand capital structure impact
- Examine historical WACC trends
Step 4: Examine Cost of Equity
- Study CAPM component breakdown
- Understand risk factors (beta, risk premiums)
- Analyze historical cost of equity trends
Step 5: Benchmark Against Peers
- Compare discount rates to industry competitors
- Understand relative risk positioning
- Analyze growth and profitability context
Step 6: Apply Results
- Use discount rate for valuation models
- Integrate with other ValueSense tools
- Continue comprehensive analysis
Best Practices
Using Discount Rates
- DCF Modeling: Apply WACC directly to cash flow discounting
- Comparative Analysis: Use peer comparison for relative risk assessment
- Historical Context: Consider rate trends when making investment decisions
Risk Assessment
- Beta Analysis: Understand systematic risk exposure
- Peer Benchmarking: Compare risk profiles within industry
- Capital Structure: Consider debt-to-equity impact on cost of capital
Validation
- Peer Comparison: Validate calculated rates against industry norms
- Historical Trends: Ensure current rates are reasonable
- Component Analysis: Verify individual calculation components
Key Questions the Tool Answers
- "What discount rate should I use for this stock's DCF model?"
- Direct answer through WACC calculation
- "How risky is this stock compared to its peers?"
- Peer comparison table provides risk context
- "Is the current discount rate high or low historically?"
- Historical dynamics charts show trends
- "What drives this company's cost of capital?"
- Detailed calculation breakdowns show component contributions
- "How does the capital structure affect the discount rate?"
- WACC breakdown shows debt vs. equity impact
Educational Value
Transparent Methodology
- Standard Formulas: Uses industry-accepted CAPM and WACC calculations
- Component Visibility: Shows all inputs and calculations
- Educational Tool: Helps users understand discount rate concepts
Professional Application
- Investment Banking Standard: Uses institutional-grade methodologies
- Academic Foundation: Based on established financial theory
- Practical Implementation: Ready for real-world valuation work
The Discount Rate Calculator transforms complex financial theory into an accessible, automated tool that provides the foundation for sophisticated stock valuation while maintaining transparency and educational value throughout the process.