ValueSense Intrinsic Value Tools - Earnings Growth Model
The Earnings Growth Model is a sophisticated tool that estimates the annual expected return of a stock over 3 or 5 years by breaking down total returns into three fundamental components. This approach helps you understand exactly where future returns are expected to come from and test different scenarios based on your own assumptions.
Accessing the Earnings Growth Model
From the Value Investing Tools Hub
- Navigate to the main "Value investing tools" page
- Scroll through the available tools to find the "Earnings growth model" card
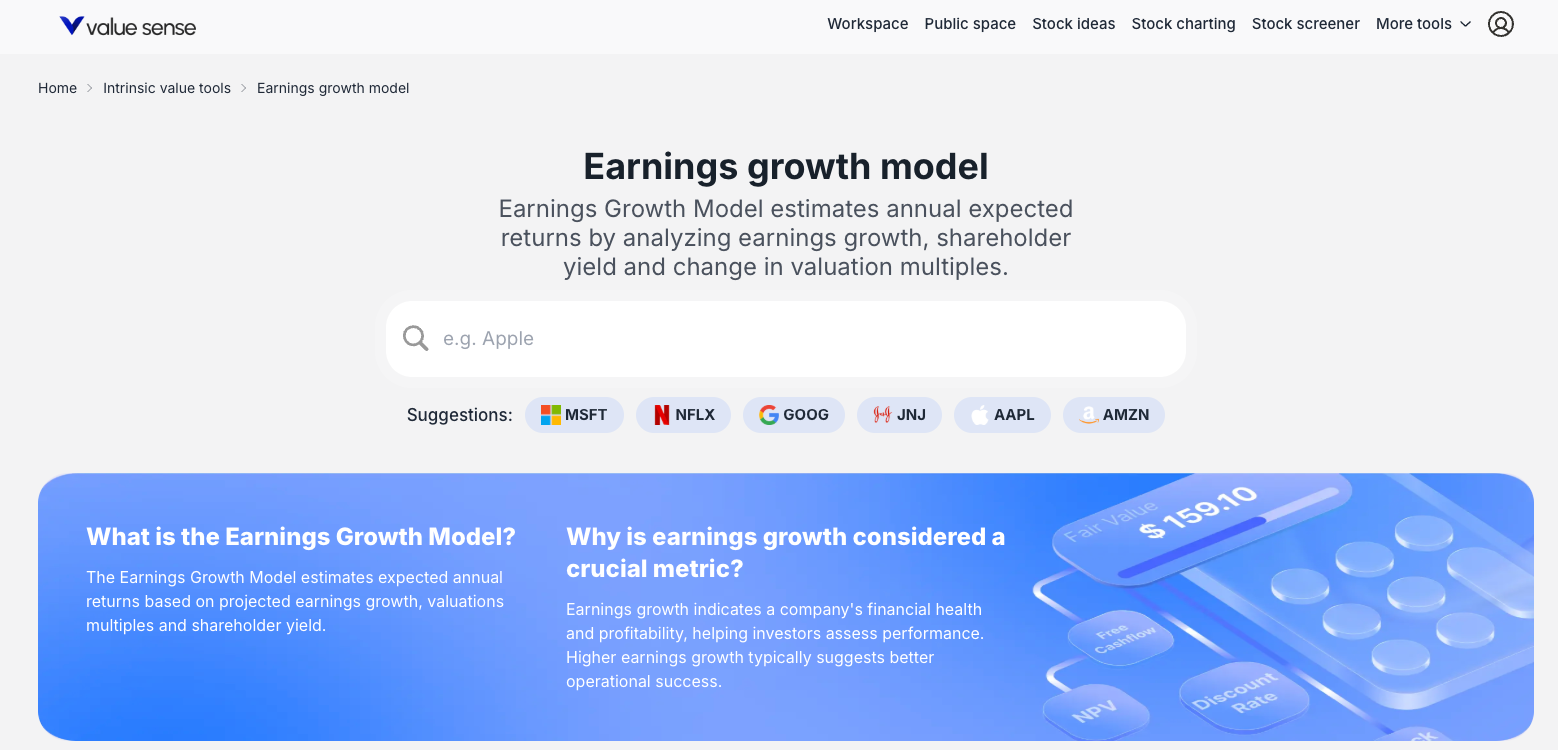
- Click "Find out more →" to access the tool's landing page
- Search for a specific stock (e.g., "Apple") or click on suggested tickers (MSFT, NFLX, GOOG)

What the Earnings Growth Model Does
Core Purpose
The model estimates the annual expected return of a stock by decomposing total returns into three fundamental drivers:
- Earnings Growth: Projected annual growth in earnings per share (EPS)
- Shareholder Yield: Returns from dividends and net share buybacks
- Change in Valuation Multiples: Impact from P/E multiple expansion or contraction
Key Formula
Total Annual Return ≈ Annual Earnings Growth + Annual Shareholder Yield + Annualized Change in Valuation Multiple
Investment Value
- Provides clear visibility into return drivers
- Helps identify which factors matter most for your investment
- Enables scenario analysis and assumption testing
- Facilitates comparison across different stocks and time horizons
Interactive Features and Customization
Time Horizon Selection
- 3Y Annual Expected Return: Three-year projection
- 5Y Annual Expected Return: Five-year projection
- Toggle between time frames using tabs above the chart
Component Editing
- Click directly on any bar in the waterfall chart
- Input your own percentage value for that component
- Real-time recalculation of total expected return
- Test different scenarios instantly
Default vs. Custom Analysis
- Start with "ValueSense default" assumptions
- Override with your own projections
- Compare impact of different assumptions
Key Outputs and Results
Interactive Waterfall Chart
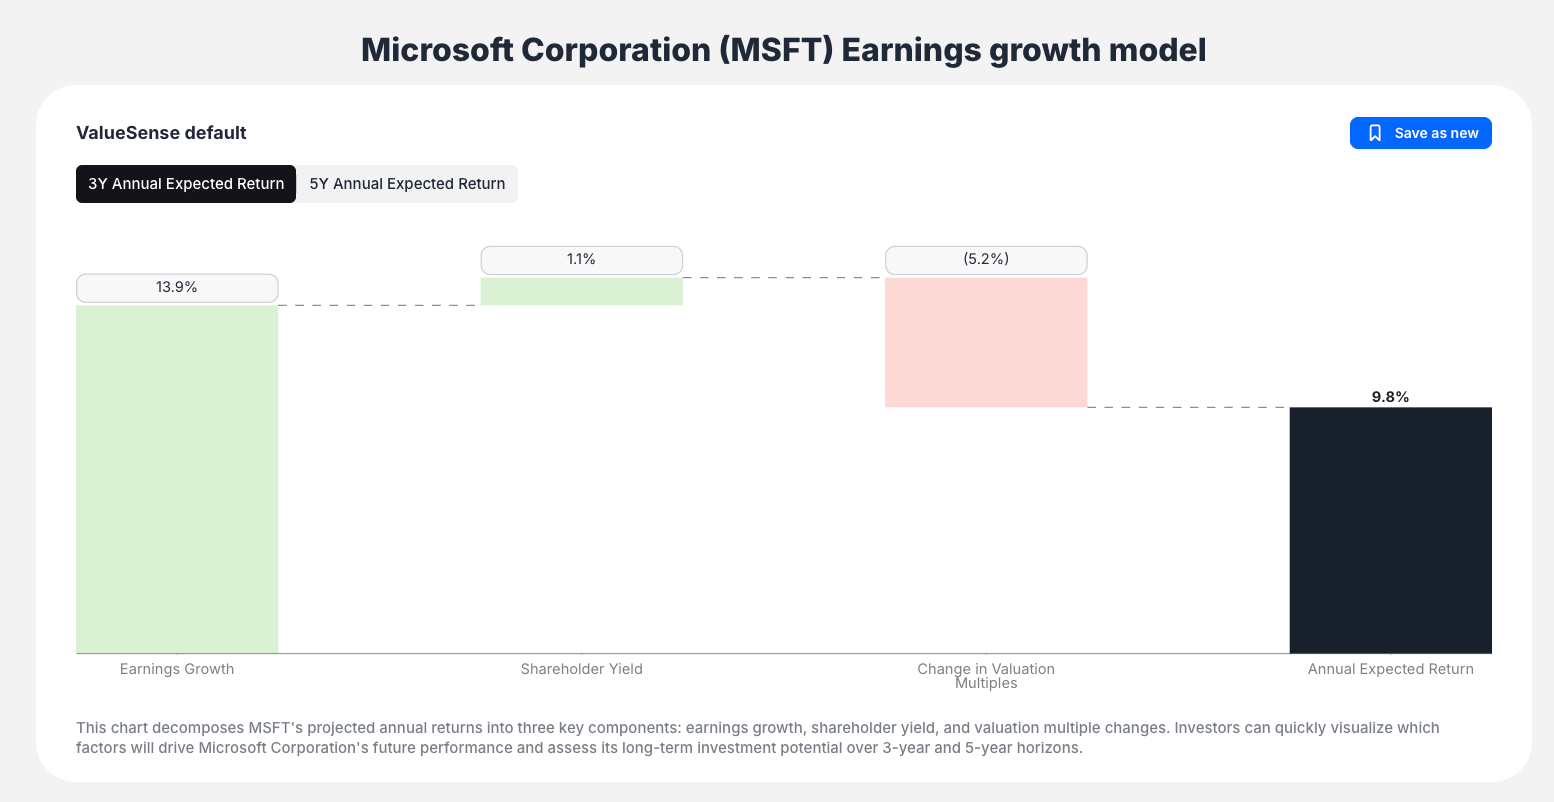
- Primary visualization showing return breakdown
- Color-coded bars: Green for positive contributions, red for negative
- Editable components: Click to modify assumptions
- Total return calculation: Final bar shows combined result
Expected Return Metrics
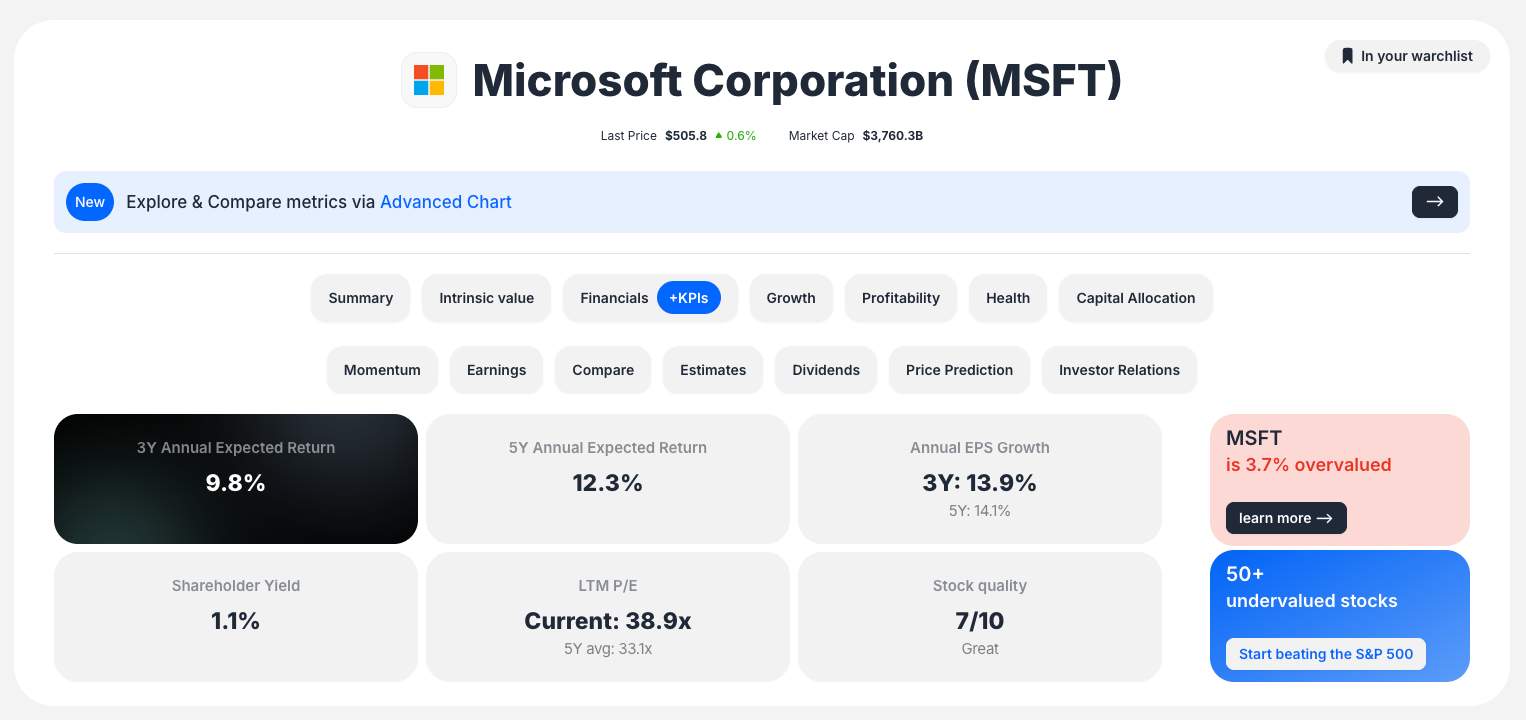
- 3Y Annual Expected Return: Short-term projection
- 5Y Annual Expected Return: Long-term projection
- Summary integration: Results displayed in main stock summary
Peer Set Comparison Table
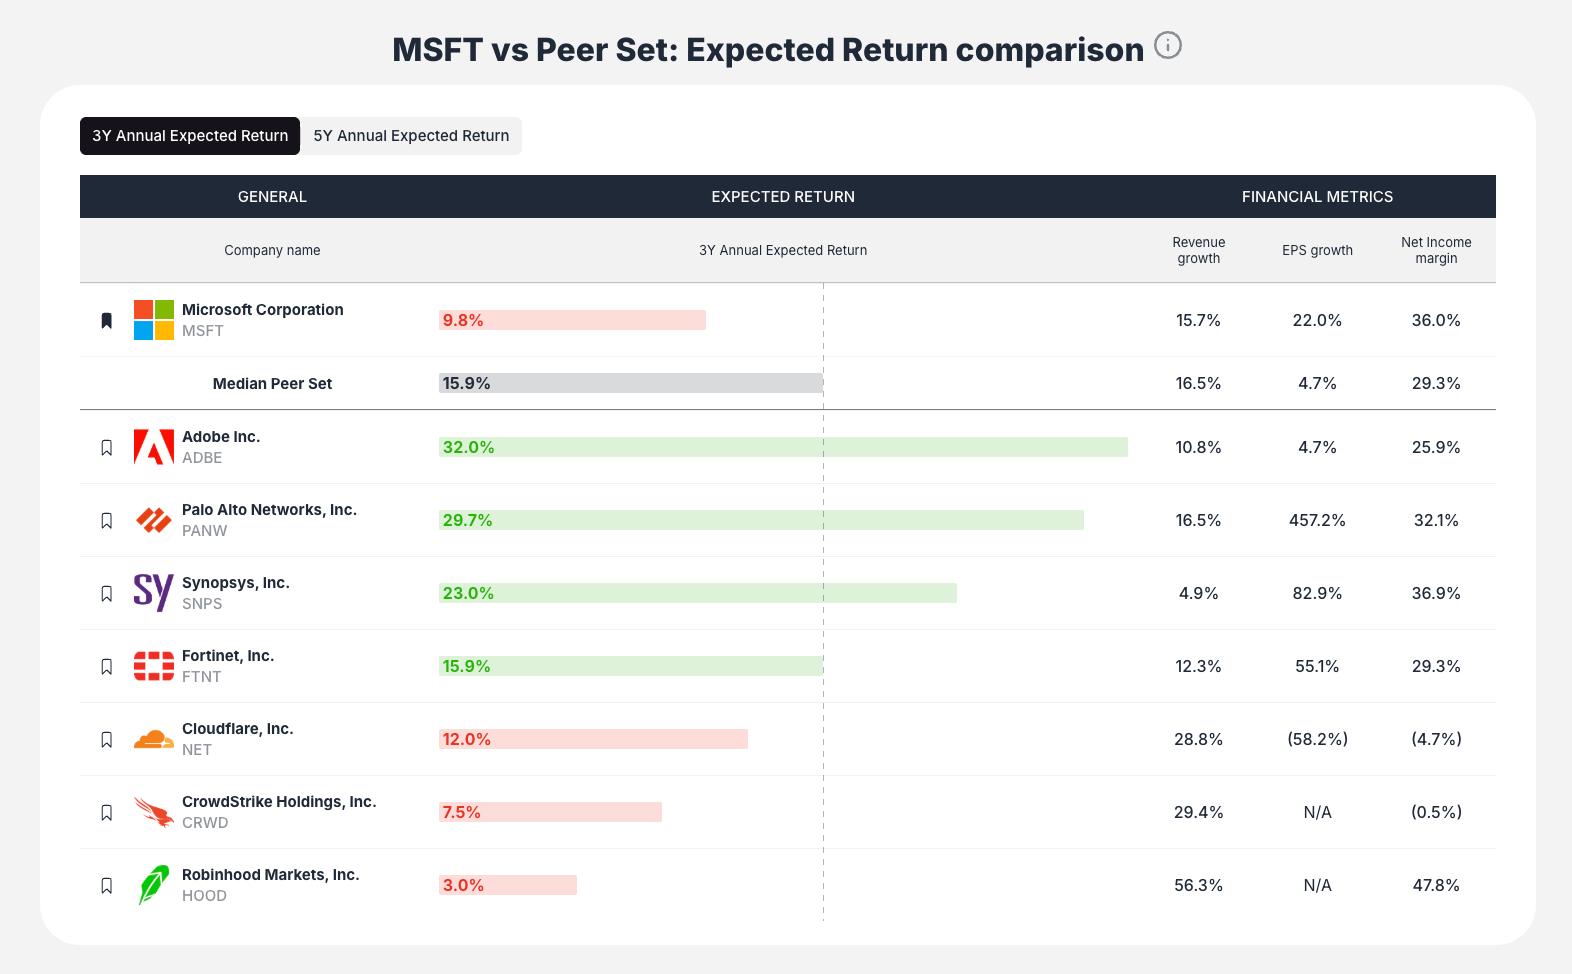
Benchmarks your selected stock against competitors on:
- Expected Return (3Y and 5Y)
- Revenue Growth
- EPS Growth
- Net Income Margin
Methodology Documentation
- FAQ Section: Detailed explanation of model methodology
- Assumption Sources: How default values are derived
- Key term definitions: Clear explanations of all components
Understanding the Three Components
1. Earnings Growth
- Annual growth rate in earnings per share
- Often the largest driver of long-term returns
- Based on analyst forecasts and historical patterns
2. Shareholder Yield
- Returns from dividends paid to shareholders
- Impact of share buybacks (reducing share count)
- Immediate return component independent of growth
3. Change in Valuation Multiples
- Impact of P/E ratio expansion or contraction
- Market sentiment and valuation changes over time
- Can be positive (multiple expansion) or negative (multiple compression)
How to Interpret Results
Understand Return Drivers
- Identify which component contributes most to expected returns
- Recognize potential risks from negative components
- Assess balance between growth and valuation components
Scenario Analysis
Test different assumptions by asking:
- "What if earnings growth is only 10% instead of 13.9%?"
- "What if the P/E multiple stays constant?"
- "How sensitive is total return to dividend changes?"
Competitive Benchmarking
- Compare expected returns across peer companies
- Identify relative attractiveness within industry
- Understand why some stocks have higher return expectations
Key Workflow Steps
Step 1: Navigate and Select
Access the tool and choose your target stock for analysis
Step 2: Initial Review
- Observe default 3Y and 5Y expected returns
- Analyze the waterfall chart breakdown
- Identify primary return drivers
Step 3: Customize and Test
- Click on chart bars to edit assumptions
- Test different scenarios for each component
- Watch total return update in real-time
Step 4: Benchmark Analysis
- Review peer comparison table
- Compare expected returns and growth metrics
- Understand relative investment attractiveness
Step 5: Form Conclusion
- Synthesize component analysis and peer comparisons
- Consider sensitivity to different assumptions
- Make informed investment decision
Integration with ValueSense Platform
Stock Analysis Integration
- Appears as dedicated section on main stock analysis page
- Alongside other tabs (Summary, Intrinsic value, Financials)
- Expected returns displayed in main summary box
Tools Hub Connection
- Links to other valuation tools for the same stock
- Facilitates deeper analysis with DCF, Earnings Power Value
- Comprehensive valuation approach
Best Practices
Assumption Testing
- Start with default ValueSense assumptions
- Modify one component at a time to understand impact
- Test both optimistic and pessimistic scenarios
Time Horizon Consideration
- Use 3Y projections for shorter-term investments
- Use 5Y projections for long-term investment strategies
- Consider how components might change over different periods
Peer Context
- Always compare to industry peers
- Understand why expected returns differ across companies
- Consider competitive dynamics and market position
Component Balance
- Prefer returns driven by earnings growth over multiple expansion
- Consider sustainability of high shareholder yields
- Be cautious of returns heavily dependent on valuation changes
Key Questions the Model Answers
- "What return can I expect from this stock?"
- Direct answer through 3Y/5Y expected return calculations
- "Where will my returns come from?"
- Waterfall chart breaks down all return components
- "How sensitive are returns to my assumptions?"
- Interactive editing allows immediate sensitivity analysis
- "How does this compare to similar companies?"
- Peer comparison table provides industry context
- "What if my assumptions are different from the default?"
- Customizable inputs allow personal assumption testing
Methodology Foundation
Data Sources
- Current financial statements
- Analyst forecasts and estimates
- Historical performance patterns
- Market valuation metrics
Calculation Approach
- Projects future earnings based on growth assumptions
- Applies appropriate future P/E multiple
- Calculates annualized return from current to future price
- Adds shareholder yield component
The Earnings Growth Model transforms complex return analysis into an intuitive, interactive experience that helps you understand not just what returns to expect, but why those returns are expected and how sensitive they are to different assumptions.