
11 Best Earnings Growth Stocks with Positive 5-Year EPS CAGR - Value Sense 2025
Welcome to the Value Sense Blog, your resource for insights on the stock market! At Value Sense, we focus on intrinsic value tools and offer stock ideas with undervalued companies. Dive into our research products and learn more about our unique approach at valuesense.io
Explore diverse stock ideas covering technology, healthcare, and commodities sectors. Our insights are crafted to help investors spot opportunities in undervalued growth stocks, enhancing potential returns. Visit us to see evaluations and in-depth market research.
The Strategic Power of Consistent Earnings Growth
Earnings Per Share (EPS) growth represents the fundamental driver of long-term stock performance, as companies that consistently expand their profitability create sustainable shareholder value through various market cycles. Our analysis focuses on companies demonstrating positive earnings growth over five-year periods, indicating proven ability to enhance profitability despite economic uncertainty and competitive pressures.
Consistent earnings growth requires exceptional management execution, sustainable competitive advantages, and operational efficiency. Companies achieving sustained EPS expansion demonstrate pricing power, market share gains, operational leverage, or strategic positioning that enables profit growth even during challenging economic environments.
Mathematical Foundation of EPS Growth Analysis:
The 5-year EPS Compound Annual Growth Rate is calculated as:
EPS CAGR=(EPSfinalEPSinitial)15−1EPS CAGR=(EPSinitialEPSfinal)51−1
This methodology smooths out quarterly volatility and captures performance through different economic cycles, providing investors with confidence that earnings growth reflects genuine competitive advantages rather than temporary factors.
Earnings Growth Selection Criteria:
- Positive 5-year EPS compound annual growth rate demonstrating consistent profitability expansion
- Strong growth scores indicating exceptional potential across multiple metrics
- Sustainable business models supporting continued earnings expansion
- Quality fundamentals across revenue growth, operational efficiency, and competitive positioning
Top 11 Earnings Growth Stocks - Ranked by 5-Year EPS CAGR
1. NVIDIA Corporation (NVDA) - 87.4% EPS CAGR ⭐
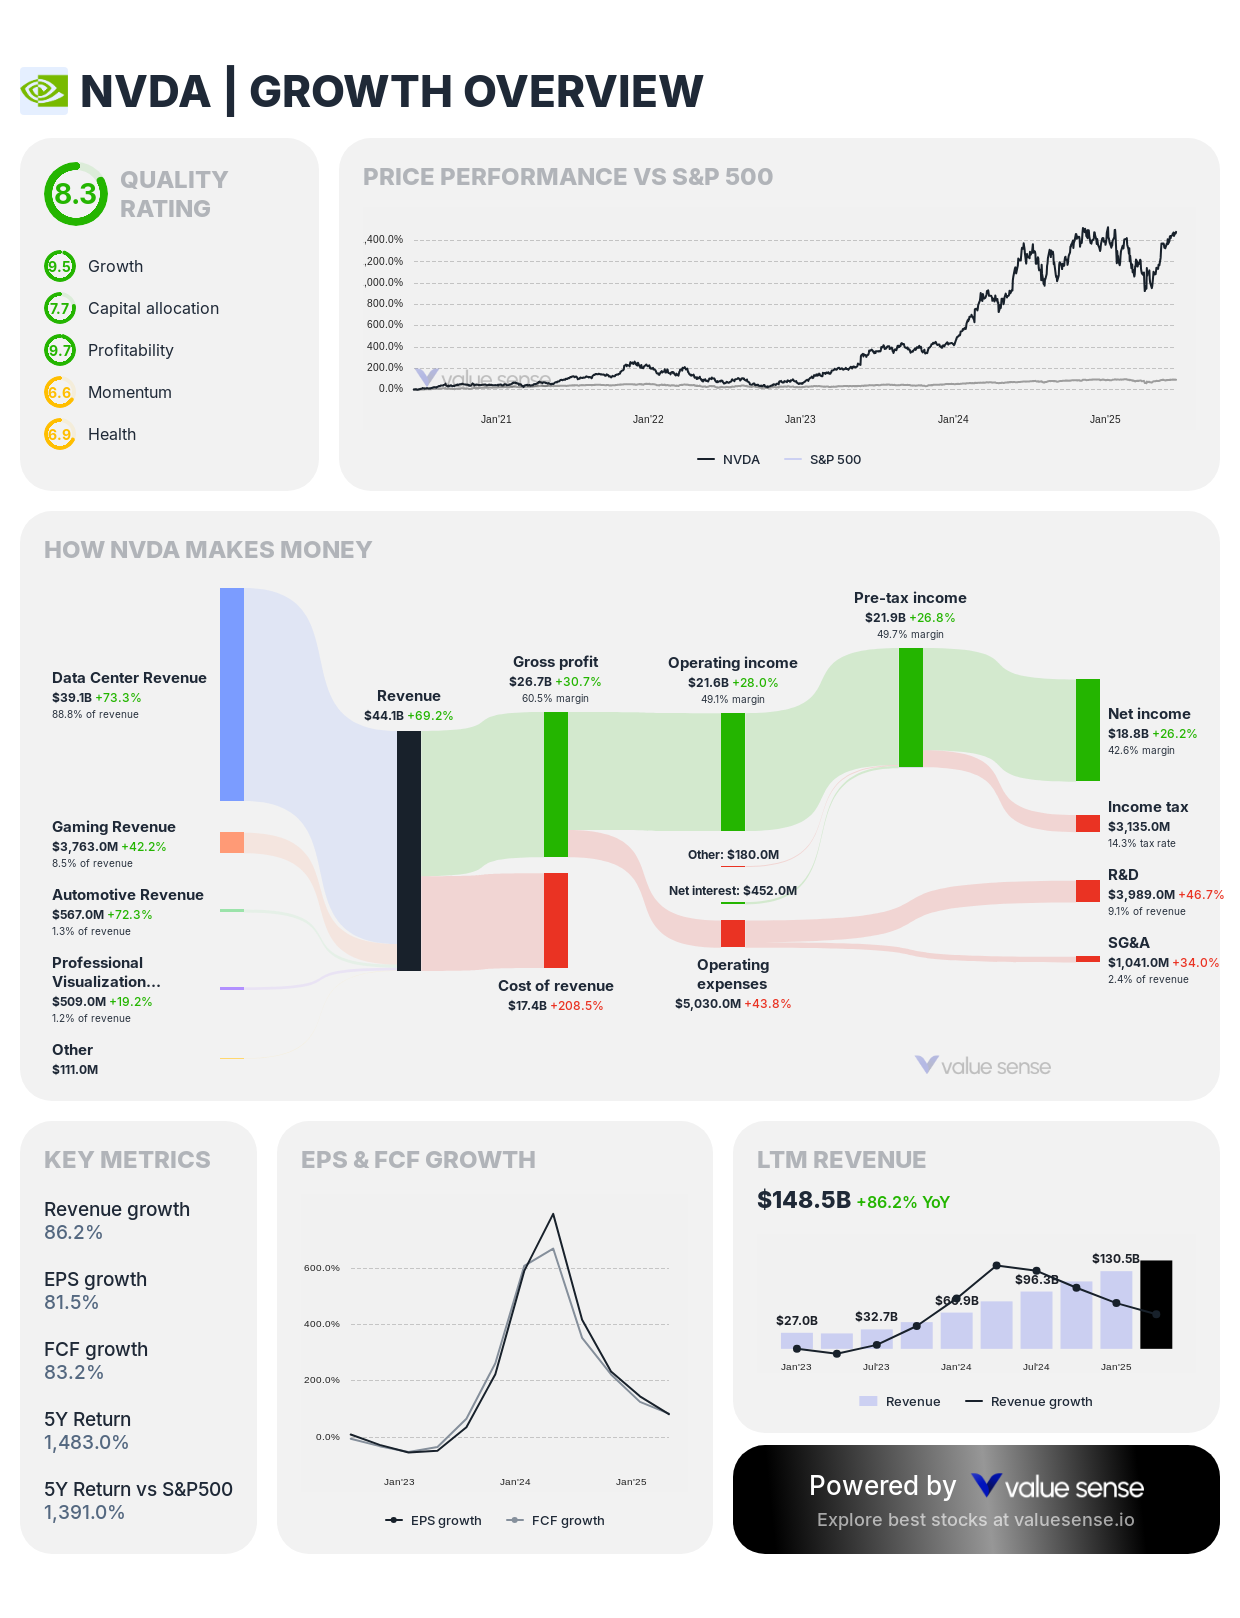
- Growth Score: 8.9 (Exceptional)
- 5-Year EPS CAGR: 87.4%
- 1-Year EPS Growth: 81.5%
- Forward EPS Growth: 52.9%
- 5-Year Revenue CAGR: 66.0%
- 1-Year Revenue Growth: 86.2%
- Forward Revenue Growth: 56.7%
Investment Thesis: NVIDIA achieves extraordinary earnings growth with 87.4% five-year EPS compound annual growth rate, demonstrating the semiconductor leader's exceptional ability to convert artificial intelligence and data center demand into sustained profit expansion. The company's dominance in AI computing creates unprecedented pricing power and demand visibility that translates directly into exceptional earnings growth across multiple business cycles.
Earnings Growth Drivers: NVIDIA's earnings explosion stems from its strategic positioning at the intersection of artificial intelligence, data center computing, gaming, and autonomous vehicles. The company's CUDA software ecosystem creates switching costs and recurring revenue streams that amplify hardware sales into sustained profit growth, while technological leadership in AI accelerators provides substantial competitive moats.
2. Taiwan Semiconductor Manufacturing Company (TSM) - 47.1% EPS CAGR
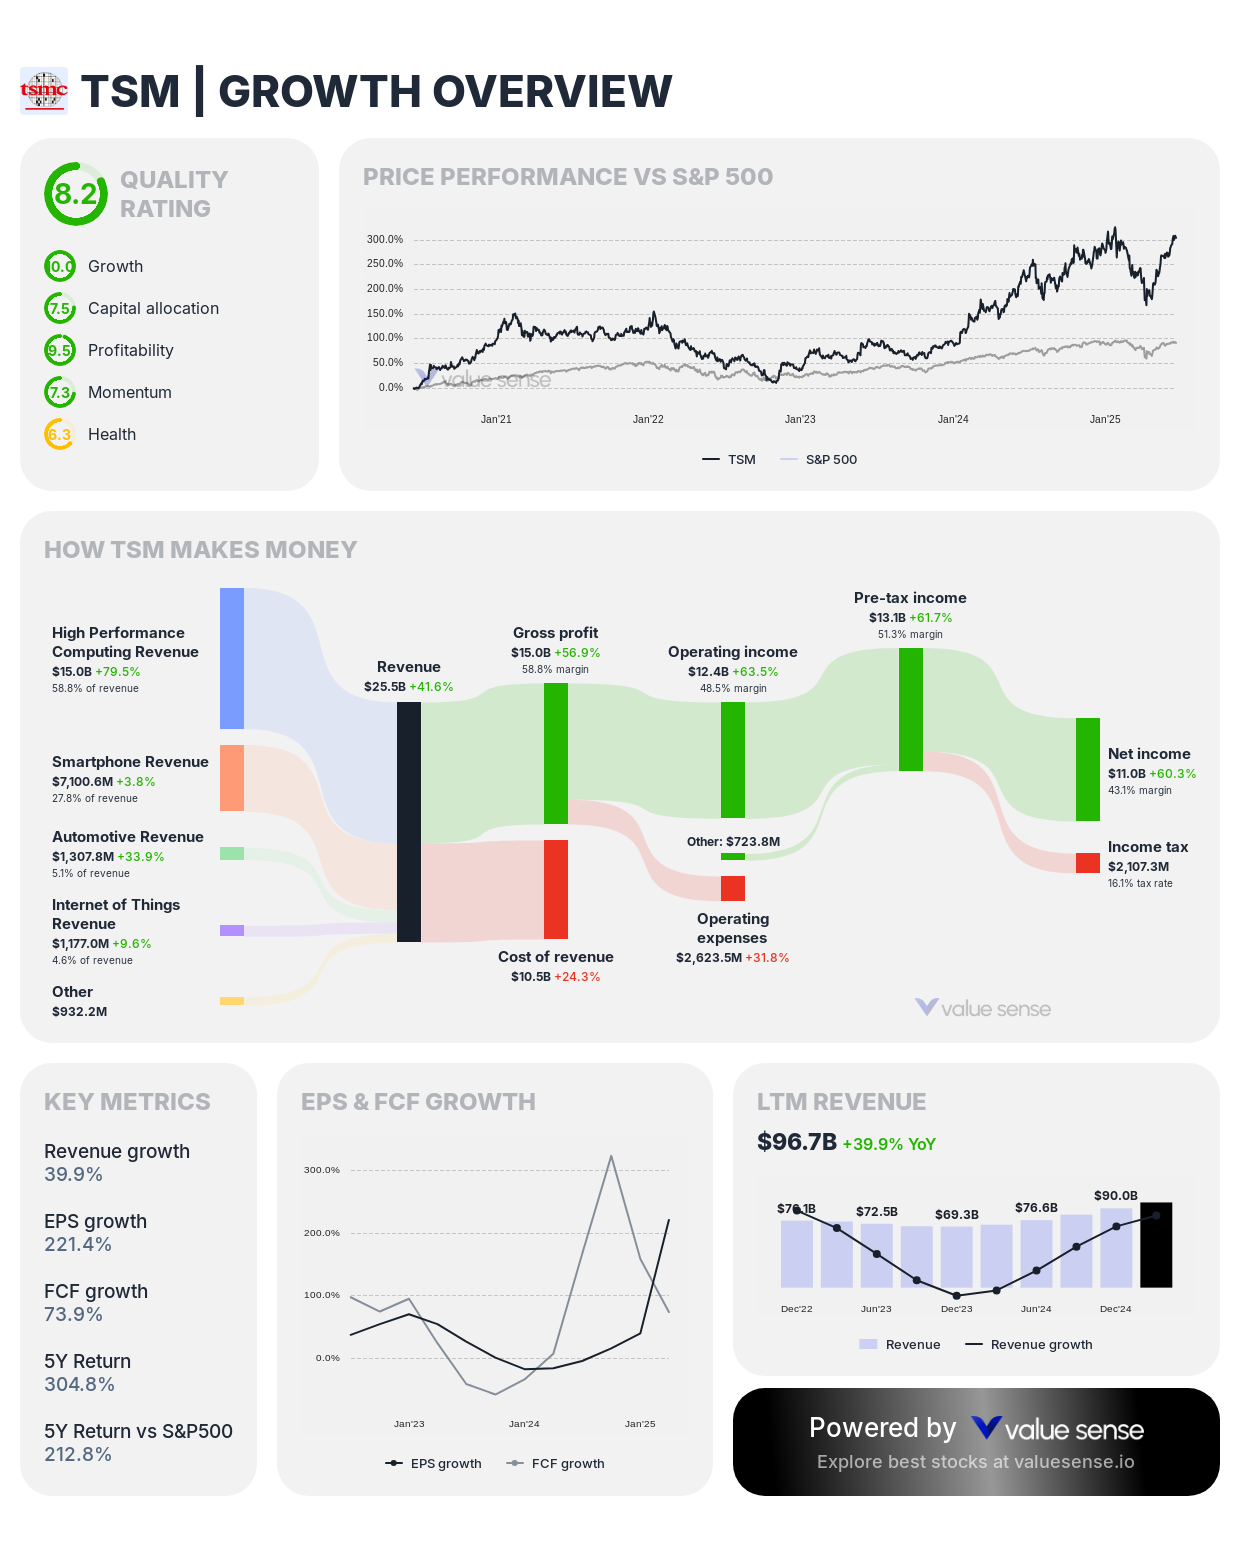
- Growth Score: 8.1 (Exceptional)
- 5-Year EPS CAGR: 47.1%
- 1-Year EPS Growth: 221.4%
- Forward EPS Growth: 564.9%
- 5-Year Revenue CAGR: 22.0%
- 1-Year Revenue Growth: 39.9%
- Forward Revenue Growth: 27.7%
Investment Thesis: TSMC demonstrates exceptional earnings growth with 47.1% five-year EPS CAGR and extraordinary forward guidance of 564.9% EPS growth, reflecting the semiconductor foundry's irreplaceable position in advanced chip manufacturing. The company's technological leadership in cutting-edge process nodes creates substantial profit leverage as demand for advanced semiconductors accelerates globally.
Earnings Growth Drivers: TSMC's earnings expansion stems from its dominant position manufacturing the world's most advanced semiconductors for technology leaders like Apple, NVIDIA, and AMD. The company's continuous technology advancement and capacity expansion create both volume growth and premium pricing that drive exceptional profit expansion, particularly in AI and high-performance computing applications.
3. Amazon.com, Inc. (AMZN) - 42.4% EPS CAGR
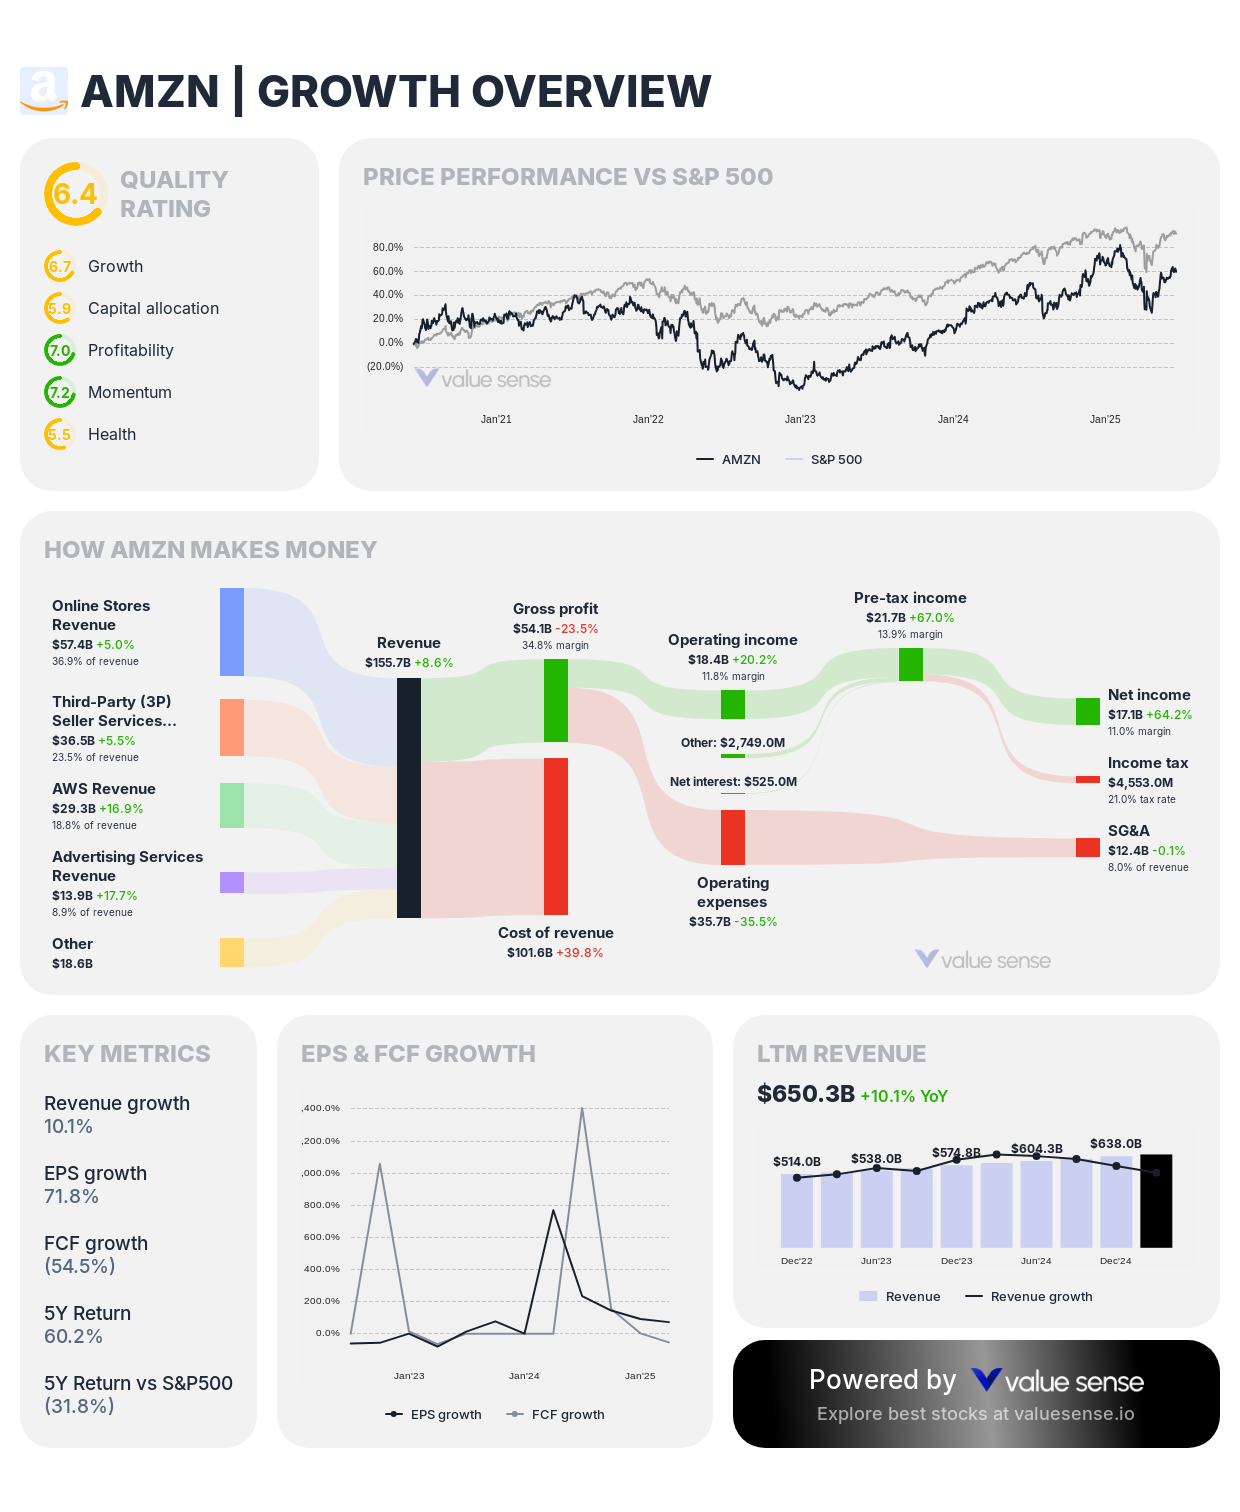
- Growth Score: 6.2 (Strong)
- 5-Year EPS CAGR: 42.4%
- 1-Year EPS Growth: 71.8%
- Forward EPS Growth: 12.2%
- 5-Year Revenue CAGR: 17.0%
- 1-Year Revenue Growth: 10.1%
- Forward Revenue Growth: 9.8%
Investment Thesis: Amazon achieves substantial earnings growth with 42.4% five-year EPS CAGR, driven primarily by AWS cloud services profitability and operational efficiency improvements across e-commerce operations. The company's successful transformation from growth-focused to profit-focused operations creates exceptional earnings leverage from its massive revenue base and diversified business model.
Earnings Growth Drivers: Amazon's earnings expansion reflects the maturation of its high-margin AWS cloud platform, advertising business growth, and operational efficiency gains across logistics and fulfillment. The company's scale advantages and technology investments create operational leverage that amplifies revenue growth into exceptional profit expansion.

4. Netflix, Inc. (NFLX) - 33.6% EPS CAGR
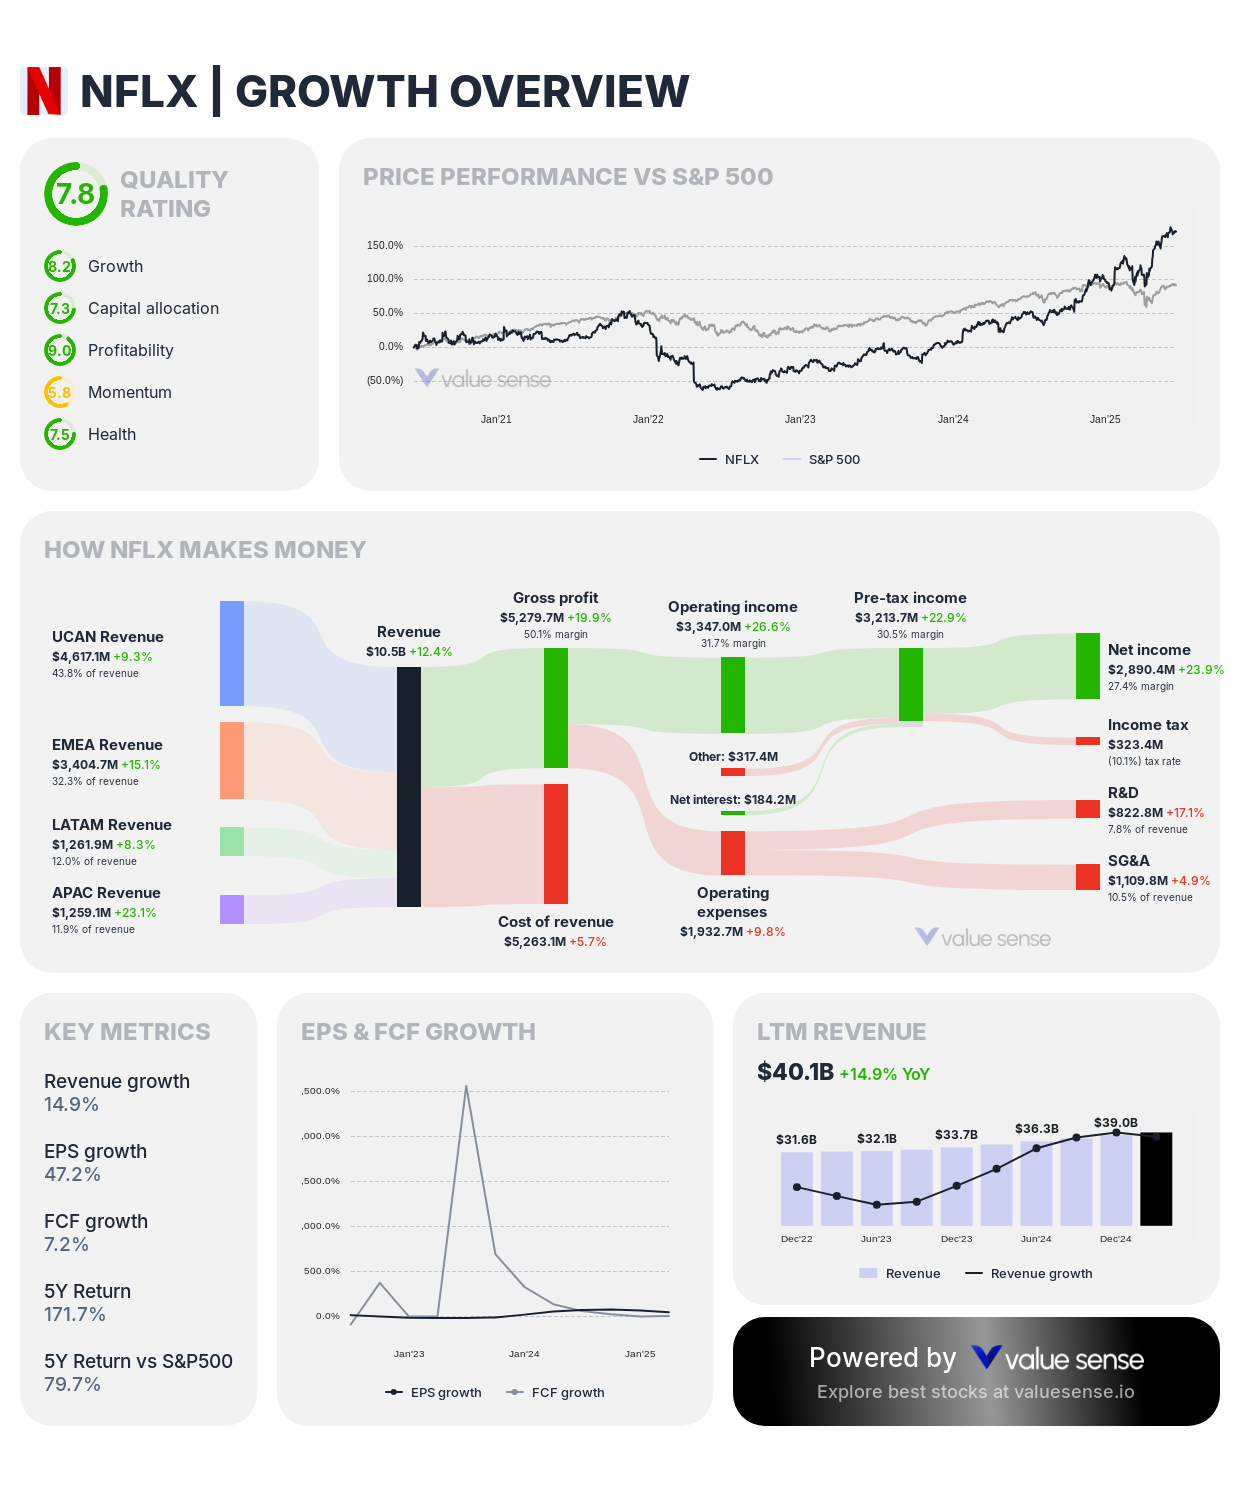
- Growth Score: 6.9 (Strong)
- 5-Year EPS CAGR: 33.6%
- 1-Year EPS Growth: 47.2%
- Forward EPS Growth: 22.3%
- 5-Year Revenue CAGR: 13.4%
- 1-Year Revenue Growth: 14.9%
- Forward Revenue Growth: 13.6%
Investment Thesis: Netflix demonstrates consistent earnings growth with 33.6% five-year EPS CAGR, reflecting the streaming leader's successful transition to profitability focus while maintaining global subscriber growth. The company's massive scale and content strategy create operational leverage that converts subscriber expansion into substantial profit growth.
Earnings Growth Drivers: Netflix's earnings growth stems from its global subscriber base expansion, pricing power through premium content offerings, and operational efficiency improvements. The company's investment in original content creates competitive advantages while its scale enables content cost amortization across growing international subscriber numbers.
5. Alphabet Inc. (GOOGL) - 29.4% EPS CAGR
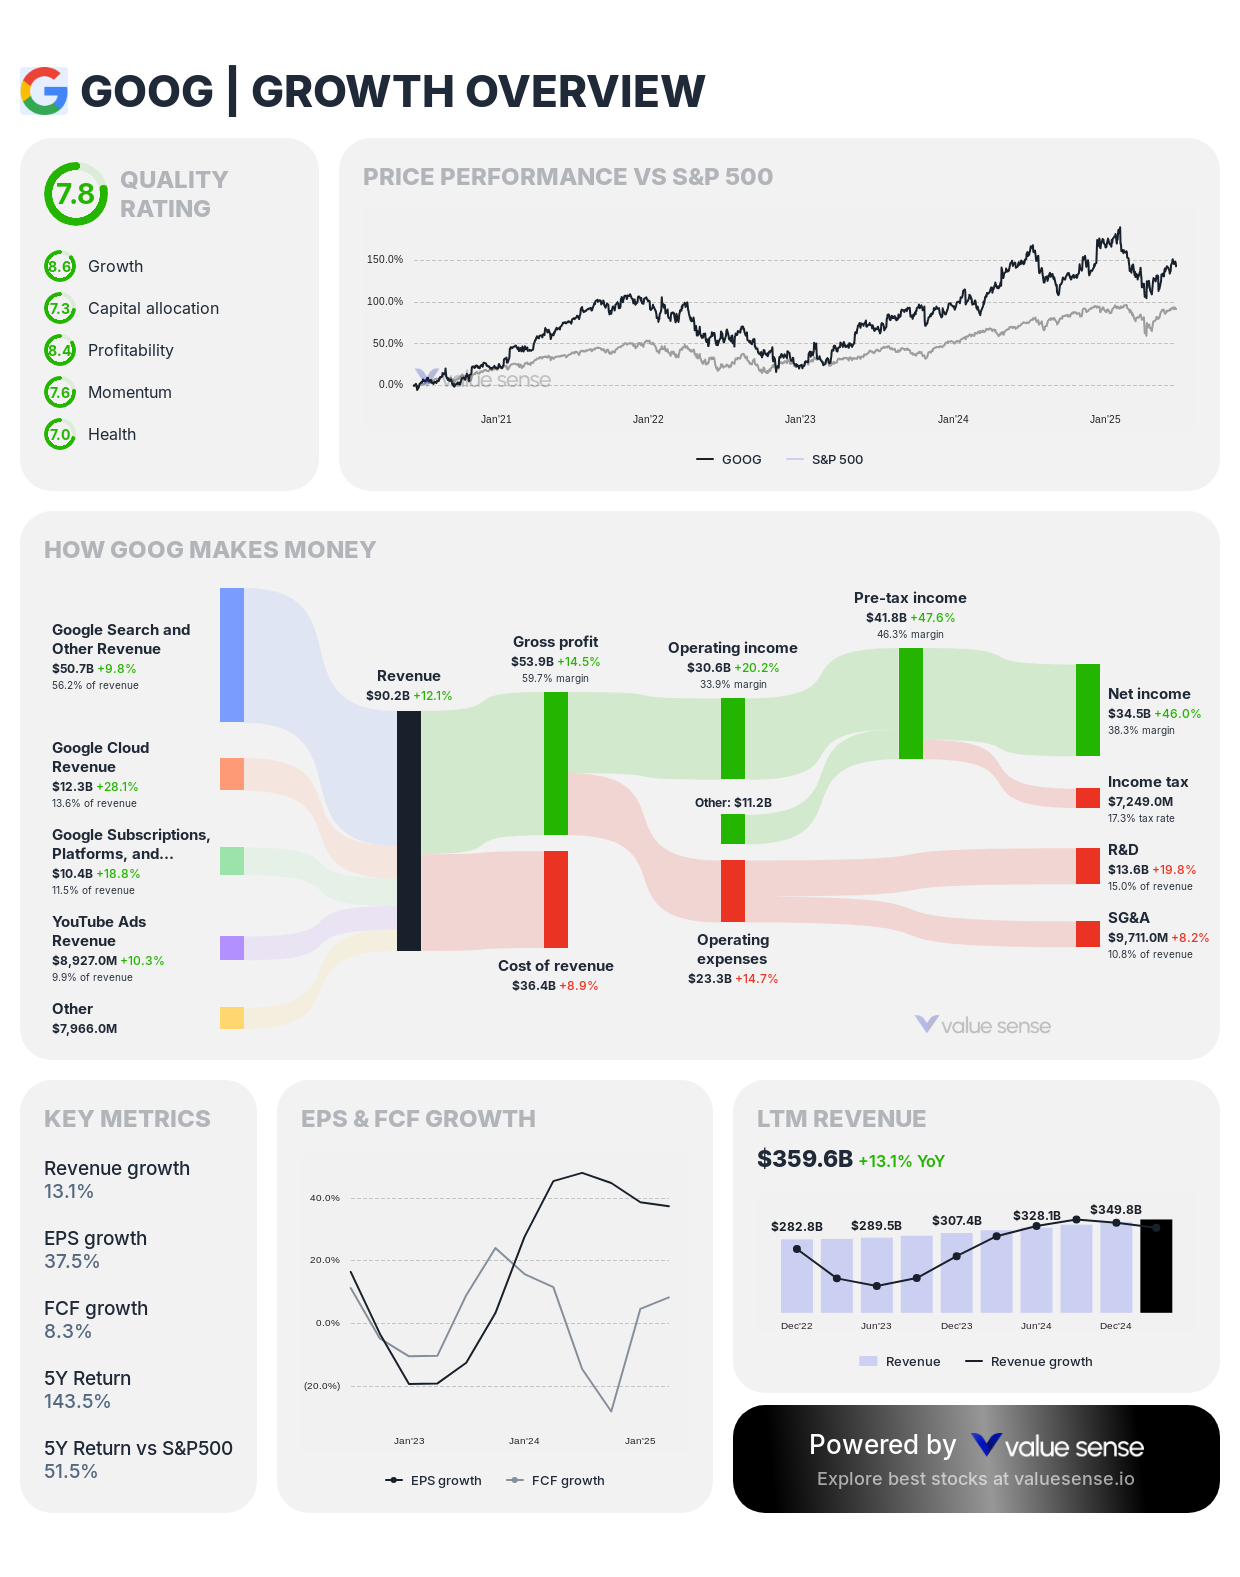
- Growth Score: 8.9 (Exceptional)
- 5-Year EPS CAGR: 29.4%
- 1-Year EPS Growth: 37.5%
- Forward EPS Growth: 10.8%
- 5-Year Revenue CAGR: 16.6%
- 1-Year Revenue Growth: 13.1%
- Forward Revenue Growth: 11.4%
Investment Thesis: Alphabet achieves strong earnings growth with 29.4% five-year EPS CAGR despite its massive scale, supported by exceptional growth score of 8.9. The technology giant's dominant search advertising platform and expanding cloud services create exceptional profit margins and sustained earnings expansion potential across multiple business segments.
Earnings Growth Drivers: Alphabet's earnings growth reflects its search advertising monopoly, YouTube's growing revenue contribution, and Google Cloud's rapid expansion. The company's artificial intelligence capabilities and data advantages create competitive moats that translate into sustained profit growth across search, video, and cloud computing platforms.
6. Meta Platforms, Inc. (META) - 29.1% EPS CAGR
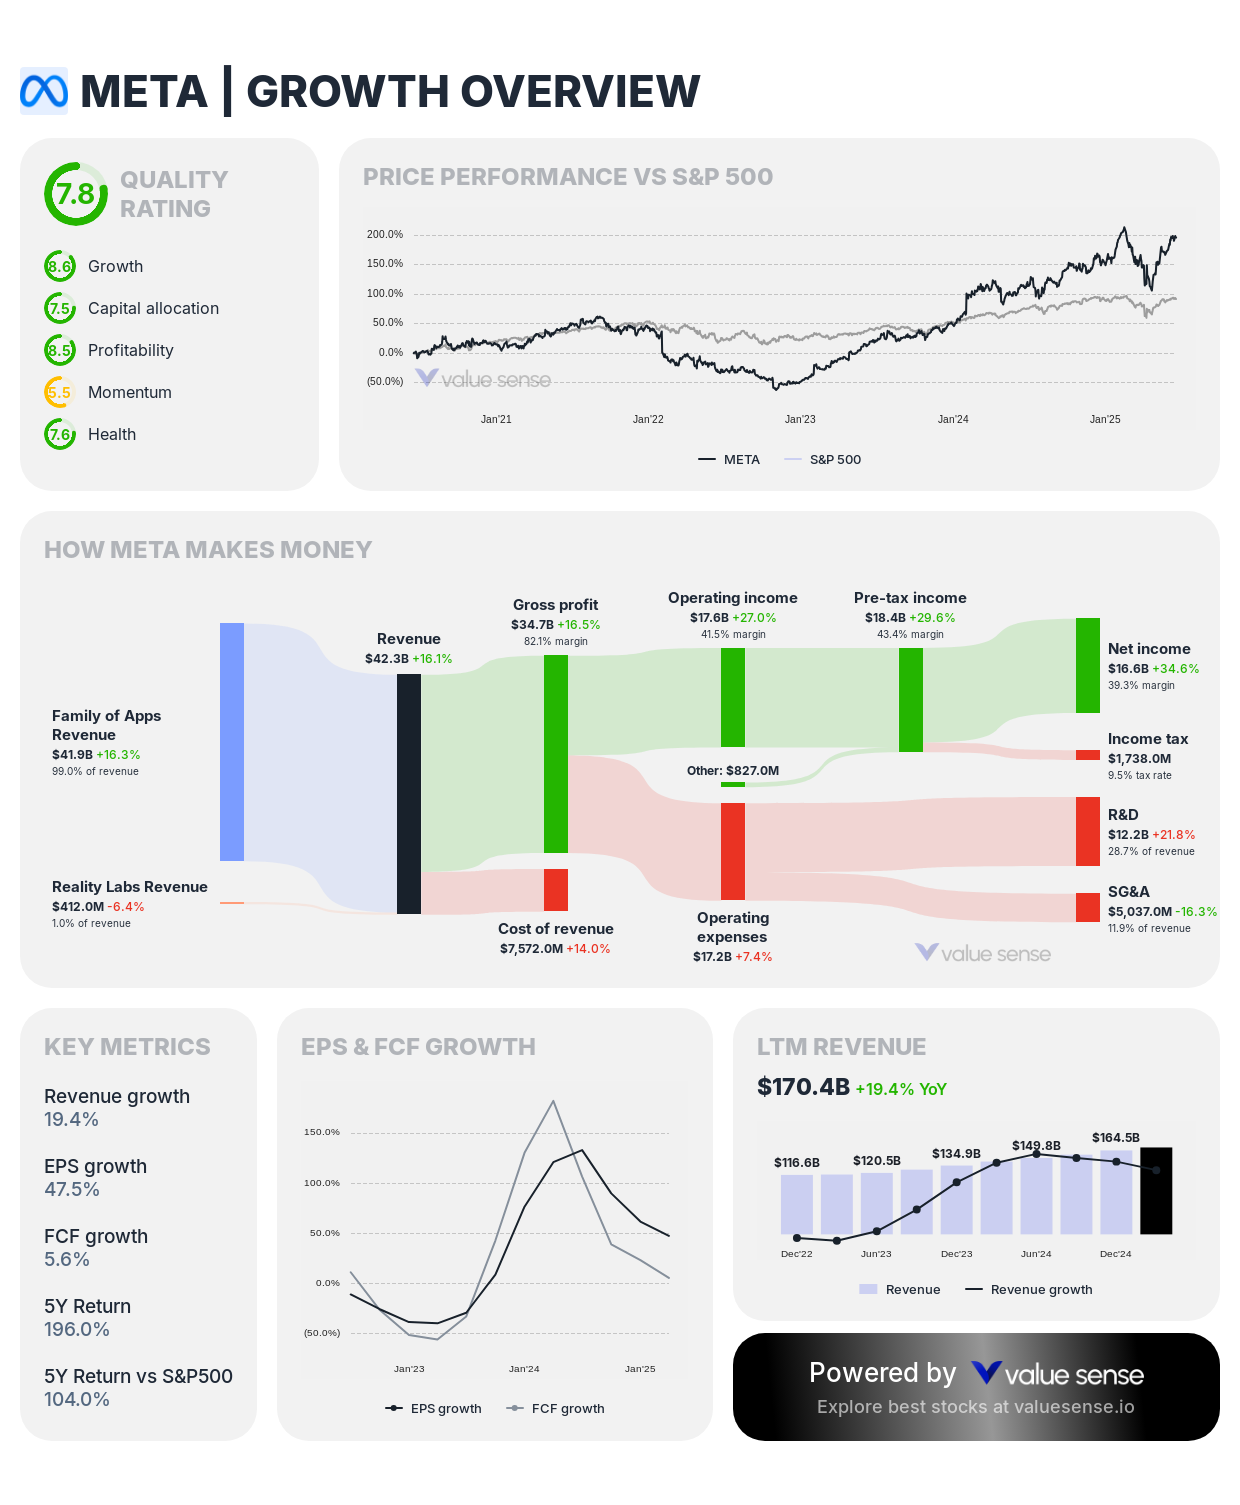
- Growth Score: 8.9 (Exceptional)
- 5-Year EPS CAGR: 29.1%
- 1-Year EPS Growth: 47.5%
- Forward EPS Growth: 2.5%
- 5-Year Revenue CAGR: 18.4%
- 1-Year Revenue Growth: 19.4%
- Forward Revenue Growth: 14.5%
Investment Thesis: Meta demonstrates substantial earnings growth with 29.1% five-year EPS CAGR and exceptional growth score of 8.9, reflecting the social media leader's successful operational efficiency improvements while maintaining user engagement across its platform ecosystem. The company's advertising optimization and cost management drive exceptional profit expansion.
Earnings Growth Drivers: Meta's earnings growth stems from its dominant social media platforms (Facebook, Instagram, WhatsApp), advertising technology improvements, and operational efficiency initiatives. The company's massive user base and data advantages create pricing power in digital advertising that translates directly into profit expansion.
7. Broadcom Inc. (AVGO) - 20.6% EPS CAGR
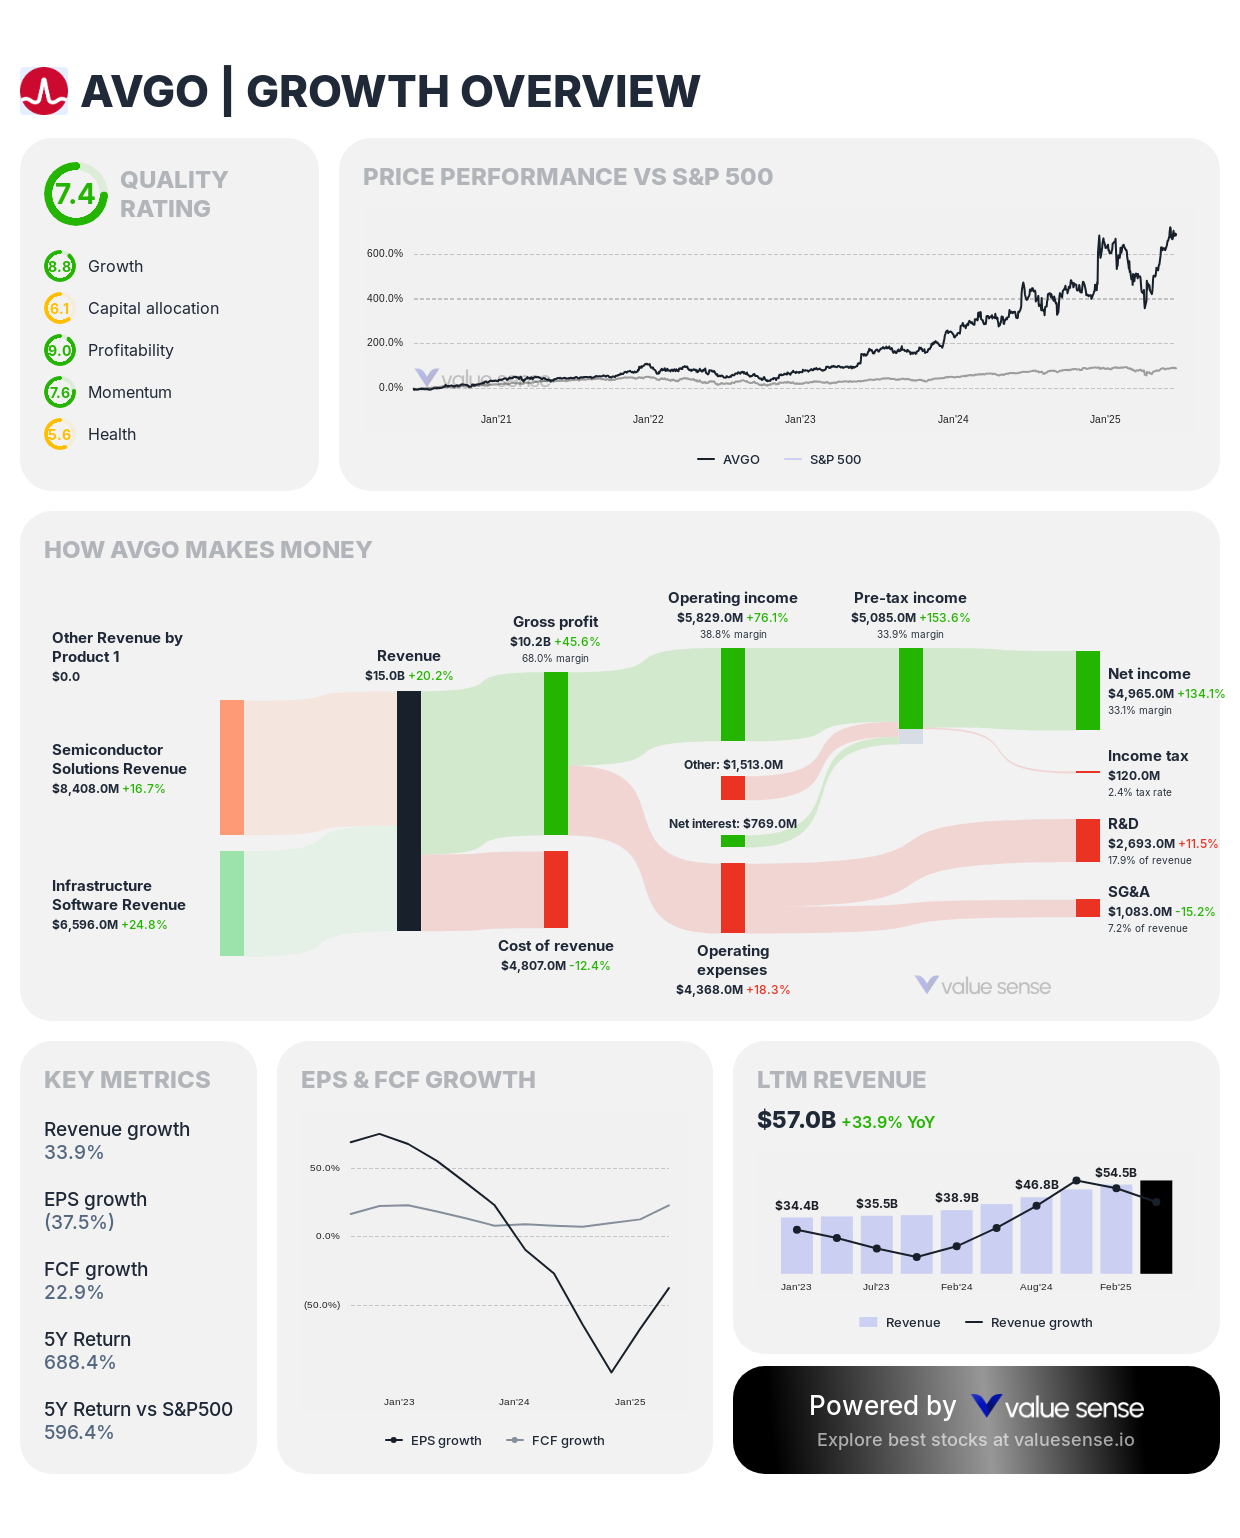
- Growth Score: 8.1 (Exceptional)
- 5-Year EPS CAGR: 20.6%
- 1-Year EPS Growth: (37.5%)
- Forward EPS Growth: 394.7%
- 5-Year Revenue CAGR: 20.0%
- 1-Year Revenue Growth: 33.9%
- Forward Revenue Growth: 20.6%
Investment Thesis: Broadcom achieves consistent earnings growth with 20.6% five-year EPS CAGR and exceptional forward guidance of 394.7% EPS growth, reflecting the semiconductor company's strategic acquisitions and focus on mission-critical applications. The company's diversified portfolio and pricing power create sustained profit expansion opportunities.
Earnings Growth Drivers: Broadcom's earnings growth reflects strategic acquisitions expanding addressable markets, focus on high-margin software and infrastructure applications, and pricing power in essential technology components. The company's acquisition strategy successfully integrates complementary businesses while expanding profit margins.
8. Microsoft Corporation (MSFT) - 16.5% EPS CAGR
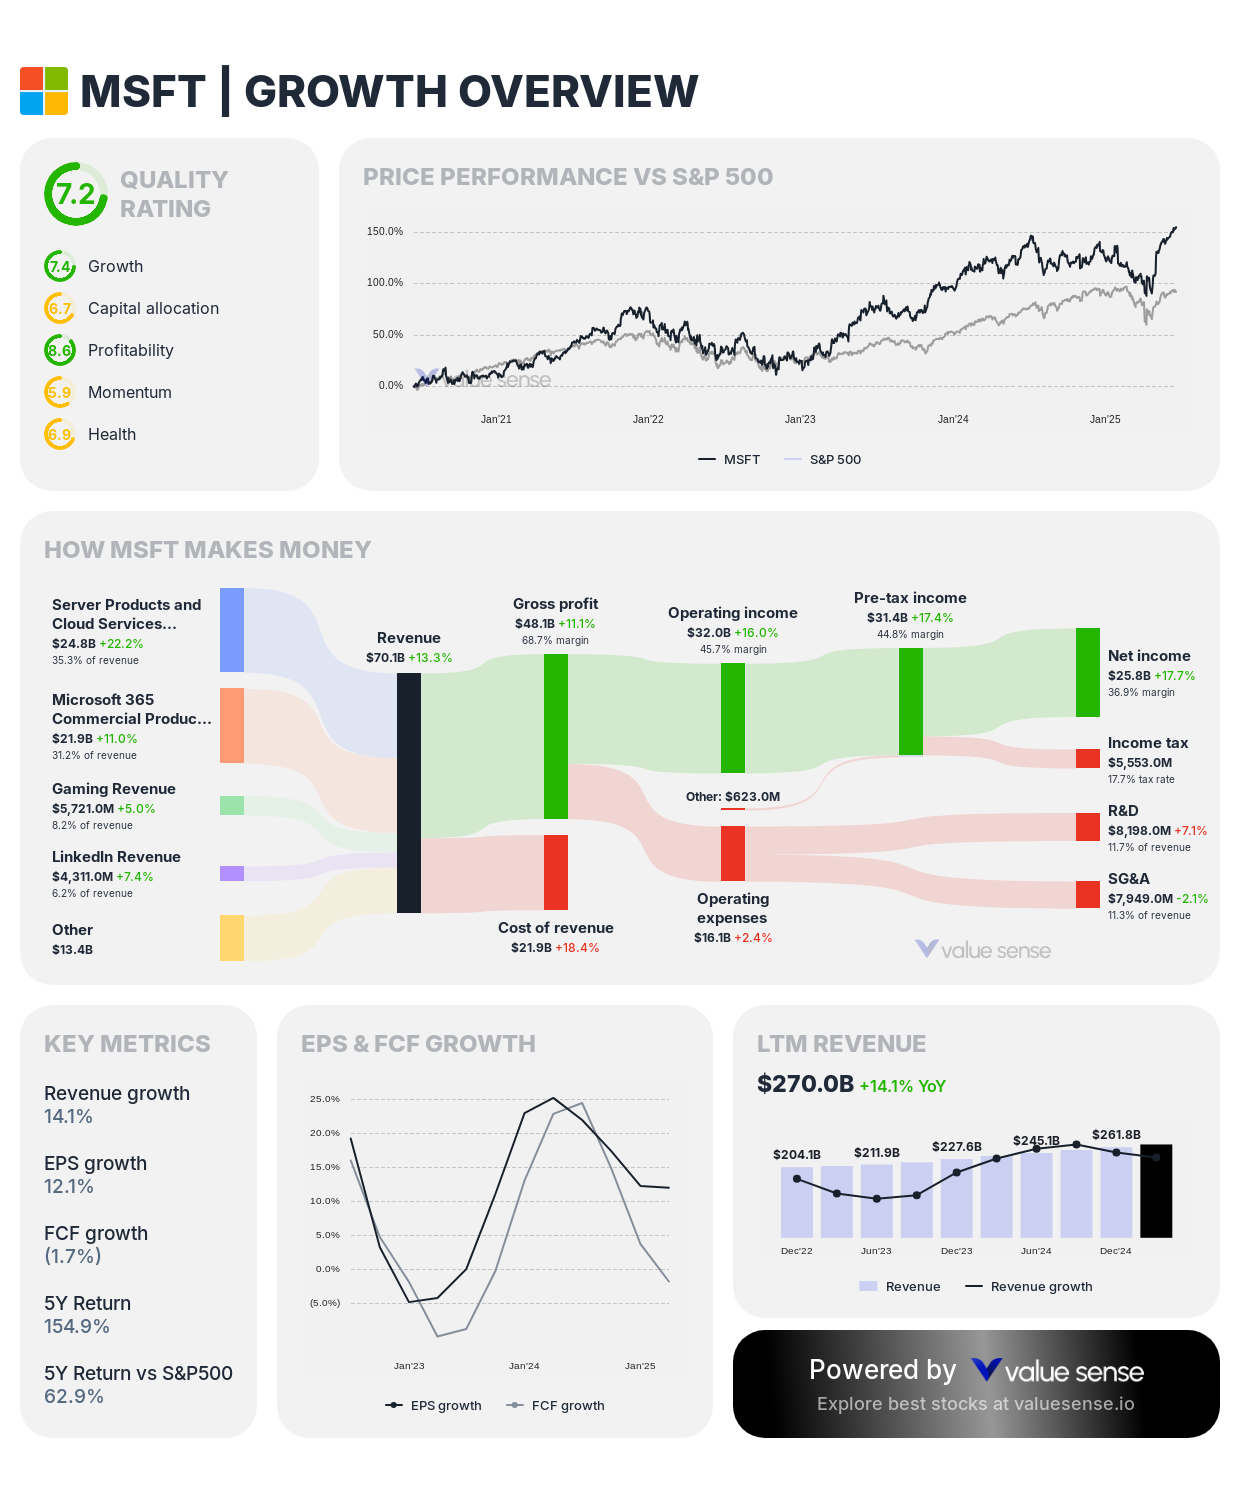
- Growth Score: 7.4 (Strong)
- 5-Year EPS CAGR: 16.5%
- 1-Year EPS Growth: 12.1%
- Forward EPS Growth: 10.9%
- 5-Year Revenue CAGR: 14.3%
- 1-Year Revenue Growth: 14.1%
- Forward Revenue Growth: 13.0%
Investment Thesis: Microsoft demonstrates consistent earnings growth with 16.5% five-year EPS CAGR, reflecting the software giant's successful transformation to cloud computing and subscription services. The company's predictable revenue streams and operational leverage create sustainable profit expansion across economic cycles.
Earnings Growth Drivers: Microsoft's earnings growth stems from Azure cloud platform expansion, Office 365 subscription growth, and operational efficiency improvements. The company's enterprise focus and mission-critical software create high switching costs and recurring revenue that translate into predictable profit growth.
9. Eli Lilly and Company (LLY) - 15.6% EPS CAGR
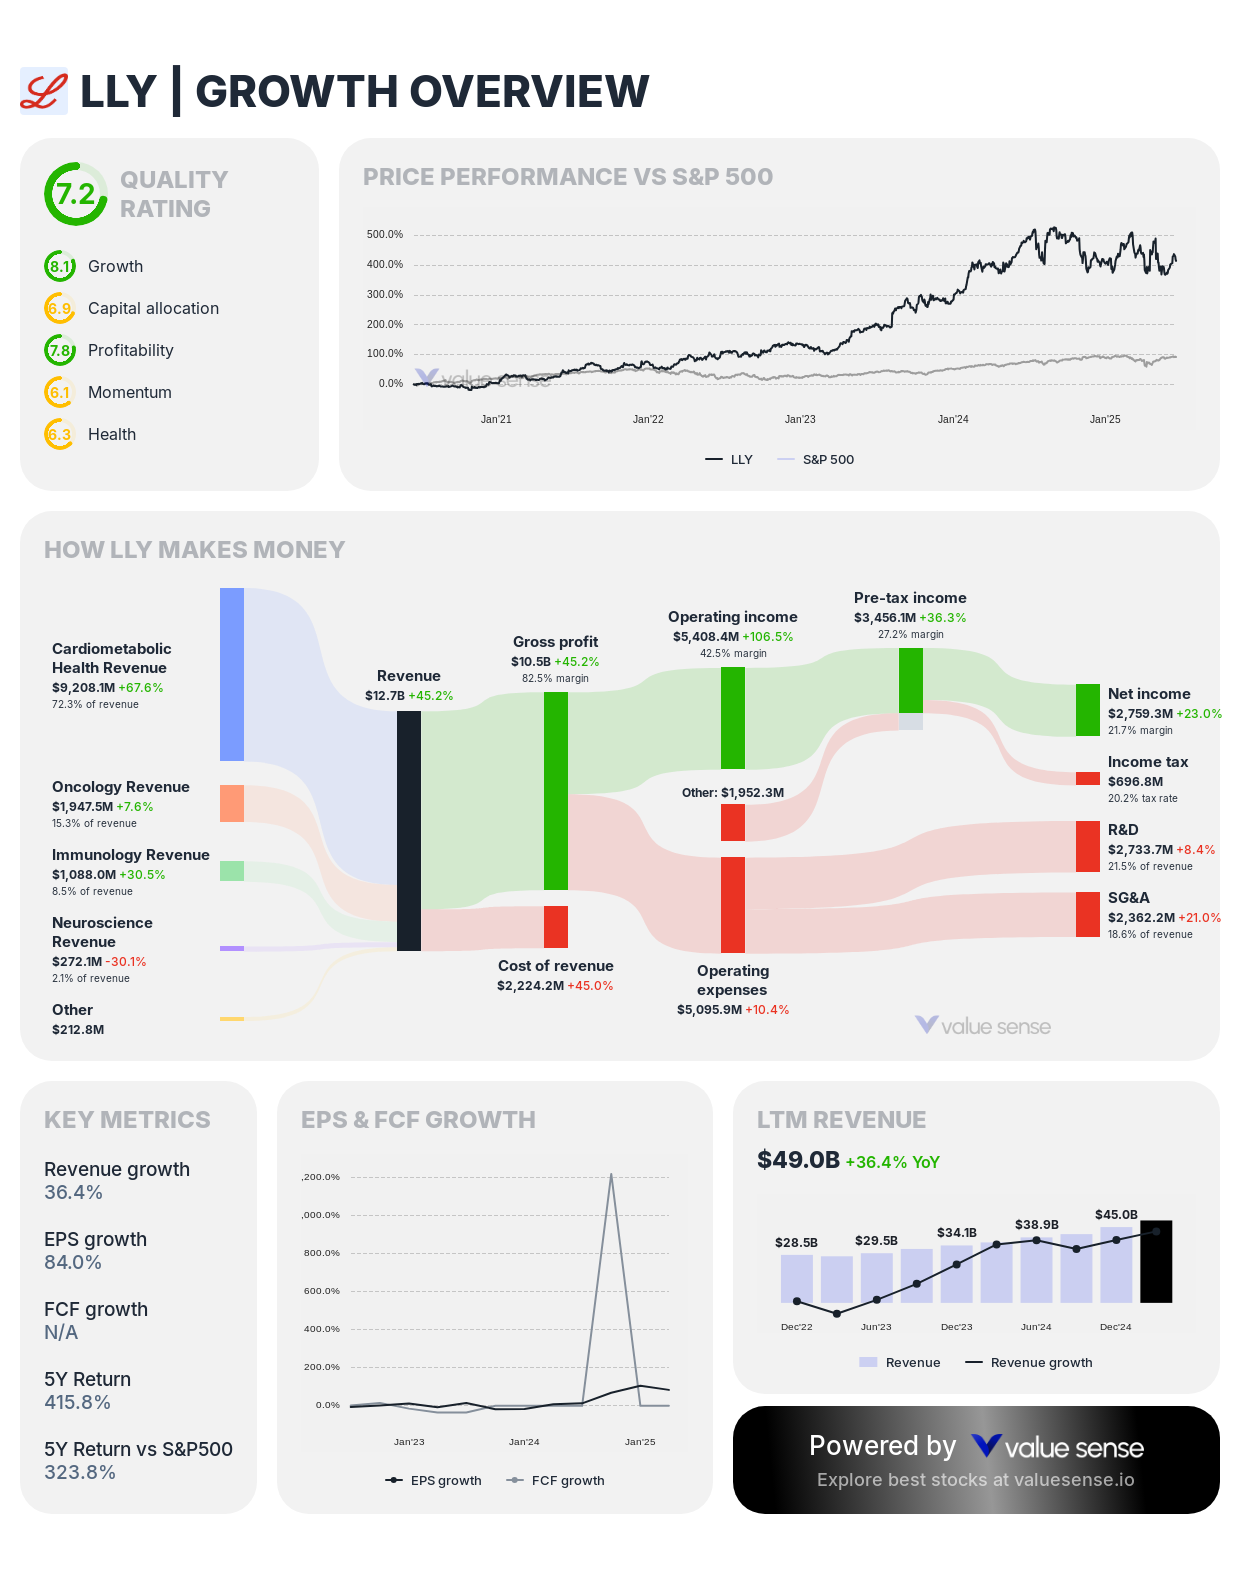
- Growth Score: 8.1 (Exceptional)
- 5-Year EPS CAGR: 15.6%
- 1-Year EPS Growth: 84.0%
- Forward EPS Growth: 94.5%
- 5-Year Revenue CAGR: 16.2%
- 1-Year Revenue Growth: 36.4%
- Forward Revenue Growth: 31.8%
Investment Thesis: Eli Lilly achieves steady earnings growth with 15.6% five-year EPS CAGR and exceptional forward guidance of 94.5% EPS growth, reflecting the pharmaceutical company's breakthrough treatments in diabetes and obesity. The company's innovative drug portfolio creates substantial profit expansion opportunities in rapidly growing therapeutic markets.
Earnings Growth Drivers: Lilly's earnings growth reflects its leadership in diabetes care, revolutionary obesity treatments, and robust pharmaceutical pipeline. The company's breakthrough therapies command premium pricing while addressing massive addressable markets, creating exceptional profit expansion potential.
10. Apple Inc. (AAPL) - 14.9% EPS CAGR
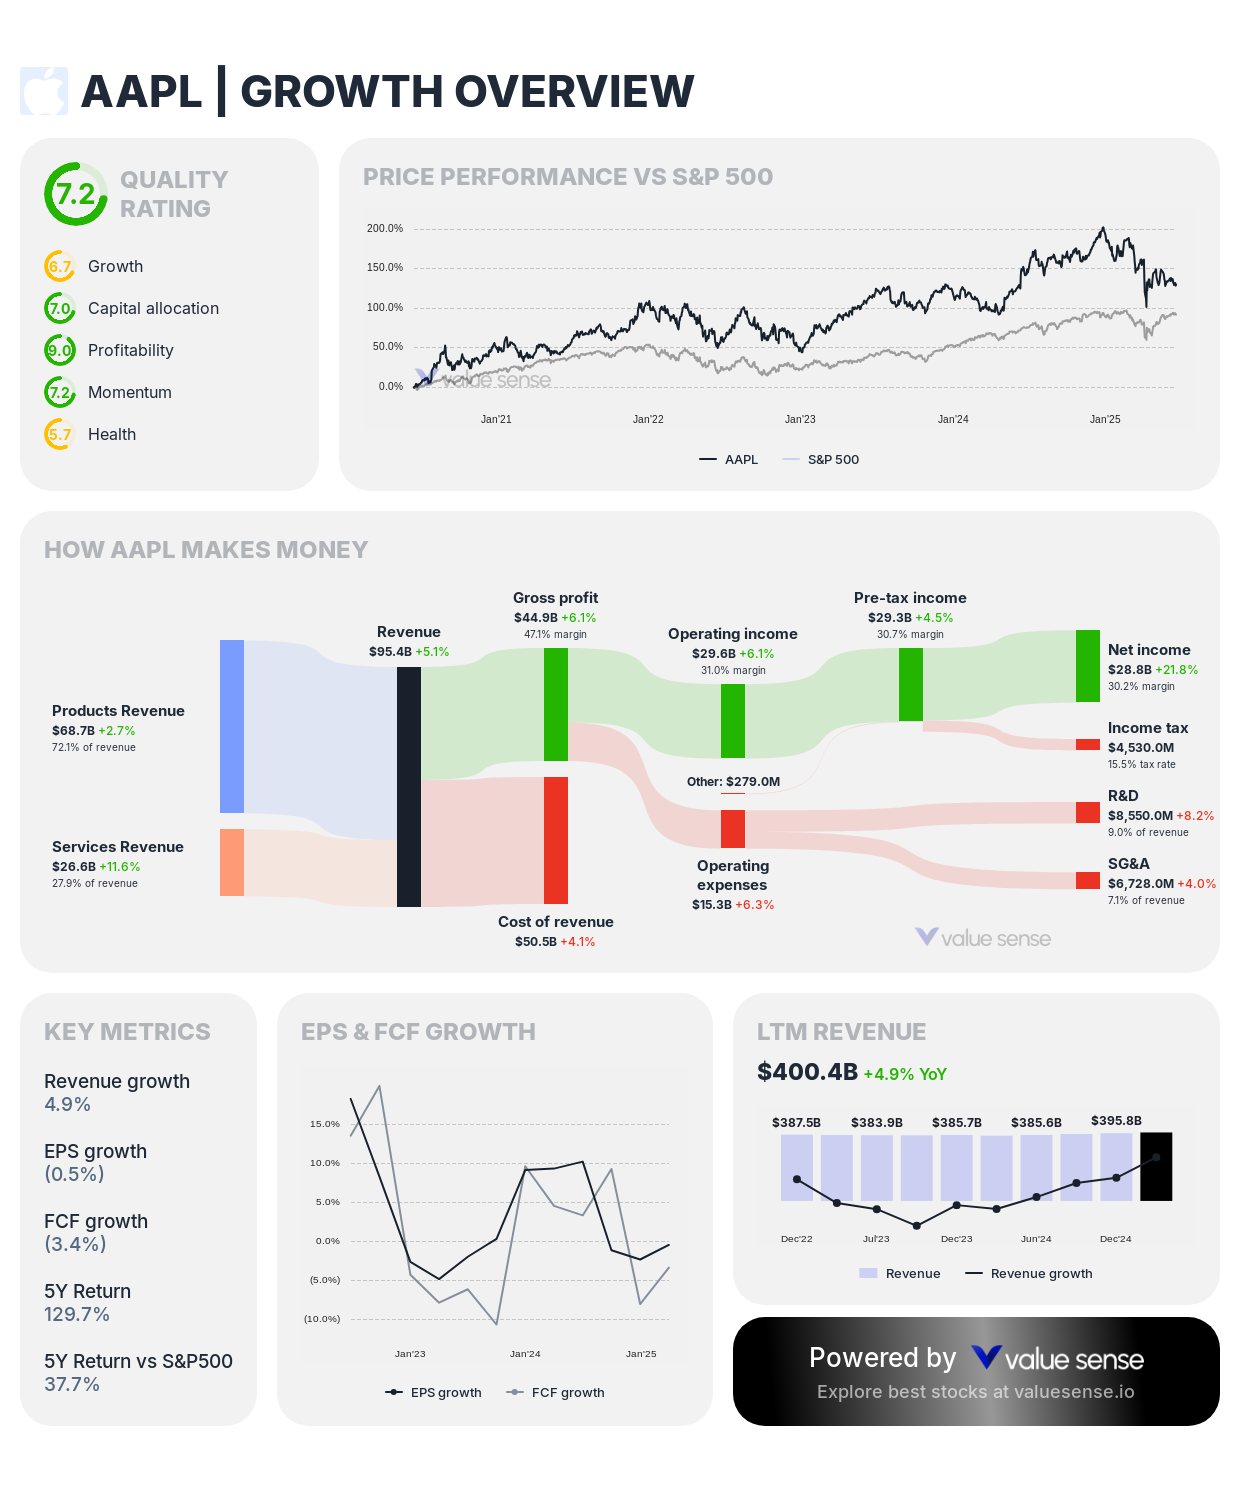
- Growth Score: 6.7 (Strong)
- 5-Year EPS CAGR: 14.9%
- 1-Year EPS Growth: (0.5%)
- Forward EPS Growth: 19.8%
- 5-Year Revenue CAGR: 8.4%
- 1-Year Revenue Growth: 4.9%
- Forward Revenue Growth: 4.6%
Investment Thesis: Apple demonstrates consistent earnings growth with 14.9% five-year EPS CAGR despite its massive scale, reflecting exceptional operational efficiency and capital allocation discipline. The technology giant's integrated ecosystem and premium pricing create profit expansion opportunities even with modest revenue growth.
Earnings Growth Drivers: Apple's earnings growth stems from operational efficiency improvements, services revenue expansion, and strategic capital allocation including share repurchases. The company's premium positioning and ecosystem advantages create profit margins that amplify modest revenue growth into sustained earnings expansion.
11. Walmart Inc. (WMT) - 5.7% EPS CAGR
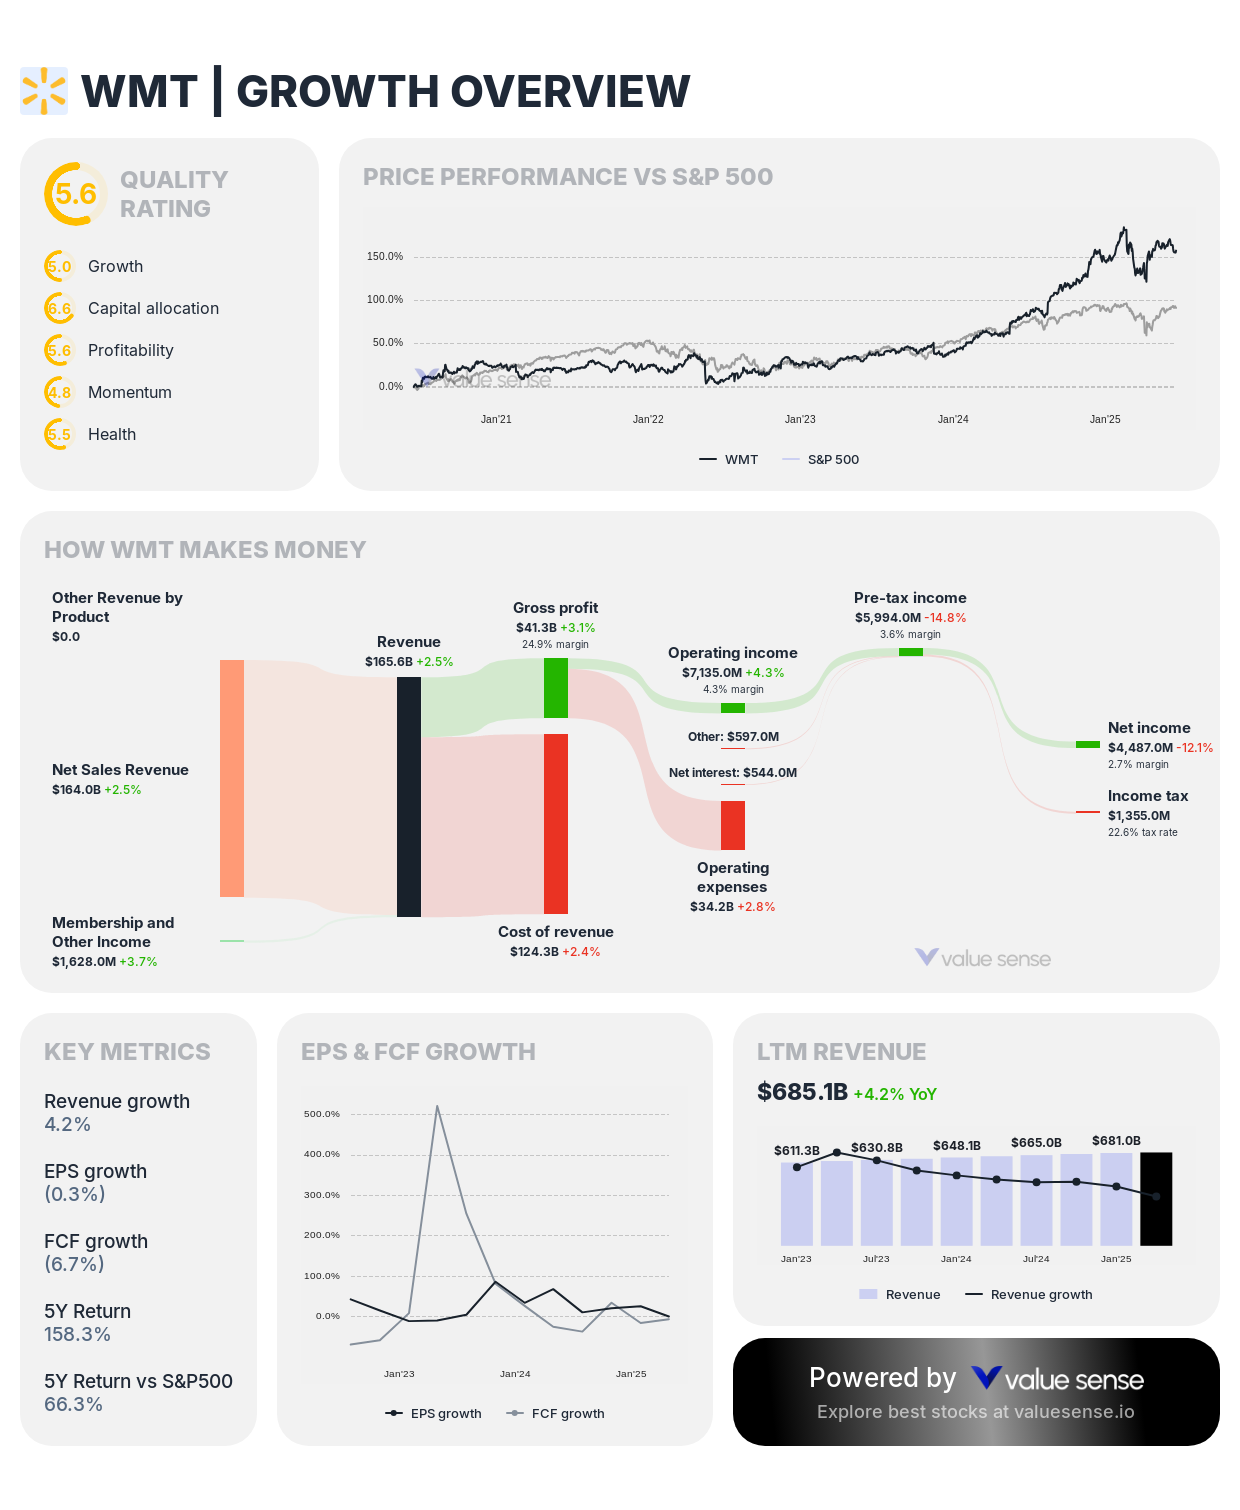
- Growth Score: 6.0 (Moderate)
- 5-Year EPS CAGR: 5.7%
- 1-Year EPS Growth: (0.3%)
- Forward EPS Growth: 9.0%
- 5-Year Revenue CAGR: 5.1%
- 1-Year Revenue Growth: 4.2%
- Forward Revenue Growth: 3.6%
Investment Thesis: Walmart achieves modest but consistent earnings growth with 5.7% five-year EPS CAGR, reflecting the retail giant's operational efficiency improvements and e-commerce expansion. The company's scale advantages and defensive characteristics create sustainable profit expansion despite competitive retail market dynamics.
Earnings Growth Drivers: Walmart's earnings growth reflects operational efficiency initiatives, e-commerce platform development, and supply chain optimization. The company's market leadership and scale advantages create cost efficiencies that translate into profit expansion despite modest revenue growth.
Earnings Growth Investment Strategy
Prioritize Exceptional Growth Scores: Focus on companies with growth scores above 8.0, including NVIDIA (8.9), Alphabet (8.9), Meta (8.9), TSMC (8.1), Broadcom (8.1), and Eli Lilly (8.1). These companies demonstrate exceptional growth potential across multiple metrics including revenue expansion, earnings growth, and forward guidance.
Balance Historical and Forward Growth: Companies showing both strong historical EPS growth and substantial forward guidance like TSMC (47.1% historical, 564.9% forward) and Eli Lilly (15.6% historical, 94.5% forward) offer compelling opportunities for continued profit expansion based on visible business catalysts.
Diversification Across Growth Themes: Spread investments across technology (NVIDIA, Microsoft), healthcare (Eli Lilly), consumer platforms (Meta, Netflix), and infrastructure (TSMC, Broadcom) to capture different growth drivers while reducing concentration risk in any single sector or theme.
Monitor Growth Sustainability: Evaluate whether earnings growth stems from sustainable competitive advantages, operational improvements, or cyclical factors. Companies with strong competitive moats and recurring revenue models typically demonstrate more predictable earnings expansion over extended periods.
Understanding Our Growth Score Methodology
Our proprietary Growth Score evaluates companies across multiple dimensions to identify exceptional growth potential:
Revenue Growth Assessment (40% Weight):
- Historical revenue growth consistency and sustainability across multiple time periods
- Year-over-year revenue expansion momentum indicating recent business acceleration
- Forward revenue growth expectations incorporating management guidance and analyst consensus
Earnings Growth Evaluation (40% Weight):
- EPS compound annual growth rate demonstrating sustained profit expansion capability
- Recent earnings momentum and operational leverage across business cycles
- Forward earnings guidance and market expectations for continued profitability growth
Operational Efficiency Analysis (20% Weight):
- Margin expansion and operational leverage demonstration across revenue growth
- Cash flow conversion and capital allocation effectiveness
- Competitive positioning and market share trends supporting sustainable advantages
Key Takeaways for Earnings Growth Investors
✅ Exceptional Leaders: NVIDIA (87.4% EPS CAGR) and TSMC (47.1% EPS CAGR) offer extraordinary earnings expansion
✅ Growth Score Excellence: Companies with 8.0+ growth scores demonstrate exceptional potential across multiple metrics
✅ Forward Momentum: TSMC (564.9%) and Broadcom (394.7%) show exceptional forward EPS growth guidance
✅ Diversified Opportunities: Strong earnings growth spans technology, healthcare, consumer platforms, and retail sectors
✅ Sustainable Models: Companies with competitive moats and recurring revenue demonstrate more predictable growth
Explore More Investment Opportunities

For investors seeking undervalued companies with high fundamental quality, our analytics team provides curated stock lists:
📌 50 Undervalued Stocks (Best overall value plays for 2025)
📌 50 Undervalued Dividend Stocks (For income-focused investors)
📌 50 Undervalued Growth Stocks (High-growth potential with strong fundamentals)
🔍 Check out these stocks on the Value Sense platform for free!
More Articles You Might Like
📖 11 Best High Free Cash Flow Stocks
📖 10 Best Undervalued Dividend Stocks
📖 9 Best DCF Undervalued Stocks
FAQ About Earnings Growth Investing
What makes 5-year EPS CAGR a reliable indicator of earnings growth quality?
Five-year EPS compound annual growth rate provides a comprehensive view of earnings expansion that smooths out quarterly volatility and captures performance through different economic cycles. Companies like NVIDIA (87.4% EPS CAGR) and TSMC (47.1% EPS CAGR) demonstrate sustained profit expansion capability across multiple years, indicating strong business fundamentals rather than temporary factors. This timeframe captures both growth and recession periods, providing investors with confidence that earnings growth reflects genuine competitive advantages and operational excellence rather than cyclical benefits.
Why do some companies show strong historical EPS growth but modest forward guidance?
Companies may show conservative forward guidance due to economic uncertainty, business model transitions, or management's preference for underpromising and overdelivering. Apple shows 14.9% historical EPS CAGR with 19.8% forward growth due to management's conservative guidance approach despite strong fundamentals. Conversely, companies like TSMC with 564.9% forward EPS growth may be experiencing accelerating business momentum from AI demand that exceeds historical patterns. Investors should analyze business fundamentals to determine whether forward guidance reflects genuine limitations or conservative management approaches.
How important are growth scores compared to absolute EPS growth rates?
Growth scores provide comprehensive evaluation across revenue growth, earnings expansion, and forward momentum, offering more balanced assessment than absolute EPS growth rates alone. Companies like Alphabet and Meta achieve 8.9 growth scores despite lower absolute EPS growth than NVIDIA because they demonstrate consistent performance across multiple growth metrics. High growth scores indicate companies with sustainable competitive advantages and diversified growth drivers, while high absolute EPS growth may reflect temporary factors or single-product success that may not persist over time.
What sectors typically provide the most sustainable earnings growth opportunities?
Technology and healthcare sectors frequently demonstrate the most sustainable earnings growth due to innovation capabilities, competitive moats, and expanding addressable markets. Technology companies like Microsoft and Alphabet benefit from recurring revenue models and network effects, while healthcare companies like Eli Lilly benefit from patent protection and essential demand. However, sustainable earnings growth ultimately depends on individual company competitive advantages, market positioning, and execution capability rather than sector membership alone.
How should investors balance high-growth companies with more mature, steady growers?
Successful earnings growth investing typically combines high-growth companies with exceptional potential alongside mature companies providing steady, predictable expansion. High-growth companies like NVIDIA and TSMC offer substantial upside potential but with greater volatility, while steady growers like Microsoft and Apple provide more predictable returns with lower risk. The optimal balance depends on investment timeline, risk tolerance, and portfolio objectives, with younger investors typically able to emphasize higher-growth opportunities while conservative investors may prefer steady, predictable earnings expansion.
Important Note on Forward Guidance: Forward EPS growth estimates incorporate analyst consensus and management guidance, which may change based on business performance, economic conditions, and strategic developments. Exceptional forward growth rates like TSMC's 564.9% often reflect specific business catalysts or recovery from temporary challenges rather than sustainable long-term growth rates. Investors should analyze underlying business fundamentals and competitive positioning when evaluating forward growth expectations.
Disclaimer: This analysis is for informational purposes only and should not be considered personalized investment advice. Historical earnings growth does not guarantee future performance, and forward guidance represents estimates that may change with new information. Always conduct thorough research and consult with qualified financial advisors before making investment decisions.