ValueSense Intrinsic Value Tools - Earnings Power Value (EPV)
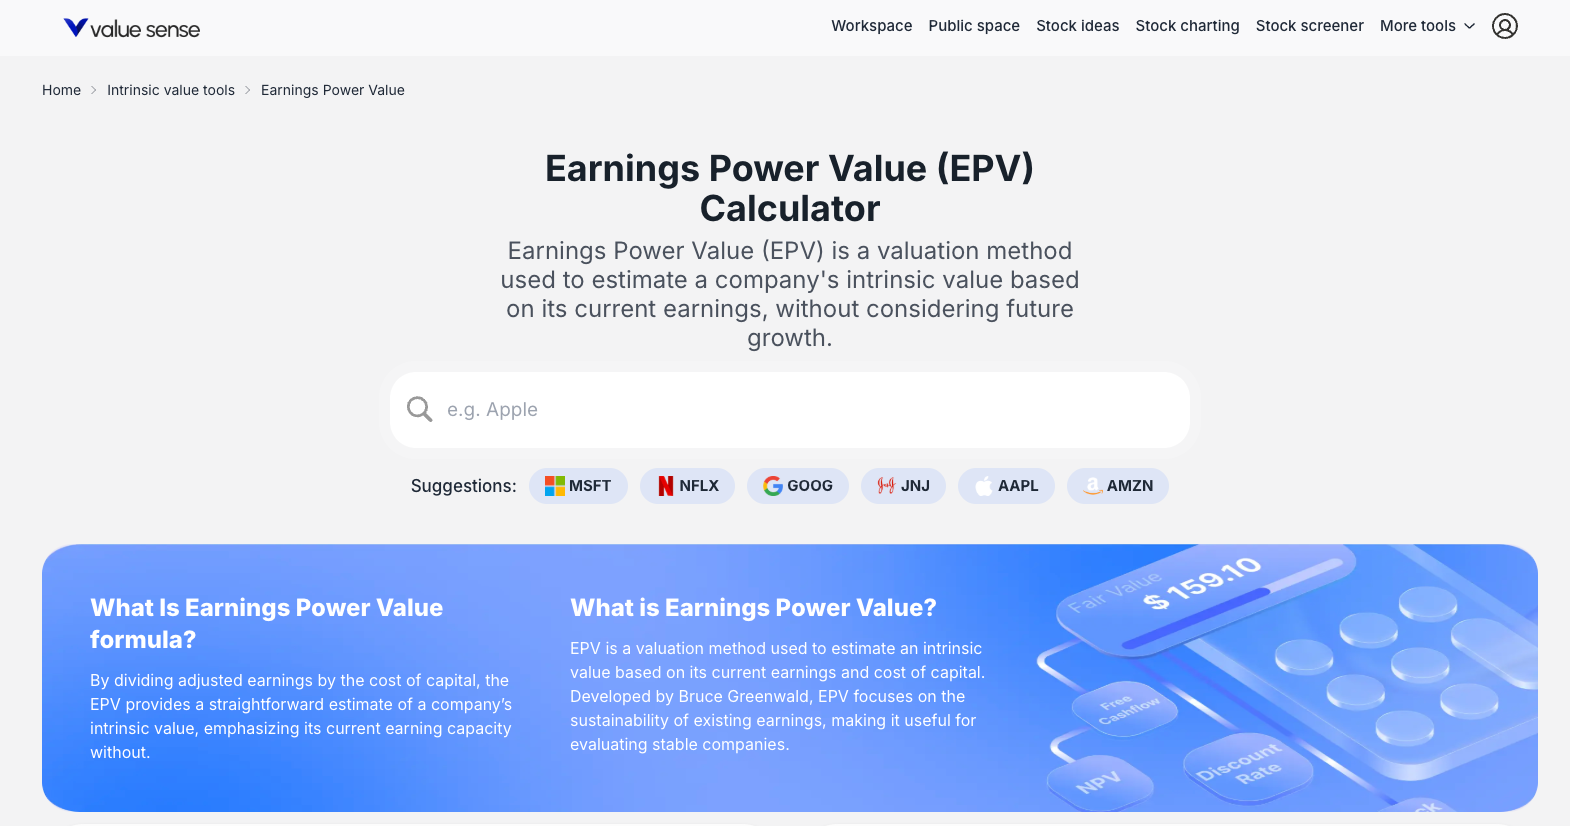
The Earnings Power Value (EPV) calculator is a conservative valuation method developed by Bruce Greenwald that estimates a company's intrinsic value based solely on its current, sustainable earnings without factoring in any future growth. This approach helps investors understand what a company is worth today, separate from the market's expectations for future growth.
Accessing the EPV Calculator
From the Value Investing Tools Dashboard
- Navigate to the main "Value Investing tools" page
- Locate the "Earnings Power Value" card
- Click "Find out more →" to access the EPV calculator landing page
- Search for a company (e.g., "Apple") or click on suggested tickers (MSFT, NFLX, AAPL)

What the EPV Method Does
Core Purpose
EPV determines the value of a company's existing operations as if they were a perpetual, non-growing stream of earnings. It answers the fundamental question: "What is this company worth based purely on its current earnings power?"
Key Philosophy
- Conservative Approach: Deliberately ignores growth to provide a baseline valuation
- Current Value Focus: Values only what the company can earn today
- Growth Separation: Distinguishes between current value and growth expectations
- Stability Assessment: Particularly useful for evaluating stable, mature companies
EPV Methodology
Core Formula
EPV = Adjusted NOPAT / Discount Rate
Key Components
- NOPAT: Net Operating Profit After Tax (sustainable earnings measure)
- Discount Rate: Cost of capital used to discount earnings (e.g., 8.3% for MSFT)
- Enterprise Value (EV): Current market valuation of the entire company
- Market-implied Value of Growth (MIVG): EV - EPV (growth premium)
Automated Calculation
- No manual data input required
- System automatically fetches financial data
- Performs all calculations using current market data
Key Outputs and Results
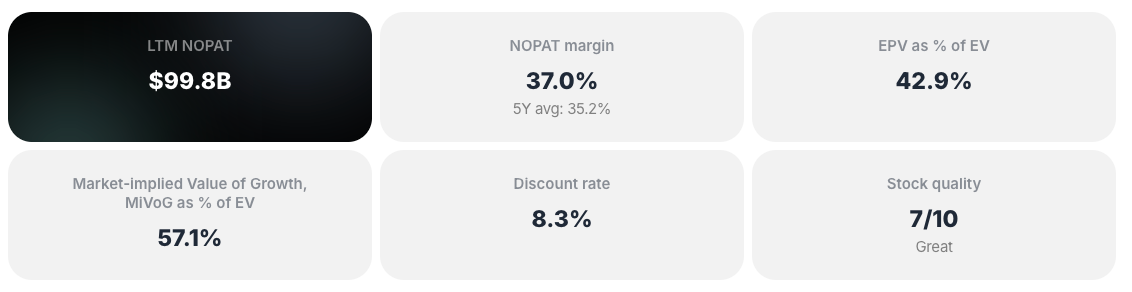
At-a-Glance Summary Dashboard
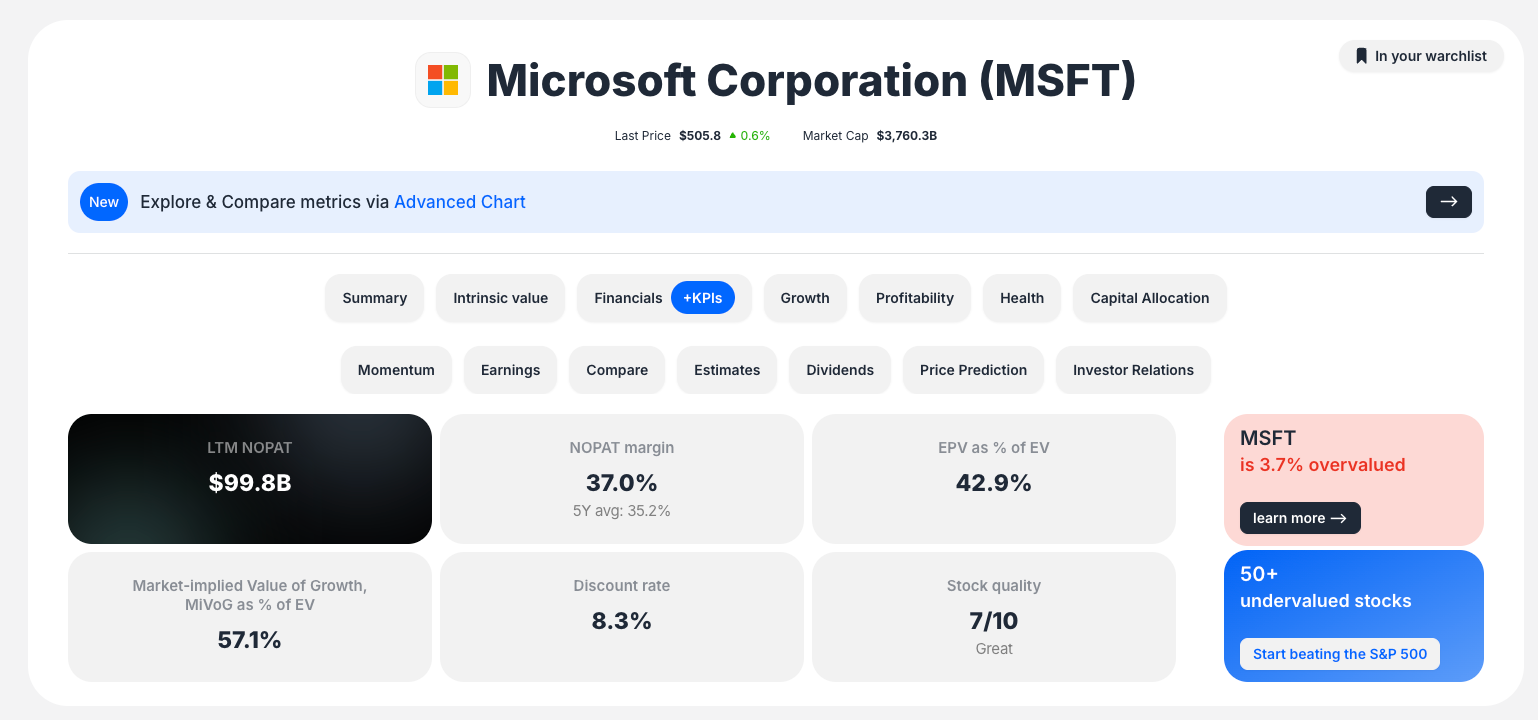
- Valuation Verdict: Clear over/undervaluation assessment (e.g., "MSFT is 3.7% overvalued")
- EPV as % of EV: Core metric showing current earnings value relative to market price
- MIVG as % of EV: Portion of value attributed to future growth expectations
- Key Metrics: LTM NOPAT, NOPAT margin, discount rate, stock quality score
Historical Data Table
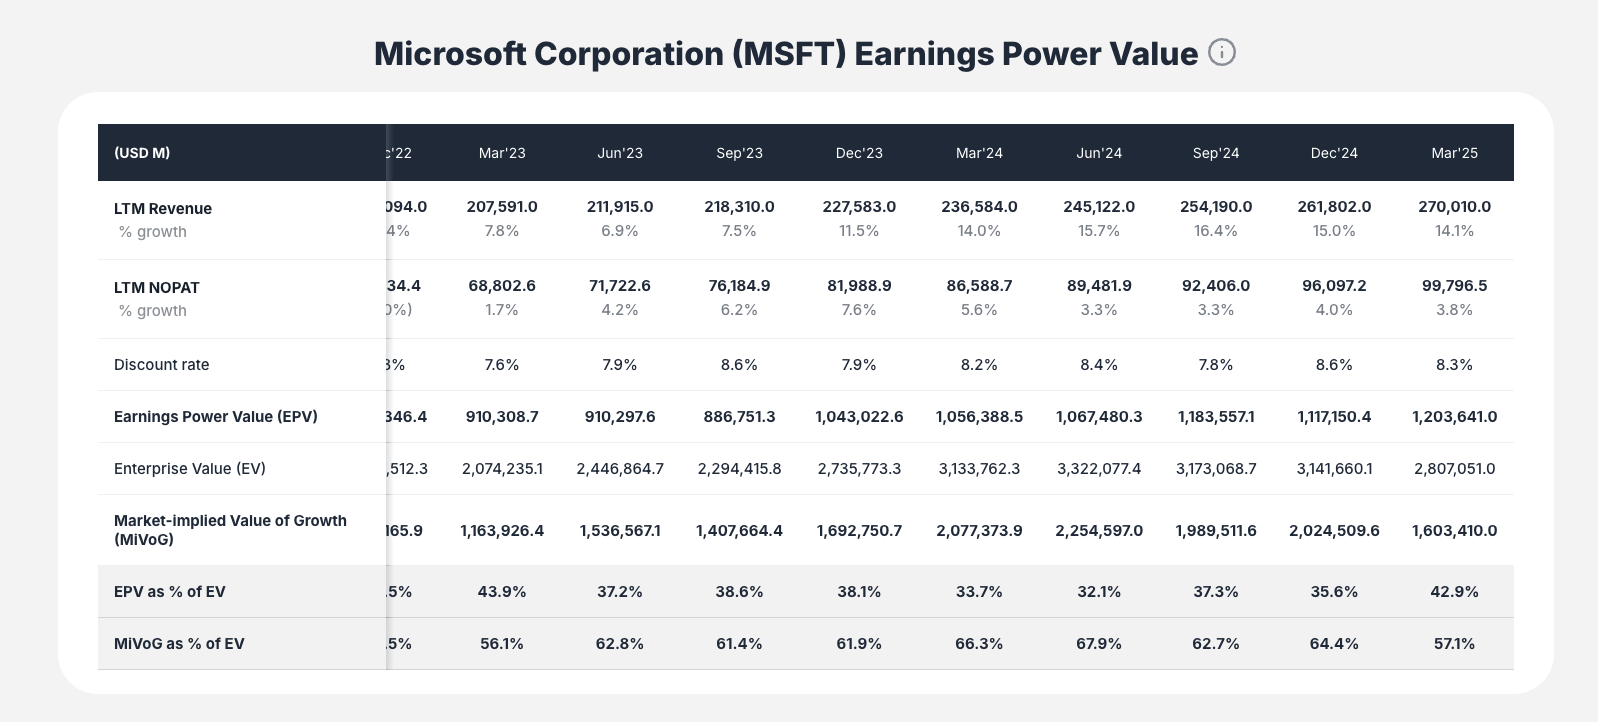
- Quarterly and TTM values for key components
- Historical EPV calculations
- Enterprise Value trends
- Ratio analysis over time
NOPAT Analysis Chart
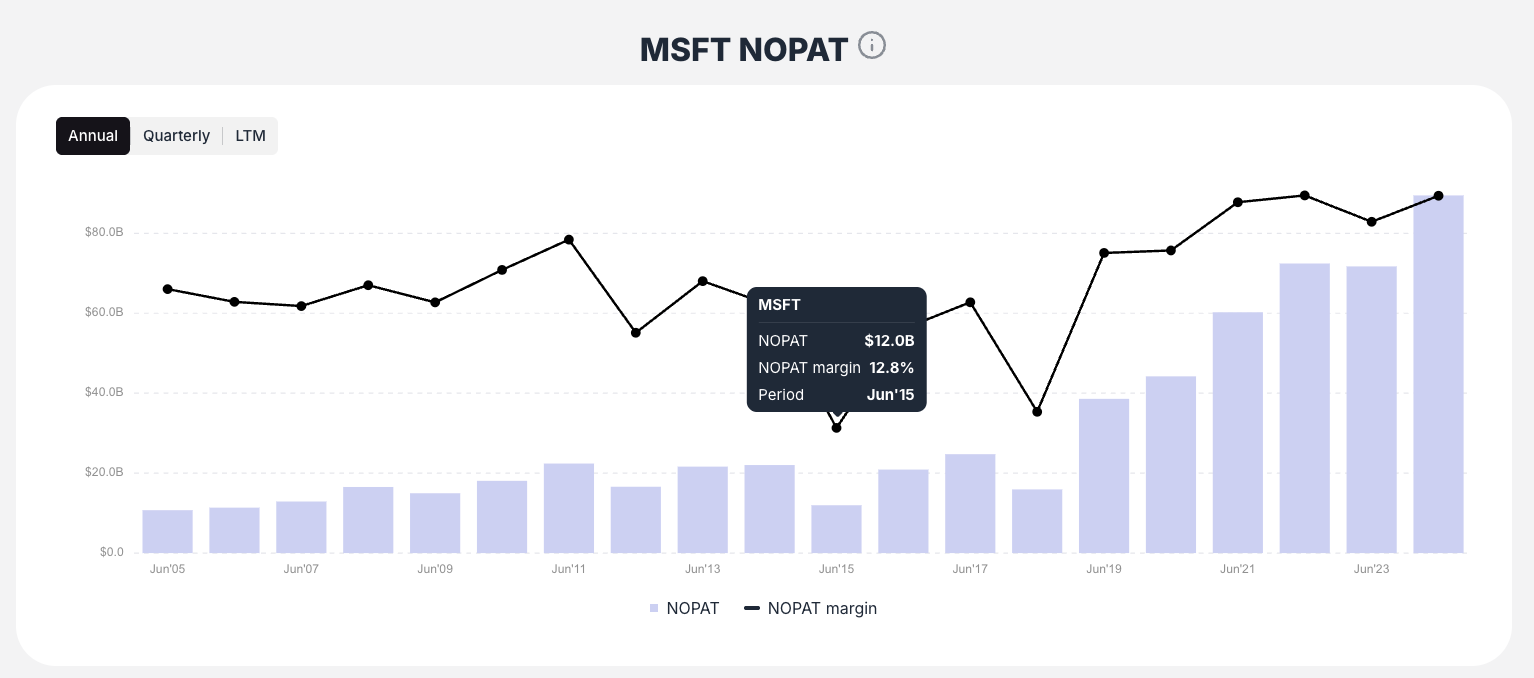
- Historical NOPAT (bar chart)
- NOPAT margin trends (line chart)
- Operational efficiency visualization
EPV and Enterprise Value Breakdown
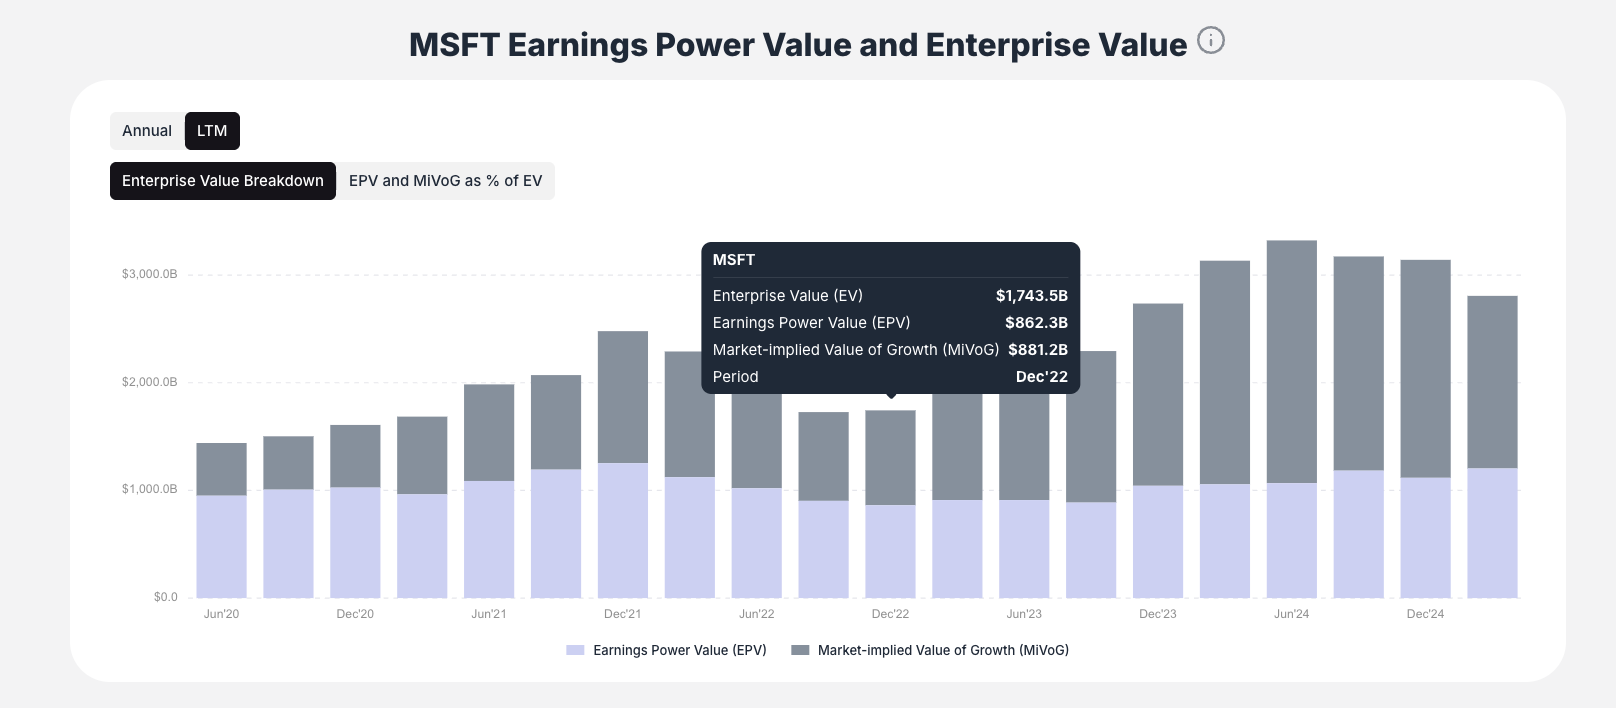
- Enterprise Value Breakdown: Stacked bar chart showing EV composition
- Earnings Power Value (light purple)
- Market-implied Value of Growth (dark gray)
- Toggle View: Switch to percentage trend lines
- EPV as % of EV (black line)
- MIVG as % of EV (green line)
Peer Comparison Table
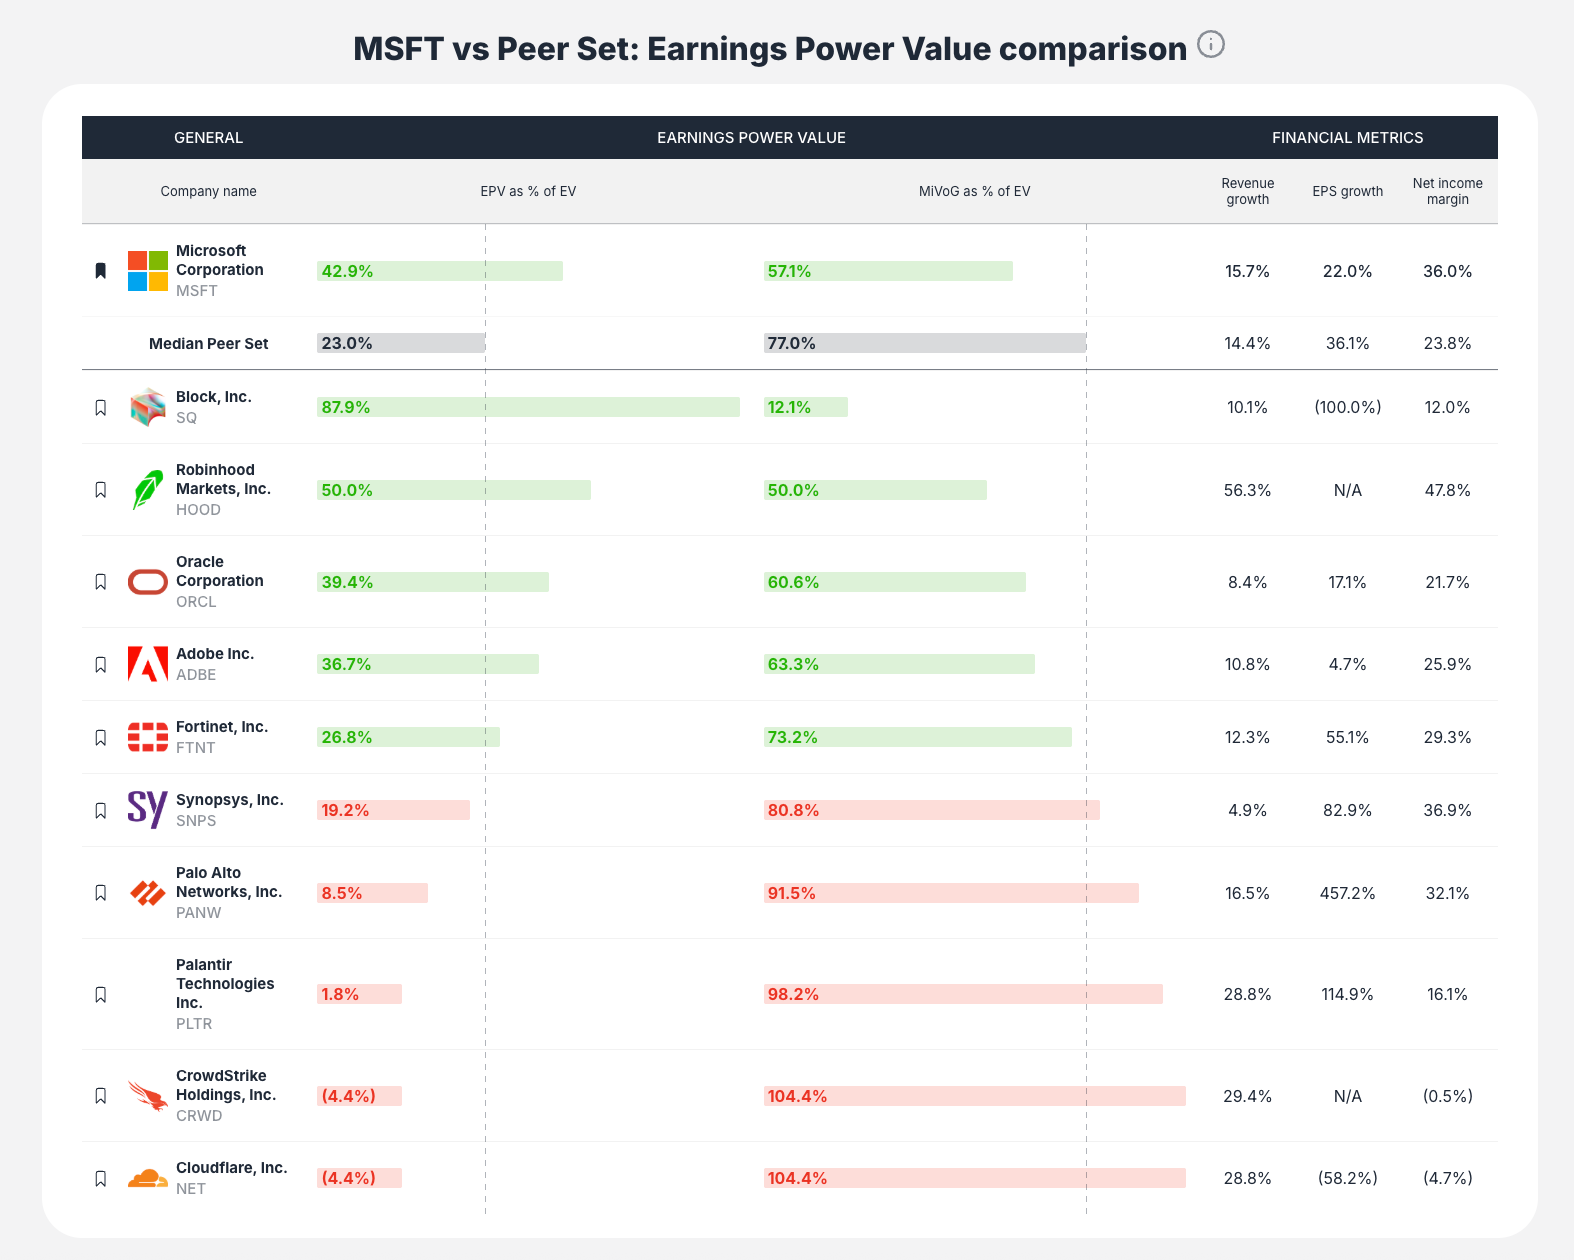
- Benchmark against industry competitors
- EPV as % of EV across peer group
- Revenue growth and profitability comparisons
- Median peer set for context
Interactive Features
Hover for Details
- Mouse over charts to see specific data points
- Historical values and trends
- Precise metric values for any time period
Toggle Chart Views
- Switch between stacked bar chart and percentage trend lines
- Different perspectives on the same data
- Enhanced analytical capabilities
Seamless Navigation
- Single-page scrolling design
- Smooth transitions between sections
- Integrated data exploration
How to Interpret EPV Results
Primary Interpretation Metrics
EPV as % of EV
- >100%: Current earnings power exceeds total enterprise value (potentially undervalued)
- <100%: Market values growth expectations above current earnings
- High percentage: Conservative, earnings-based value proposition
MIVG as % of EV
- High percentage: Market betting heavily on future growth
- Low percentage: Valuation primarily based on current earnings
- Risk indicator: Higher MIVG = higher risk if growth fails to materialize
Contextual Analysis
- Historical Trends: Use charts to see if growth dependency is increasing/decreasing
- Peer Comparison: Compare MIVG percentages within industry context
- Quality Assessment: Consider stock quality score alongside EPV metrics
Key Workflow Steps
Step 1: Access and Select
Navigate to EPV tool and choose your target company
Step 2: Review Summary Dashboard
- Check valuation verdict (over/undervalued)
- Note EPV as % of EV and MIVG as % of EV
- Review key financial metrics
Step 3: Analyze Historical Trends
- Examine NOPAT chart for earnings sustainability
- Review EPV/EV breakdown chart for valuation composition
- Toggle between different chart views
Step 4: Benchmark Against Peers
- Compare EPV metrics to industry competitors
- Understand relative valuation positioning
- Assess if growth expectations are reasonable
Step 5: Explore Further
- Use integrated tools hub for multi-model analysis
- Access related stock ideas and lists
- Add to watchlist if attractive
Best Practices for Using EPV
Ideal Use Cases
- Mature Companies: Stable businesses with predictable earnings
- Conservative Valuation: When seeking margin of safety
- Growth Risk Assessment: Understanding market growth expectations
- Value Investing: Following Greenwald's disciplined approach
Interpretation Guidelines
- High EPV as % of EV: Look for sustainable competitive advantages
- High MIVG as % of EV: Assess growth probability and sustainability
- Peer Context: Compare within industry for relative attractiveness
- Historical Analysis: Understand trends and cyclical patterns
Key Questions EPV Answers
- "What is this company worth based only on current earnings?"
- Direct answer through EPV calculation
- "How much of the stock price is based on growth expectations?"
- MIVG as % of EV shows growth premium
- "Is the market overpaying for growth?"
- Compare MIVG to realistic growth prospects
- "How does this compare to industry peers?"
- Peer comparison table provides context
- "Are current earnings sustainable?"
- Historical NOPAT trends show earnings stability
Conservative Investment Approach
Margin of Safety
- EPV provides baseline value without growth assumptions
- Helps identify companies trading below intrinsic value
- Conservative foundation for investment decisions
Risk Assessment
- High MIVG percentages indicate growth dependency
- Lower EPV percentages suggest higher risk
- Peer comparison validates industry norms
Long-term Perspective
- Focus on sustainable earnings power
- Understand growth versus value components
- Make informed decisions about growth premiums
The EPV calculator transforms complex valuation analysis into an intuitive tool that separates current value from growth expectations, helping you make more informed investment decisions based on earnings sustainability rather than growth speculation.