
(EBITDA - Capex) to Interest coverage
Welcome to the Value Sense Blog, your resource for insights on the stock market! At Value Sense, we focus on intrinsic value tools and offer stock ideas with undervalued companies. Dive into our research products and learn more about our unique approach at valuesense.io.
Explore diverse stock ideas covering technology, healthcare, and commodities sectors. Our insights are crafted to help investors spot opportunities in undervalued growth stocks, enhancing potential returns. Visit us to see evaluations and in-depth market research.
What is (EBITDA - Capex) to Interest coverage?
(EBITDA - Capex) to Interest coverage compares EBITDA minus capital expenditures to interest expenses, indicating debt service capacity after necessary reinvestments.
How do you interpret (EBITDA - Capex) to Interest coverage?
(EBITDA - Capex) to Interest coverage evaluates the ability to cover interest payments after necessary reinvestments, showing how well the company can meet obligations after capital expenditures.
How to Calculate (EBITDA - Capex) to Interest coverage?
The ratio is calculated by dividing the difference between EBITDA and Capex by the company’s interest expenses.
(EBITDA - Capex) to Interest Coverage = (EBITDA - Capex) / Interest Expenses
where
- EBITDA: Earnings before interest, taxes, depreciation, and amortization.
- Capex: Capital expenditures, or the funds a company uses to acquire or upgrade physical assets.
- Interest Expenses: The total interest paid on a company’s debt.
Why is (EBITDA - Capex) to Interest coverage important?
This metric is crucial because it shows how well a company can cover its debt interest payments from its operational cash flow after essential capital investments. It provides a more conservative view than EBITDA to interest coverage, as it accounts for necessary reinvestment in assets.
How does (EBITDA - Capex) to Interest coverage benefit investors?
This ratio is useful for investors in capital-intensive industries, as it provides insight into how much cash flow remains for debt servicing after the company has reinvested in its operations. A higher ratio suggests stronger financial stability and lower risk of default.
Using (EBITDA - Capex) to Interest coverage to Evaluate Stock Performance
A strong ratio typically correlates with lower financial risk, making the company more attractive to investors. Companies with higher ratios are considered more capable of sustaining growth without jeopardizing their ability to meet debt obligations, which can positively affect stock prices.
FAQ about (EBITDA - Capex) to Interest coverage
What is a Good (EBITDA - Capex) to Interest coverage?
A good ratio depends on the industry, but generally, a ratio above 2 is considered strong. It suggests that the company can cover its interest expenses twice over, even after reinvesting in its operations.
What Is the Difference Between Metric 1 and Metric 2?
EBITDA to Interest Coverage measures the company’s ability to cover interest payments using operating cash flow, while (EBITDA - Capex) to Interest Coverage accounts for capital reinvestments, offering a more conservative view of available cash for debt servicing.
Is it bad to have a negative (EBITDA - Capex) to Interest coverage?
Yes, a negative ratio indicates that the company is spending more on capital expenditures than it generates from operating activities, making it difficult to meet its interest obligations.
What Causes (EBITDA - Capex) to Interest coverage to Increase?
The ratio increases when EBITDA grows, Capex decreases, or interest expenses decline. Improved operational efficiency or reduced debt burden can lead to a higher ratio.
What are the Limitations of (EBITDA - Capex) to Interest coverage?
The ratio does not account for the timing of Capex or interest payments and may not reflect short-term liquidity. Companies with volatile Capex may have fluctuating ratios, making it less reliable in such cases.
When should I not use (EBITDA - Capex) to Interest coverage?
This ratio may not be suitable for companies with minimal capital expenditures or industries where Capex varies significantly year over year, as it could provide misleading insights.
How does (EBITDA - Capex) to Interest coverage compare across industries?
Capital-intensive industries, like manufacturing or utilities, generally have lower ratios due to high Capex, while service-oriented industries with lower Capex typically have higher ratios.
Explore More Investment Opportunities
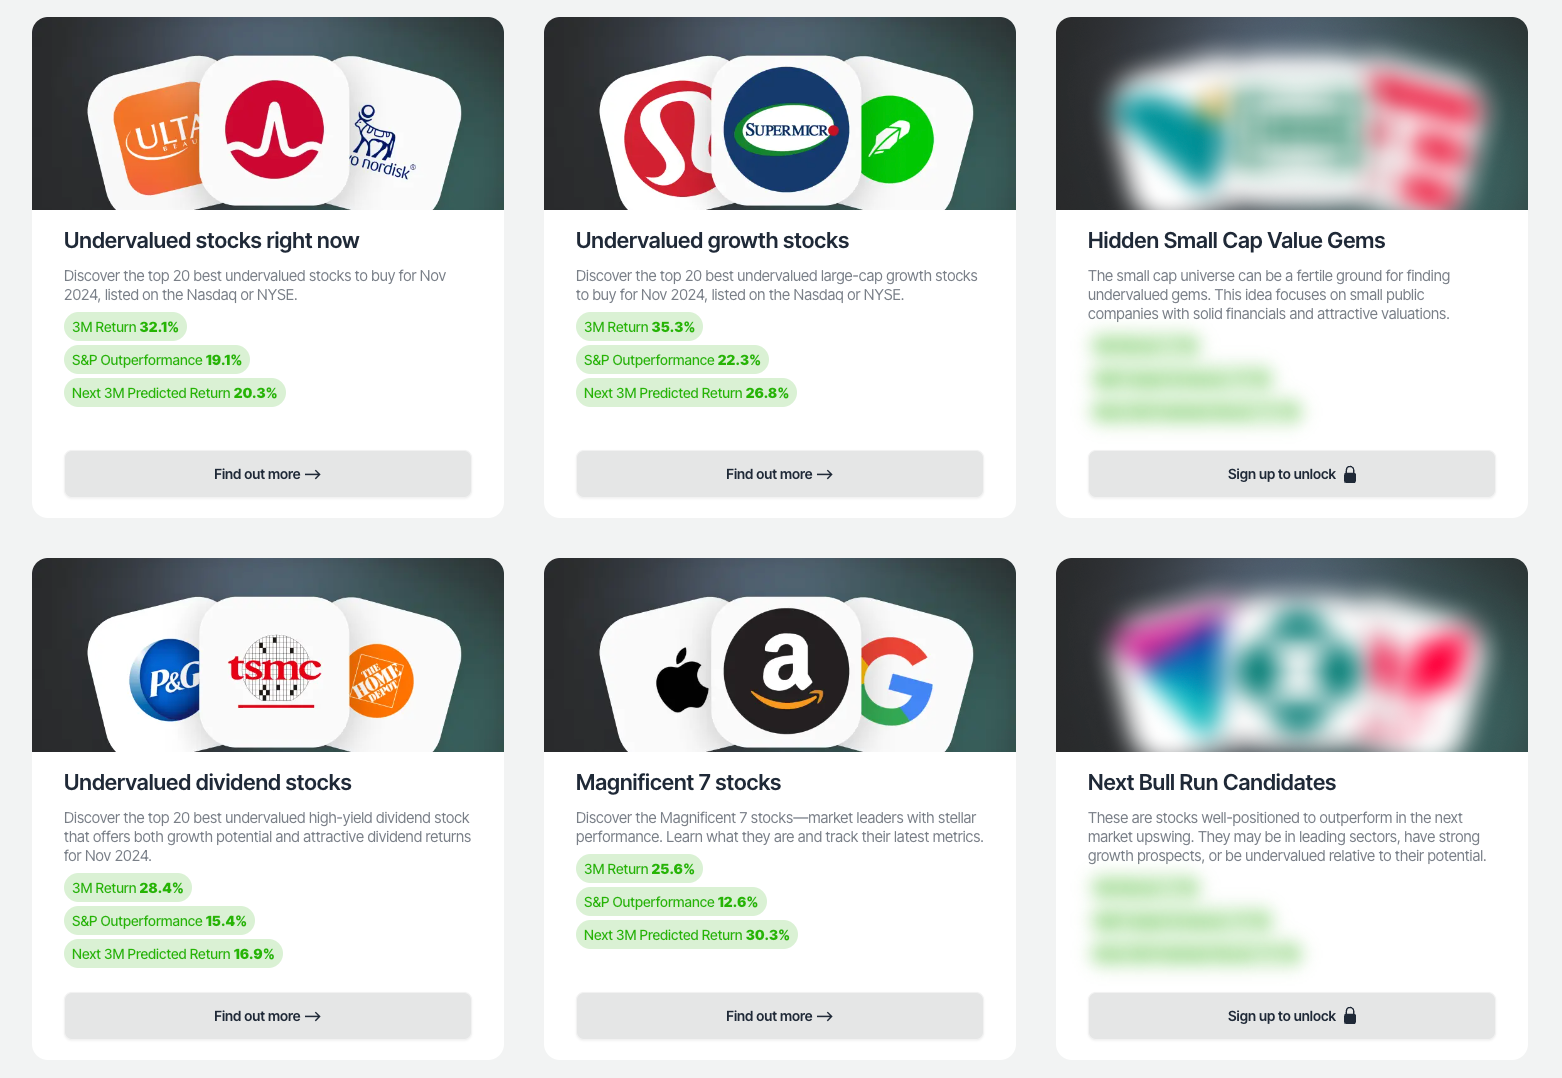
For investors seeking undervalued companies with high fundamental quality, our analytics team provides curated stock lists:
📌 50 Undervalued Stocks (Best overall value plays for 2025)
📌 50 Undervalued Dividend Stocks (For income-focused investors)
📌 50 Undervalued Growth Stocks (High-growth potential with strong fundamentals)
🔍 Check out these stocks on the Value Sense platform for free!