
Frank Sands - Sands Capital Management, Llc Portfolio Q3'2025: Top Holdings & Recent Changes
Welcome to the Value Sense Blog, your resource for insights on the stock market! At Value Sense, we focus on intrinsic value tools and offer stock ideas with undervalued companies. Dive into our research products and learn more about our unique approach at [valuesense.io]
Explore diverse stock ideas covering technology, healthcare, and commodities sectors. Our insights are crafted to help investors spot opportunities in undervalued growth stocks, enhancing potential returns. Visit us to see evaluations and in-depth market research.
Frank Sands of Sands Capital Management continues to showcase his growth-oriented investment philosophy through disciplined portfolio adjustments. His $36.2B portfolio in Q3 2025 reflects a strategic trim in mega-cap tech while boosting exposure to key enablers like semiconductors, maintaining a focus on high-quality innovators amid market volatility.
Portfolio Snapshot: Growth Discipline in a $36B Powerhouse
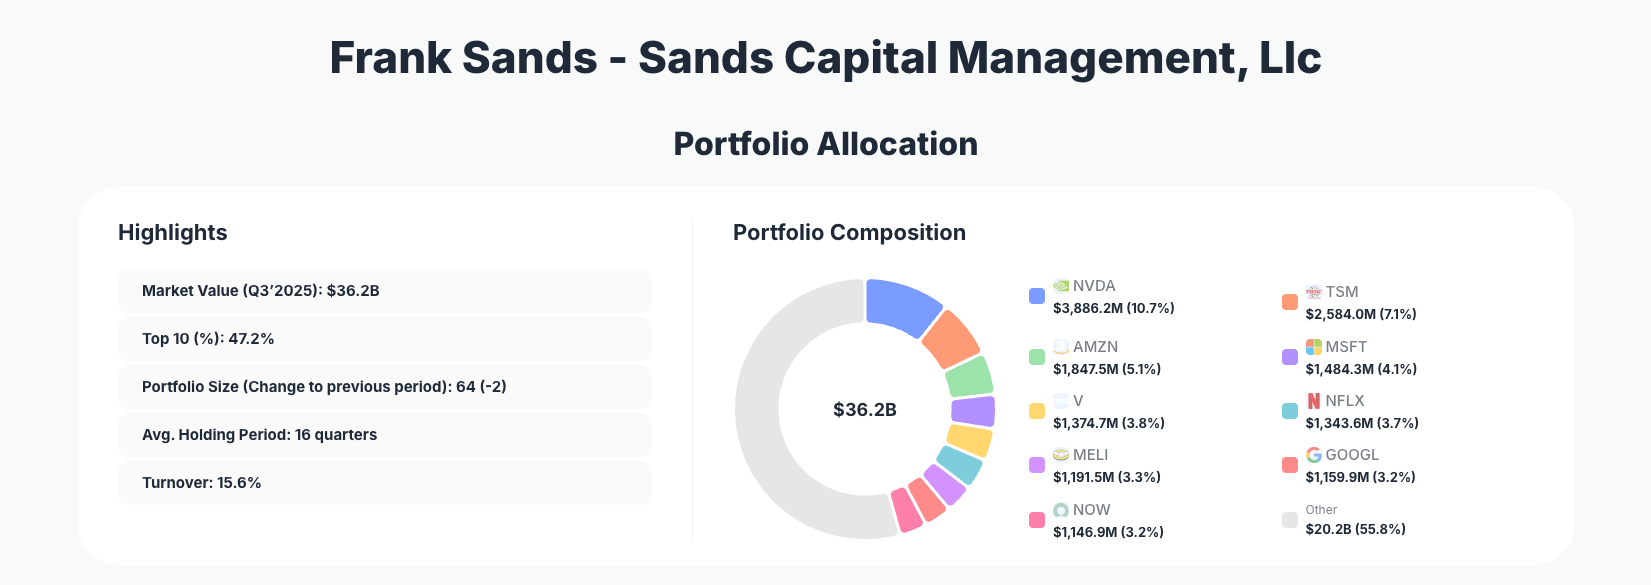
Portfolio Highlights (Q3 2025): - Market Value: $36.2B - Top 10 Holdings: 47.2% - Portfolio Size: 64 -2 - Average Holding Period: 16 quarters - Turnover: 15.6%
Sands Capital's portfolio demonstrates a balanced approach to growth investing, with nearly half the value concentrated in just 10 positions—a hallmark of conviction in select leaders. The reduction of two positions signals active management, trimming lower-conviction names while the 16-quarter average holding period underscores patience with proven winners. Turnover at 15.6% indicates measured activity, avoiding knee-jerk reactions in a tech-heavy market.
This structure allows Sands to navigate volatility effectively, overweighting durable growth themes like AI infrastructure and digital commerce. The $36.2B portfolio spans 64 holdings, providing diversification without diluting focus, as top holdings drive nearly half the performance potential.
Top Holdings Breakdown: AI Ecosystem Shifts and Emerging Bets
The portfolio's core remains anchored in technology leaders, with notable adjustments across key names. NVIDIA Corporation (NVDA) holds the top spot at 10.7% after a Reduce 3.38% trim, reflecting profit-taking in the AI chip leader amid soaring valuations. Taiwan Semiconductor Manufacturing Company Limited (TSM) saw an aggressive Add 8.18% to 7.1%, signaling strong belief in semiconductor foundry dominance as AI demand surges. Amazon.com, Inc. (AMZN) was cut by 8.84% to 5.1%, potentially reallocating from e-commerce cloud maturity.
Further tweaks include Microsoft Corporation (MSFT) Reduce 3.02% to 4.1%, Visa Inc. (V) slight Reduce 0.08% to 3.8%, and Netflix, Inc. (NFLX) Reduce 0.97% to 3.7%. MercadoLibre, Inc. (MELI) dipped Reduce 0.72% to 3.3%, while Alphabet Inc. (GOOGL) surged with Add 54.61% to 3.2%, highlighting fresh conviction in search and AI. ServiceNow, Inc. (NOW) faced Reduce 11.51% to 3.2%, and DoorDash, Inc. (DASH) was trimmed Reduce 16.04% to 3.0%, possibly due to valuation concerns in delivery growth.
These moves paint a picture of refinement: scaling into foundational AI plays like TSM and GOOGL while paring back frothy leaders like NVDA, AMZN, and NOW. The blend of U.S. tech giants, international semis, and fintech maintains growth exposure with risk calibration.
What the Portfolio Reveals About Sands' Strategy
Sands Capital's adjustments reveal a nuanced growth-at-a-reasonable-price approach, prioritizing AI infrastructure over pure hype.
- Tech Ecosystem Focus: Heavy weighting in semiconductors (TSM add) and cloud/AI enablers (GOOGL boost) shows bets on the full AI stack, not just end-user applications.
- Profit-Taking Discipline: Trims in NVDA, AMZN, MSFT, and NOW suggest locking in gains after strong runs, balancing concentration risk.
- Global Diversification: TSM and MELI provide non-U.S. exposure, hedging against domestic market peaks.
- Quality moats: Holdings like V and NFLX emphasize network effects and content leadership, favoring resilient cash generators.
- Risk Management: 15.6% turnover and two position cuts indicate proactive portfolio hygiene amid high valuations.
This strategy positions Sands for sustained compounding through quality compounders.
Portfolio Concentration Analysis
| Position | Value | % of Portfolio | Recent Change |
|---|---|---|---|
| NVIDIA Corporation | $3,886.2M | 10.7% | Reduce 3.38% |
| Taiwan Semiconductor Manufacturing Company Limited | $2,584.0M | 7.1% | Add 8.18% |
| Amazon.com, Inc. | $1,847.5M | 5.1% | Reduce 8.84% |
| Microsoft Corporation | $1,484.3M | 4.1% | Reduce 3.02% |
| Visa Inc. | $1,374.7M | 3.8% | Reduce 0.08% |
| Netflix, Inc. | $1,343.6M | 3.7% | Reduce 0.97% |
| MercadoLibre, Inc. | $1,191.5M | 3.3% | Reduce 0.72% |
| Alphabet Inc. | $1,159.9M | 3.2% | Add 54.61% |
| ServiceNow, Inc. | $1,146.9M | 3.2% | Reduce 11.51% |
The top 10 command 47.2% of the $36.2B portfolio, showcasing Sands' conviction-based sizing without excessive risk in any single name—NVDA's 10.7% lead is notable but trimmed, promoting balance. Additions like TSM +8.18% and GOOGL +54.61% counter reductions in AMZN and NOW, maintaining tech dominance while refreshing momentum. This concentration amplifies upside from winners like semiconductors but demands vigilant monitoring, as evidenced by the 15.6% turnover.
Investment Lessons from Frank Sands' Growth Approach
- Trim winners selectively: Reducing NVDA and MSFT after outsized gains preserves capital for better risk/reward, avoiding overexposure.
- Double down on enablers: Aggressive adds in TSM and GOOGL highlight backing infrastructure over applications in megatrends like AI.
- Long holding periods pay off: 16-quarter average reflects patience with quality, letting compounding work.
- Active position sizing: Trims across 8 of top 10 show constant valuation discipline in a 64-stock portfolio.
- Global quality focus: Blending U.S. tech with international leaders like TSM diversifies while chasing superior growth.
Looking Ahead: What Comes Next?
With portfolio size down to 64 -2 and 15.6% turnover, Sands has liquidity for opportunistic buys amid AI evolution and potential rate cuts. Expect further semis and AI software adds, building on TSM/GOOGL momentum, while monitoring frothy names like NVDA for deeper trims. In a high-valuation environment, Sands' cash deployment could target undervalued growth in cloud or fintech, setting up for 2026 upside if tech earnings deliver.
FAQ about Frank Sands Portfolio
Q: What are the most significant changes in Sands Capital's Q3 2025 13F filing?
A: Key moves include Add 54.61% to GOOGL 3.2%, Add 8.18% to TSM 7.1%, sharp Reduce 16.04% in DASH 3.0%, and trims in NVDA 10.7% and AMZN 5.1%, reflecting profit-taking and reallocation.
Q: Why does Sands Capital maintain such concentration in its top 10 holdings?
A: At 47.2%, the top 10 focus allows high conviction in proven growth leaders like NVDA and TSM, amplifying returns while the 64 holdings provide ballast—balanced by long 16-quarter holds and moderate 15.6% turnover.
Q: What sectors dominate Frank Sands' portfolio strategy?
A: Technology rules, especially AI/semiconductors (NVDA, TSM), cloud/e-commerce (AMZN, MSFT), and fintech (V), with emerging bets like GOOGL signaling broader AI and digital expansion.
Q: How can I track and follow Frank Sands' Sands Capital portfolio?
A: Follow quarterly 13F filings on the SEC site, noting the 45-day lag after quarter-end. Use ValueSense's superinvestor tracker at https://valuesense.io/superinvestors/sands-capital for real-time analysis, visualizations, historical changes, and alerts.
Explore More Investment Opportunities
For investors seeking undervalued companies with high fundamental quality, our analytics team provides curated stock lists:
📌 50 Undervalued Stocks (Best overall value plays for 2025)
📌 50 Undervalued Dividend Stocks (For income-focused investors)
📌 50 Undervalued Growth Stocks (High-growth potential with strong fundamentals)
🔍 Check out these stocks on the Value Sense platform for free!