Getting started - Top 5 features to get started on ValueSense
Find answers to all your questions.
<– Back to the Knowledge Base
Stock fundamentals and analysis
To get started with ValueSense, we recommend beginning with the core of our platform - fundamental stock analysis. You can access this powerful feature using the search functionality on our homepage or through the floating search console that's always available at the bottom of your screen.
Getting Started with Stock Analysis
Step 1: Search for Your Stock
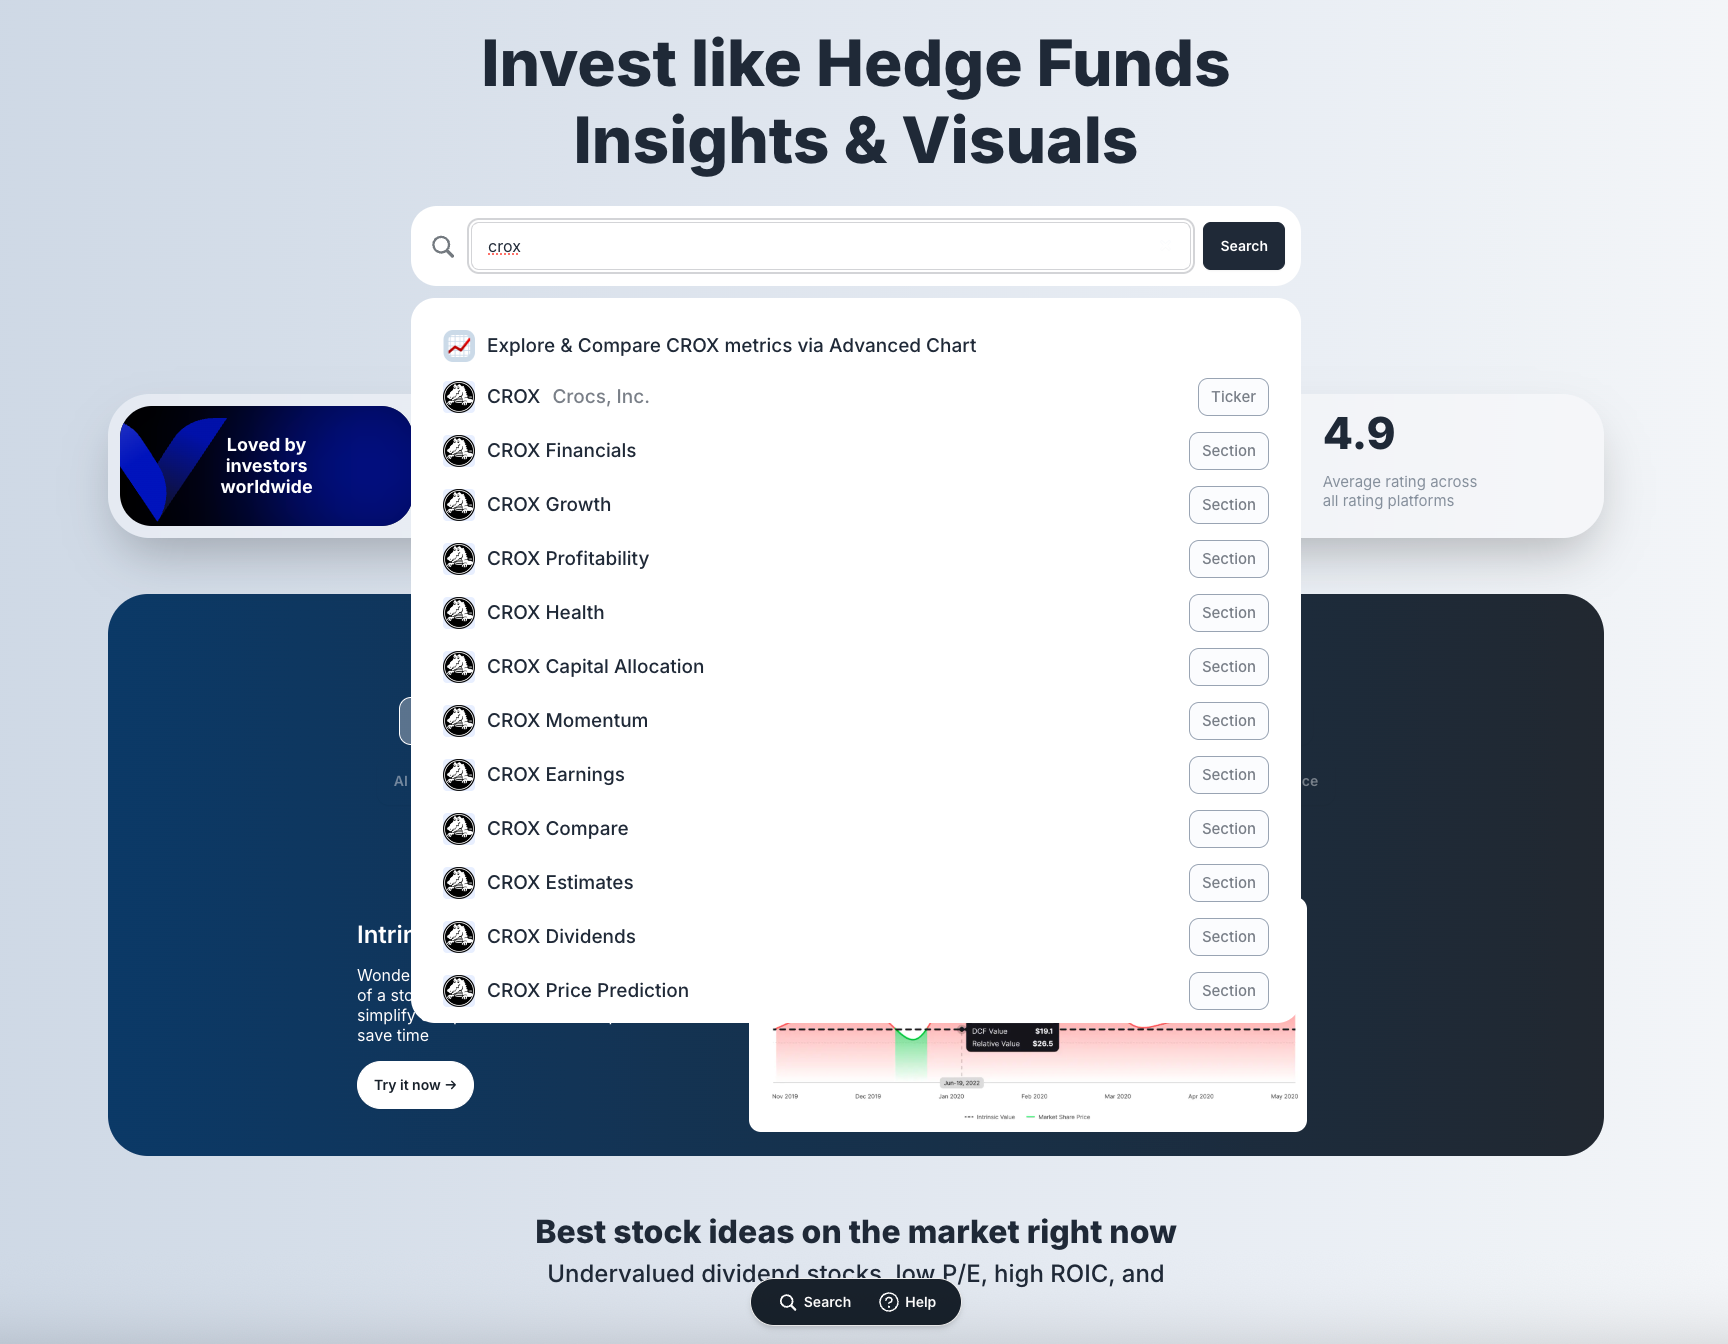
Begin by using the prominent search bar on the ValueSense homepage. You can search by:
- Company ticker symbol (e.g., "CROX")
- Full company name (e.g., "Crocs Inc")
- Any combination of ticker and company name
The search bar features the placeholder text "Search any ticker, metric, and investing tool" and includes quick access buttons for popular stocks like MSFT, NFLX, GOOG, JNJ, and AAPL.
Step 2: Navigate to Stock Analysis
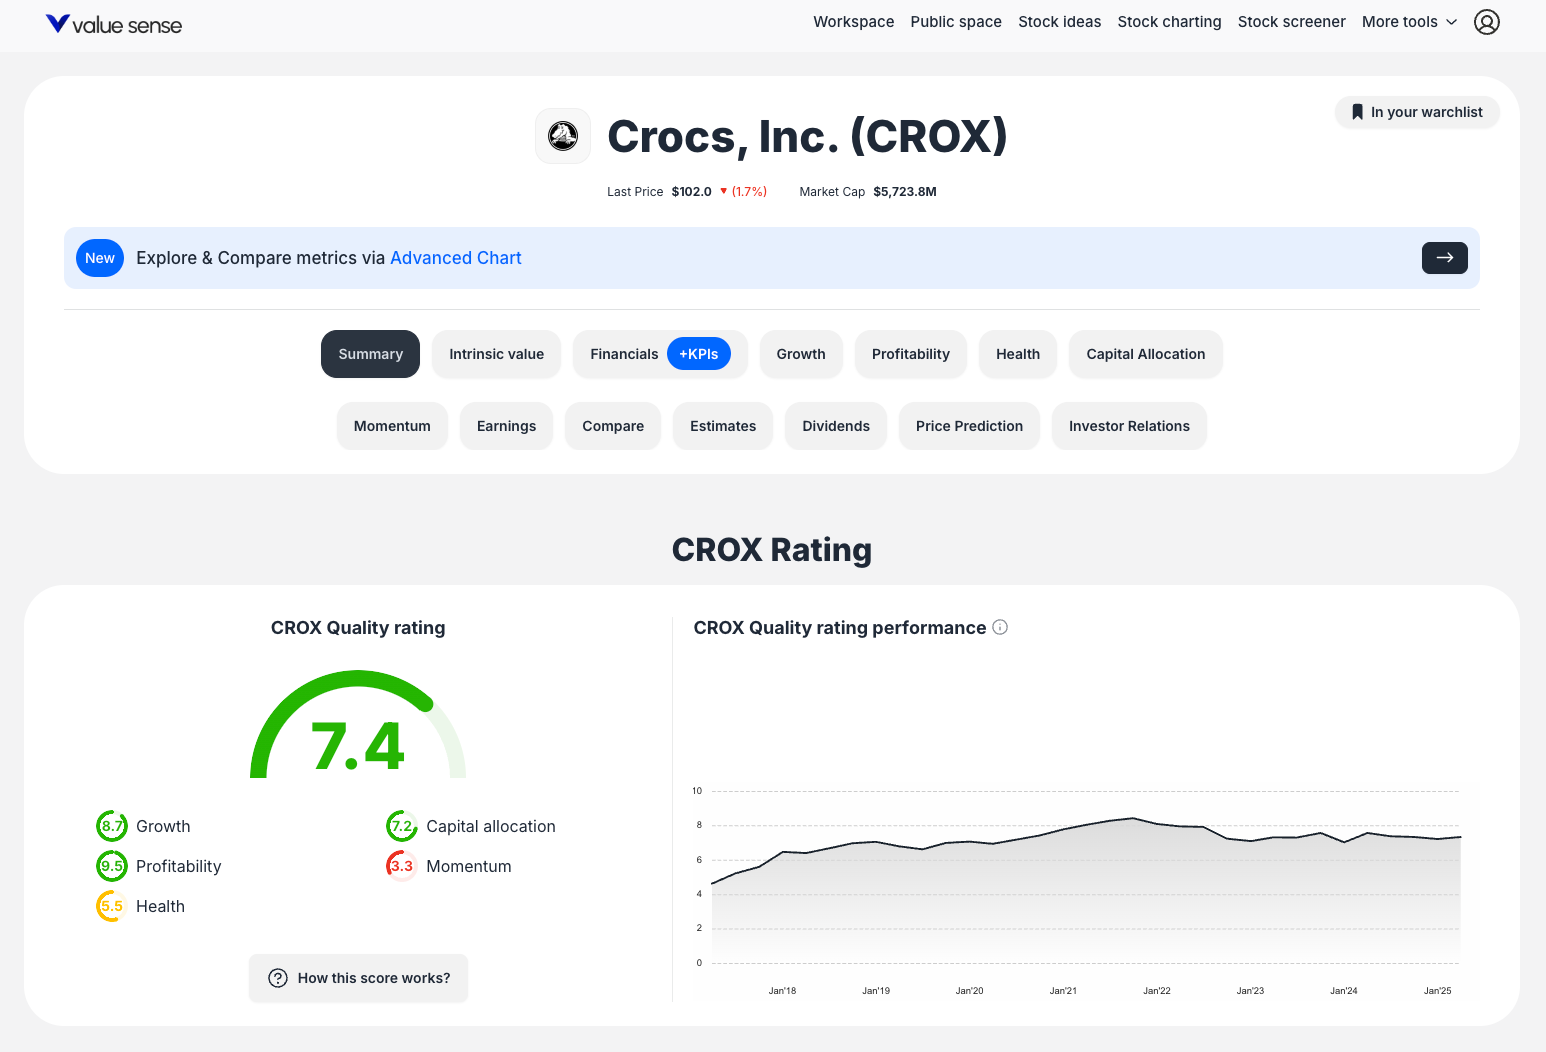
Once you select a stock from the search results, you'll land on the company's dedicated analysis page. Here you'll see:
- Company logo, name, and ticker prominently displayed
- Key metrics like Last Price and Market Cap
- An option to add the stock to your watchlist
Step 3: Explore Comprehensive Analysis Sections
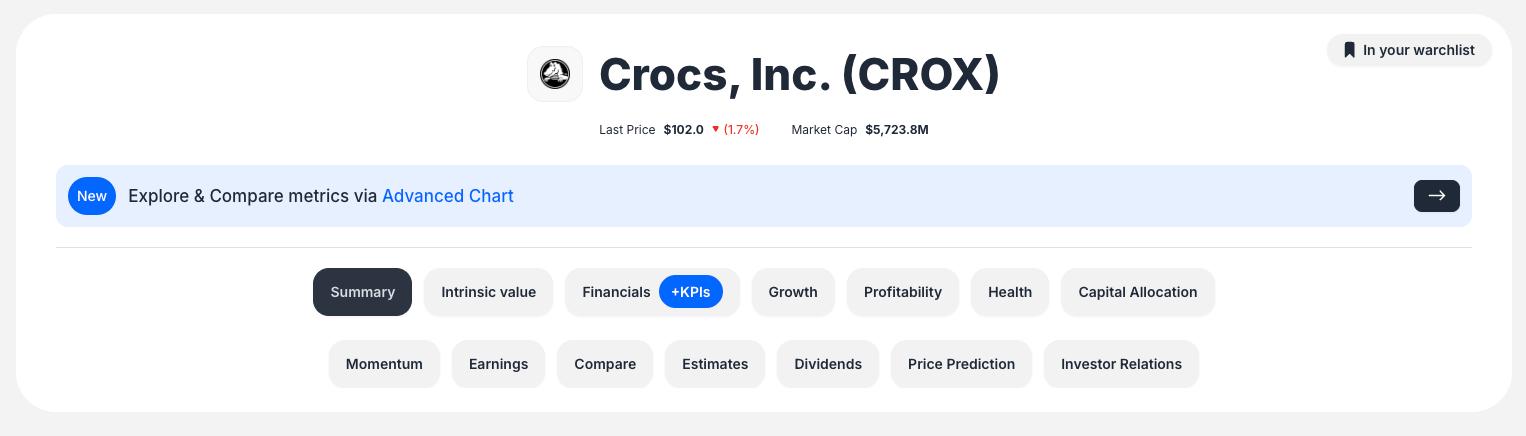
The power of ValueSense lies in its comprehensive analysis tabs. Use the sub-navigation bar to explore different aspects of the company:
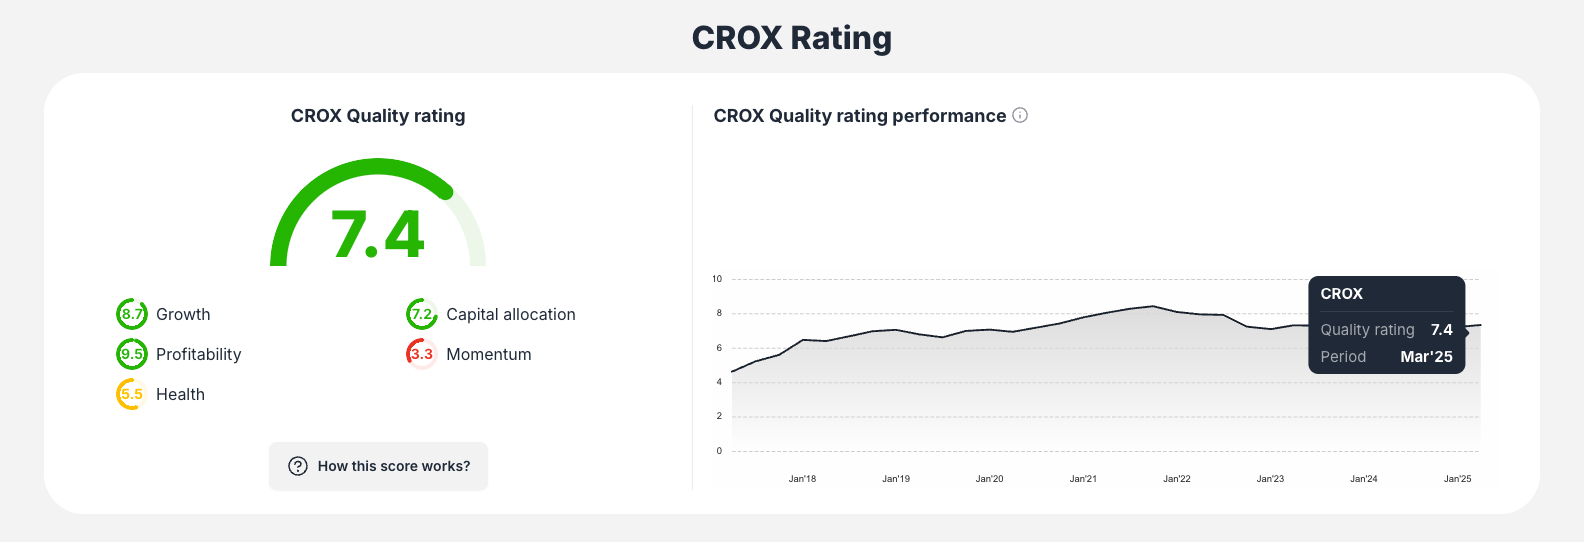
- Summary: Get an overview with key quality ratings and performance metrics
- Intrinsic Value: Analyze the stock's fair value calculations
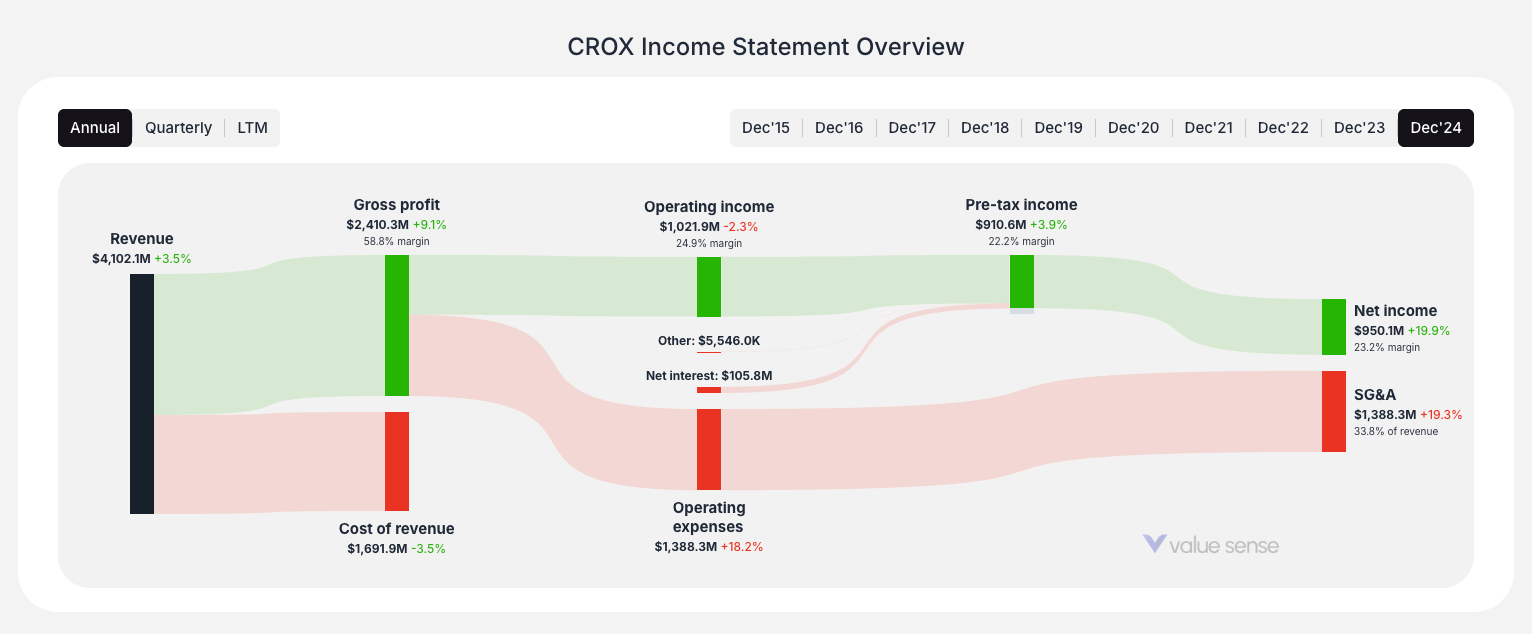
- Financials + KPIs: Review detailed financial statements and key performance indicators
- Growth: Examine growth trends and projections
- Profitability: Assess profit margins and efficiency metrics
- Health: Evaluate financial stability and debt levels
- Capital Allocation: Understand how the company uses its capital
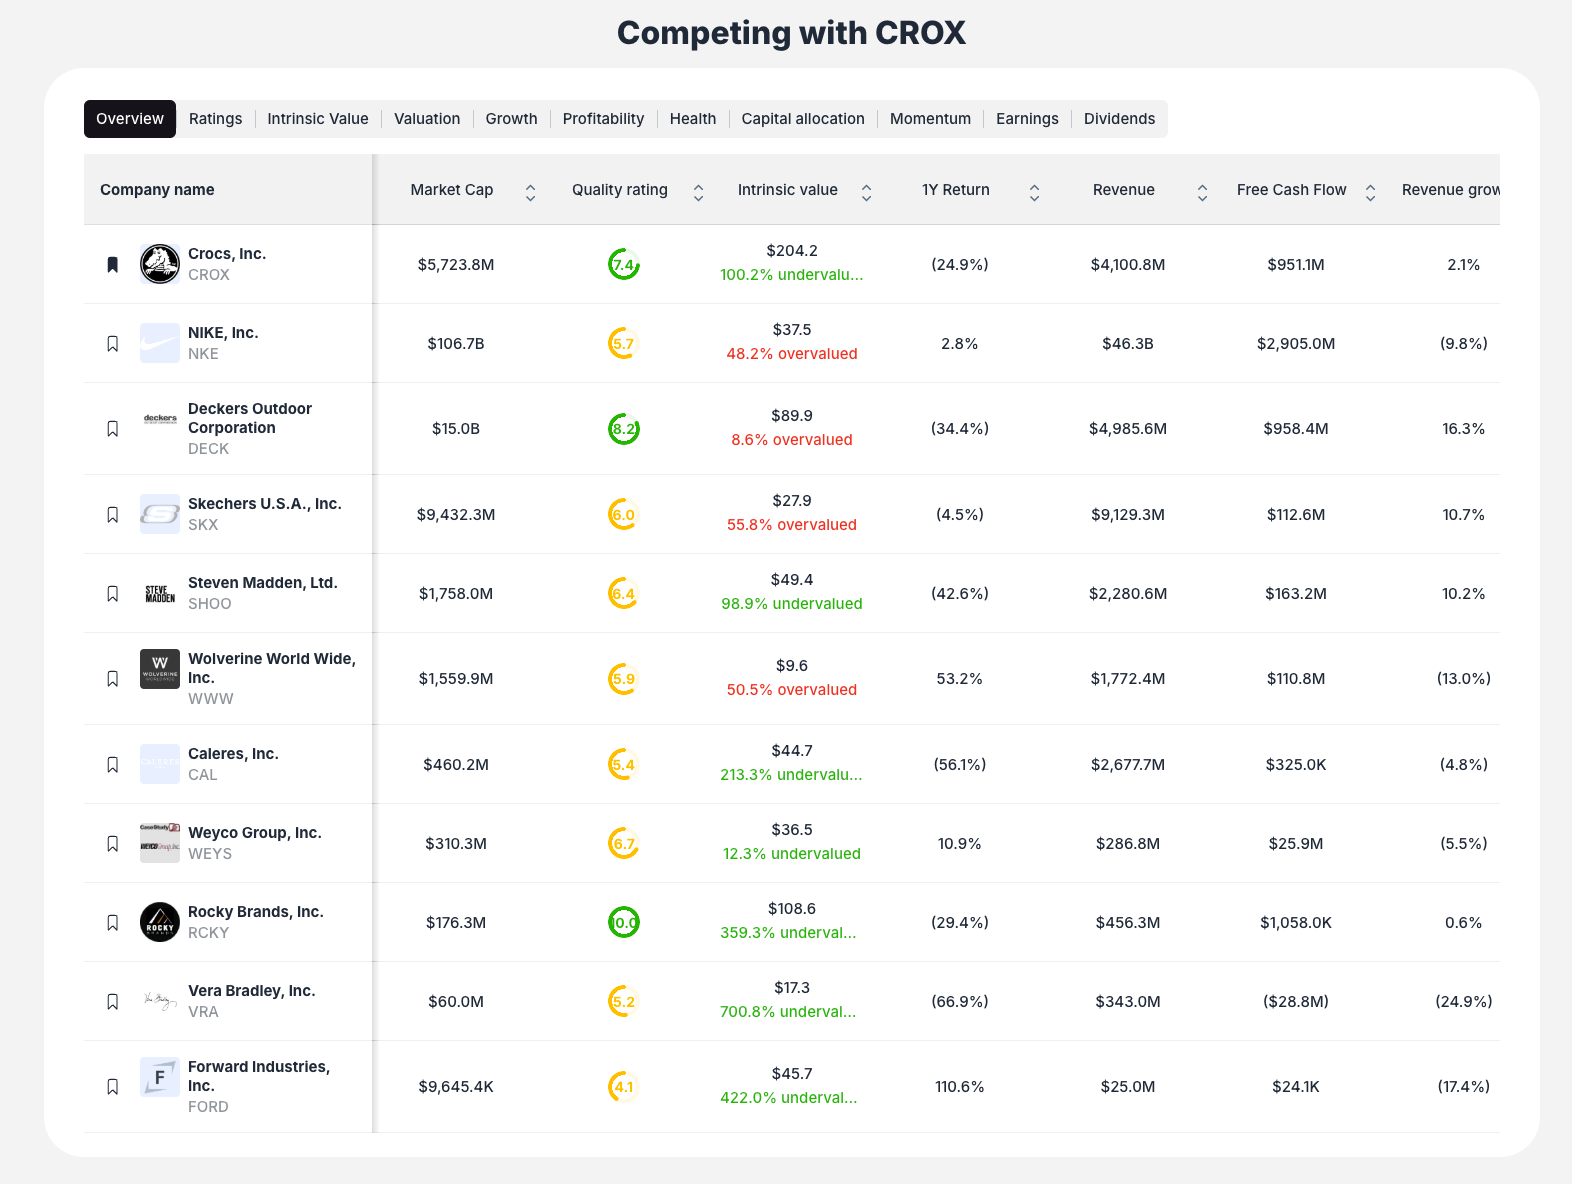
- Compare: Benchmark against competitors and industry peers
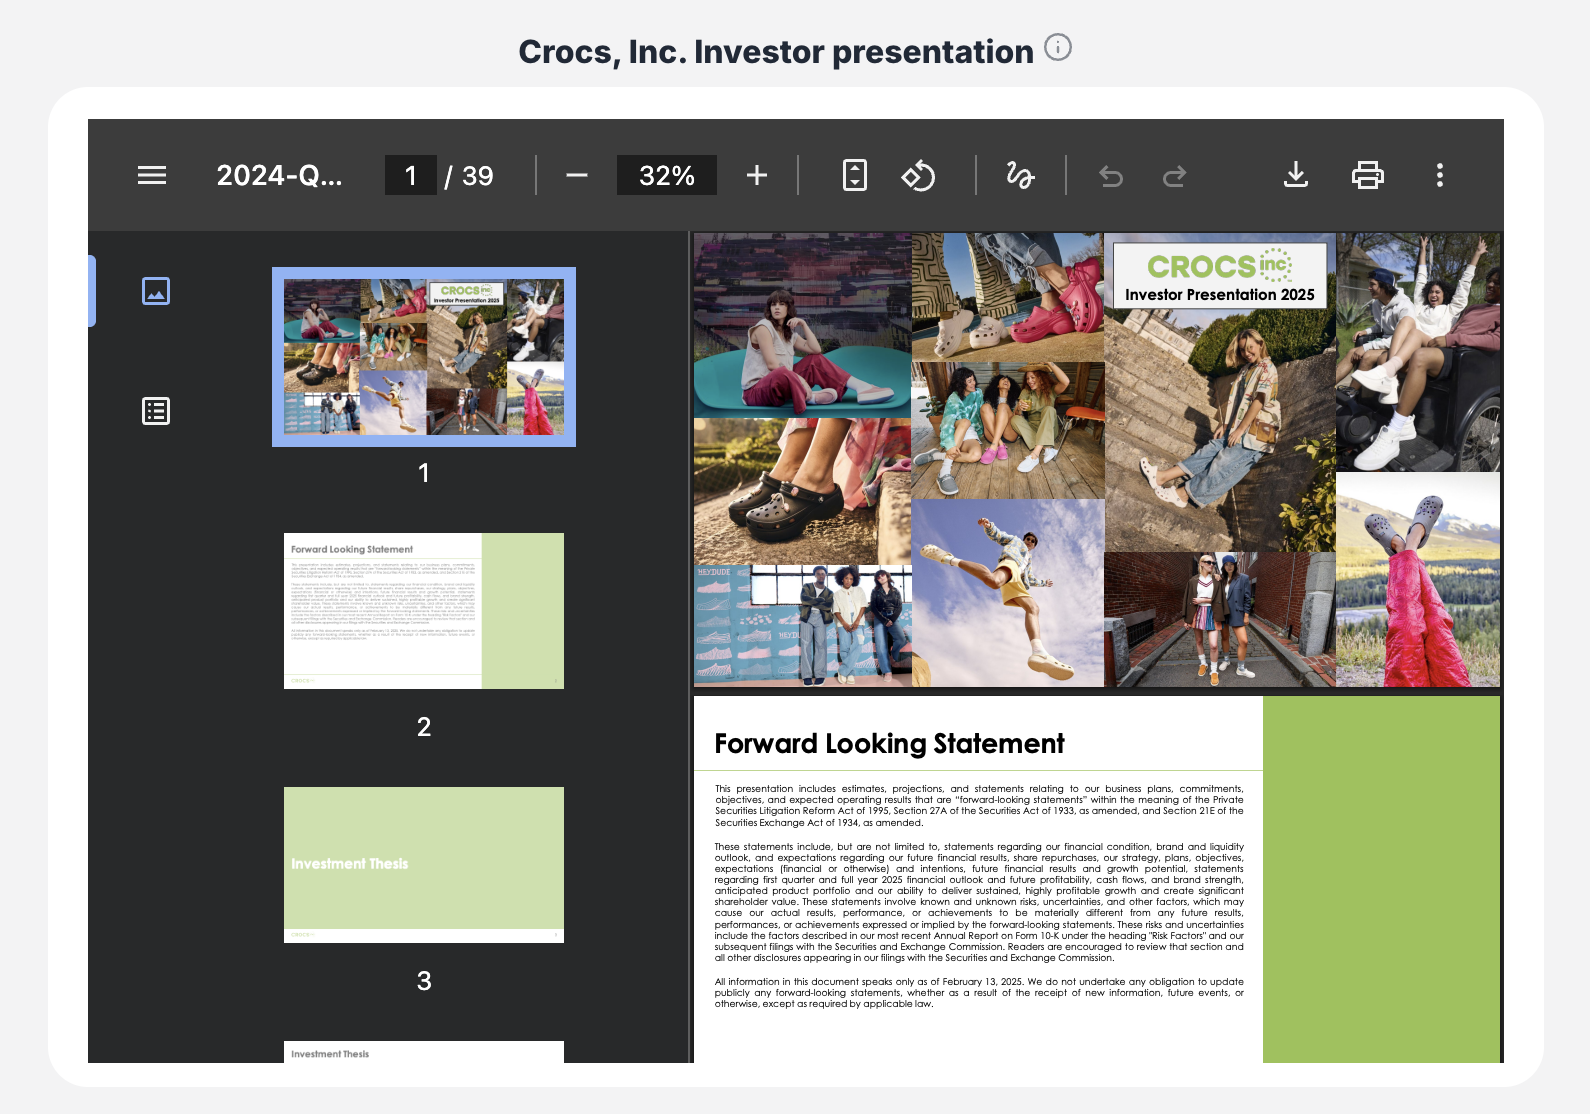
- Investor Relations: Access official company documents and presentations
Key Features to Note
Visual Rating System: Each analysis section includes color-coded rating gauges that provide instant insights into the company's performance. For example, you might see ratings like "Quality Rating: 7.4" or "Growth Rating: 8.7".
Interactive Charts and Data: Every section features dynamic charts, graphs, and data tables that help visualize complex financial information in an easy-to-understand format.
Integrated Document Viewer: The Investor Relations tab includes an embedded PDF viewer, allowing you to review earnings presentations, annual reports, and other official documents without leaving the platform.
Competitor Comparison: The Compare section shows how your selected stock performs against industry peers, helping you make informed investment decisions.
Pro Tip
Start with the Summary tab to get a quick overview, then dive deeper into specific areas that interest you most. The Growth and Profitability tabs are particularly valuable for understanding a company's fundamental strength and future potential.
Stock charting
ValueSense's Stock Charting feature is designed for fundamental data analysis and visualization. Unlike traditional technical charting tools that focus on price movements, this powerful feature allows you to chart and compare fundamental financial metrics across multiple companies, providing deep insights into business performance trends.

Getting Started with Stock Charting
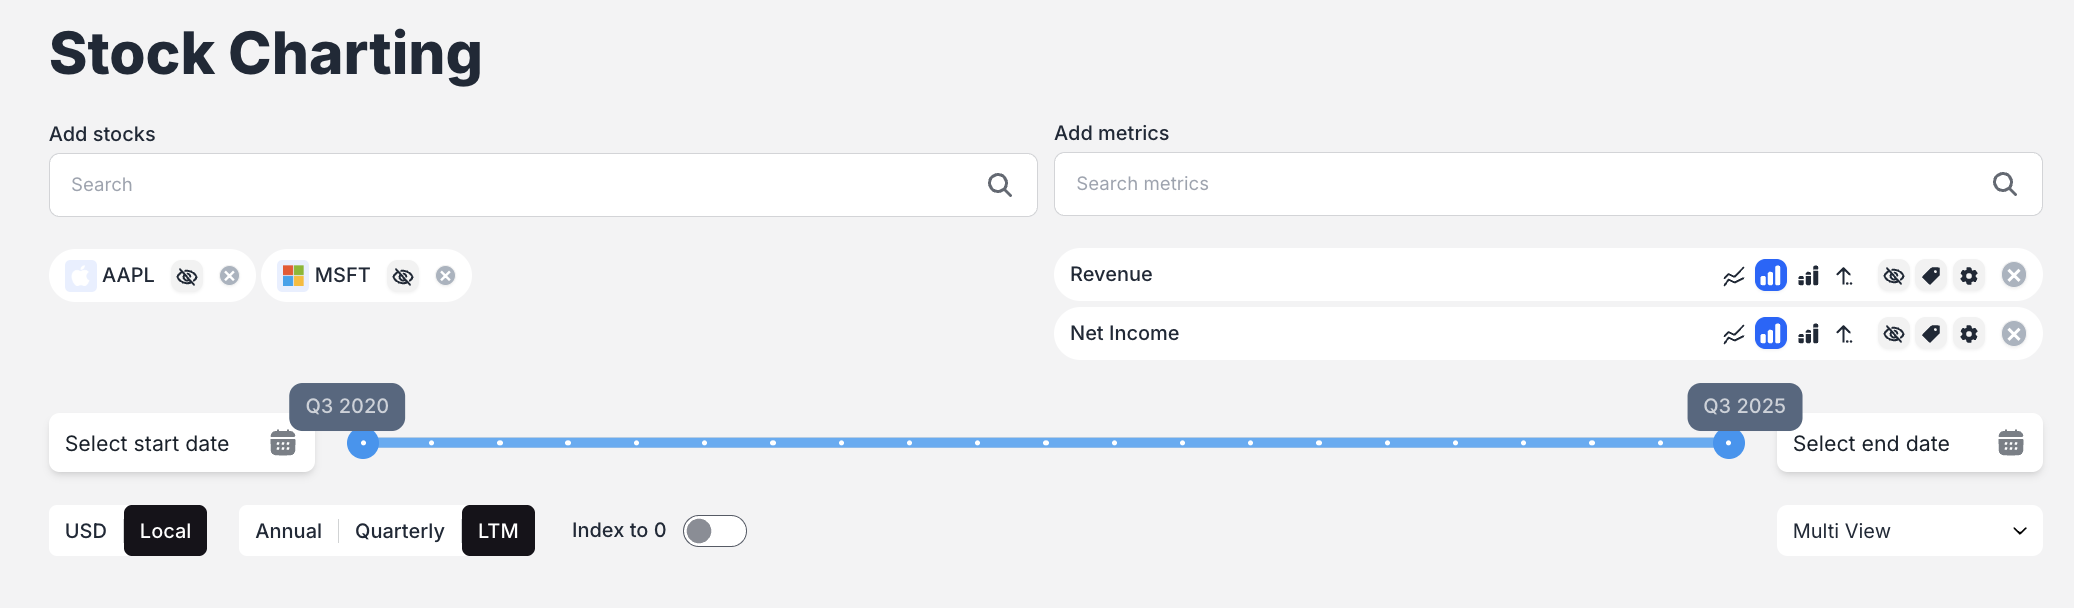
Step 1: Access the Stock Charting Feature
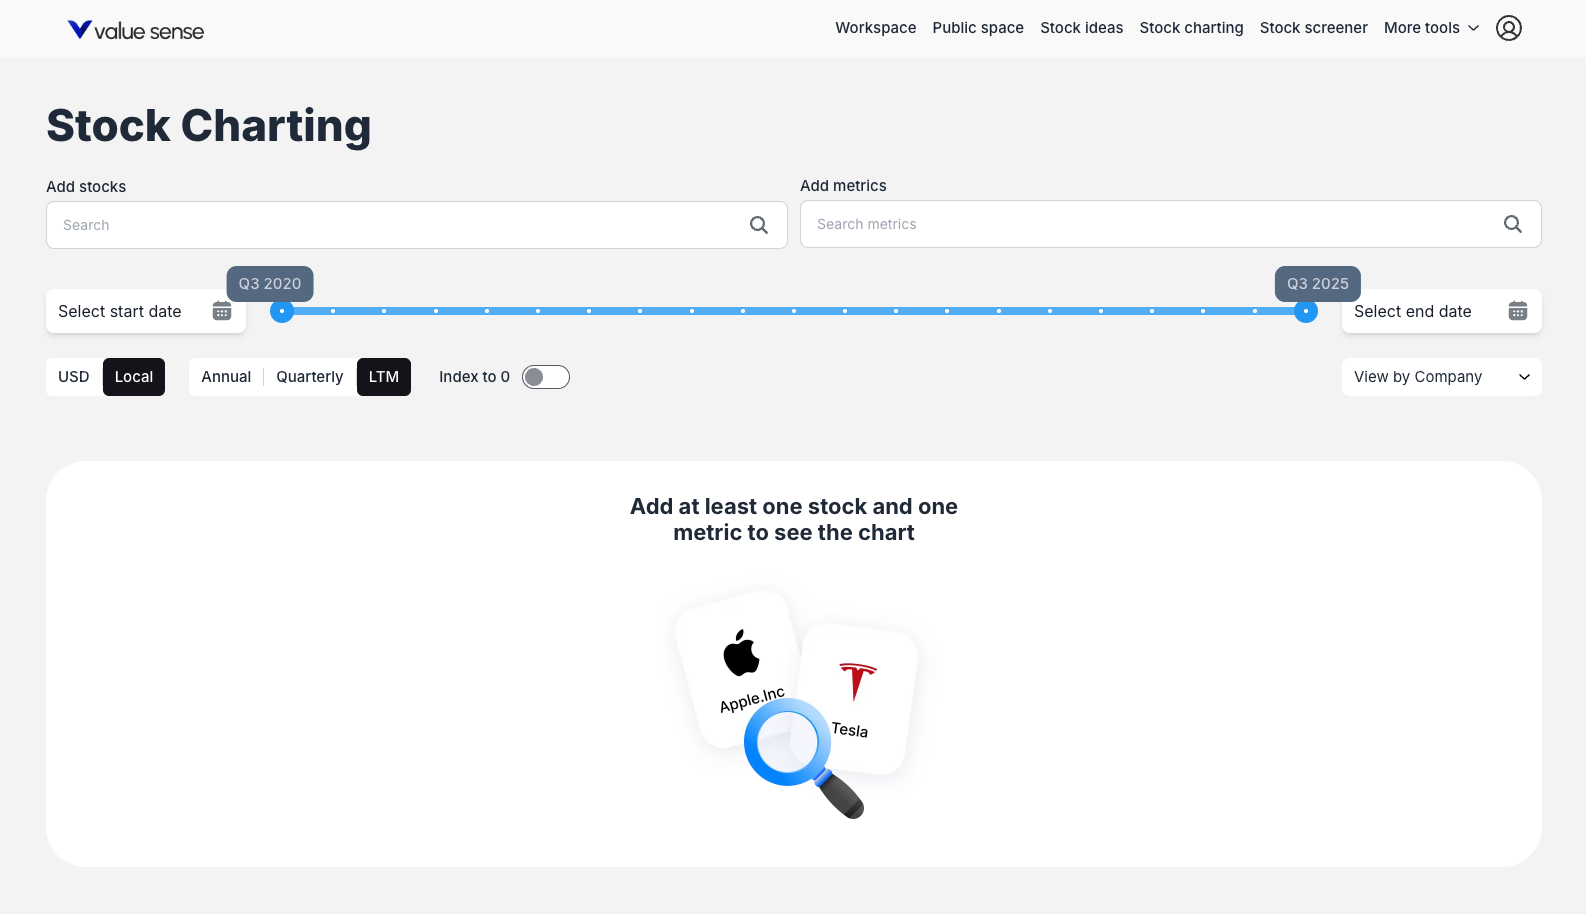
Navigate to the Stock Charting tool by clicking on "Stock charting" in the main navigation bar at the top of the page, located between "Stock ideas" and "Stock screener."
Step 2: Add Stocks to Your Analysis
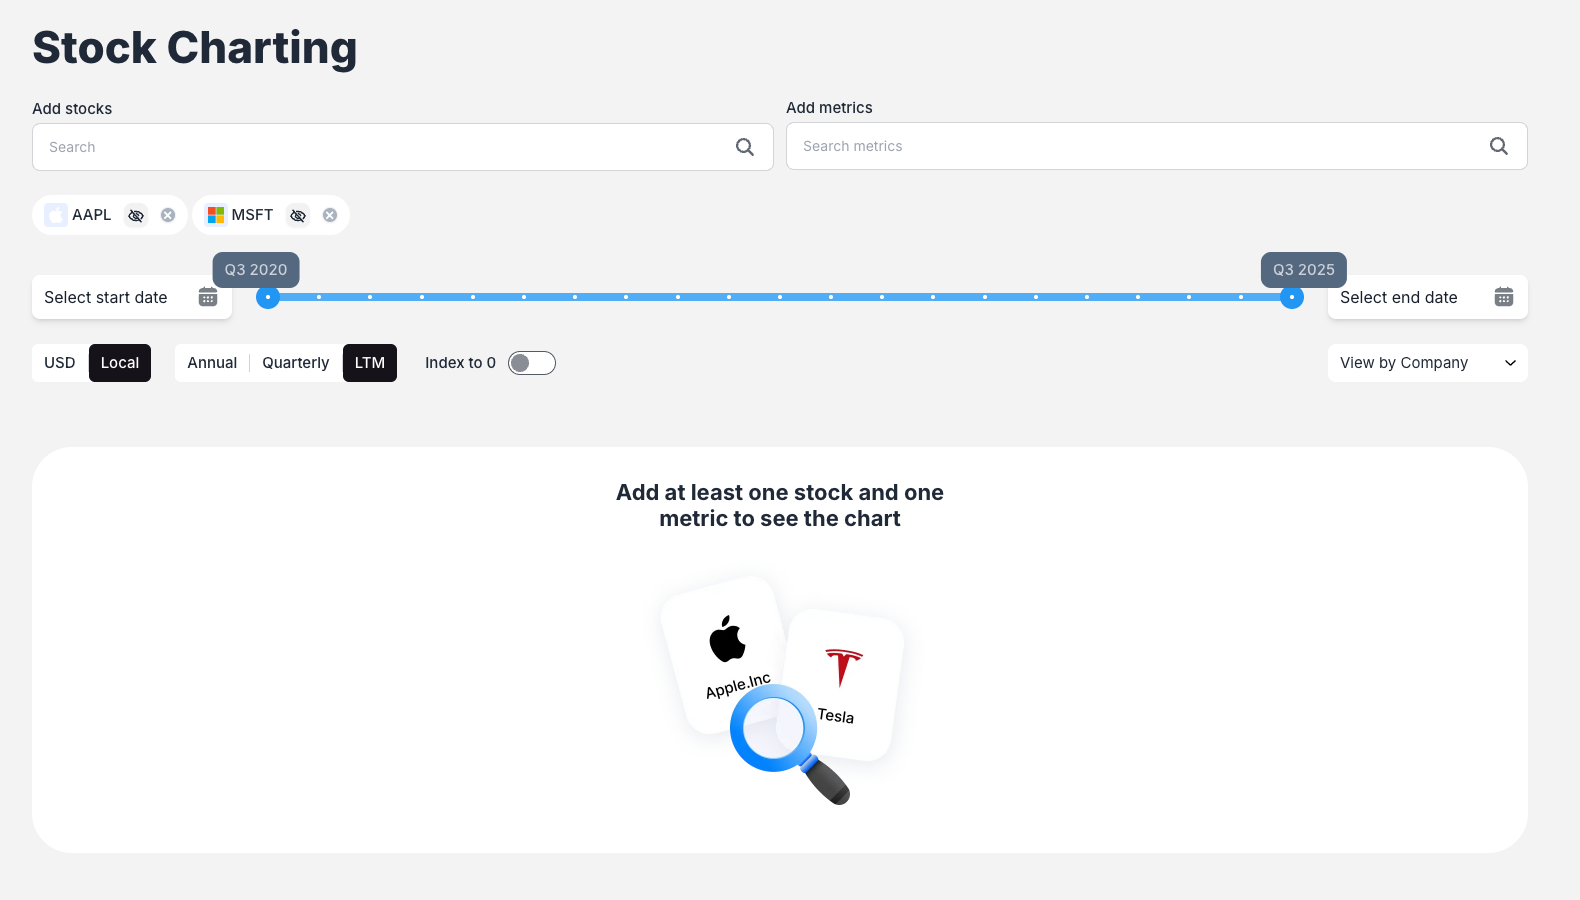
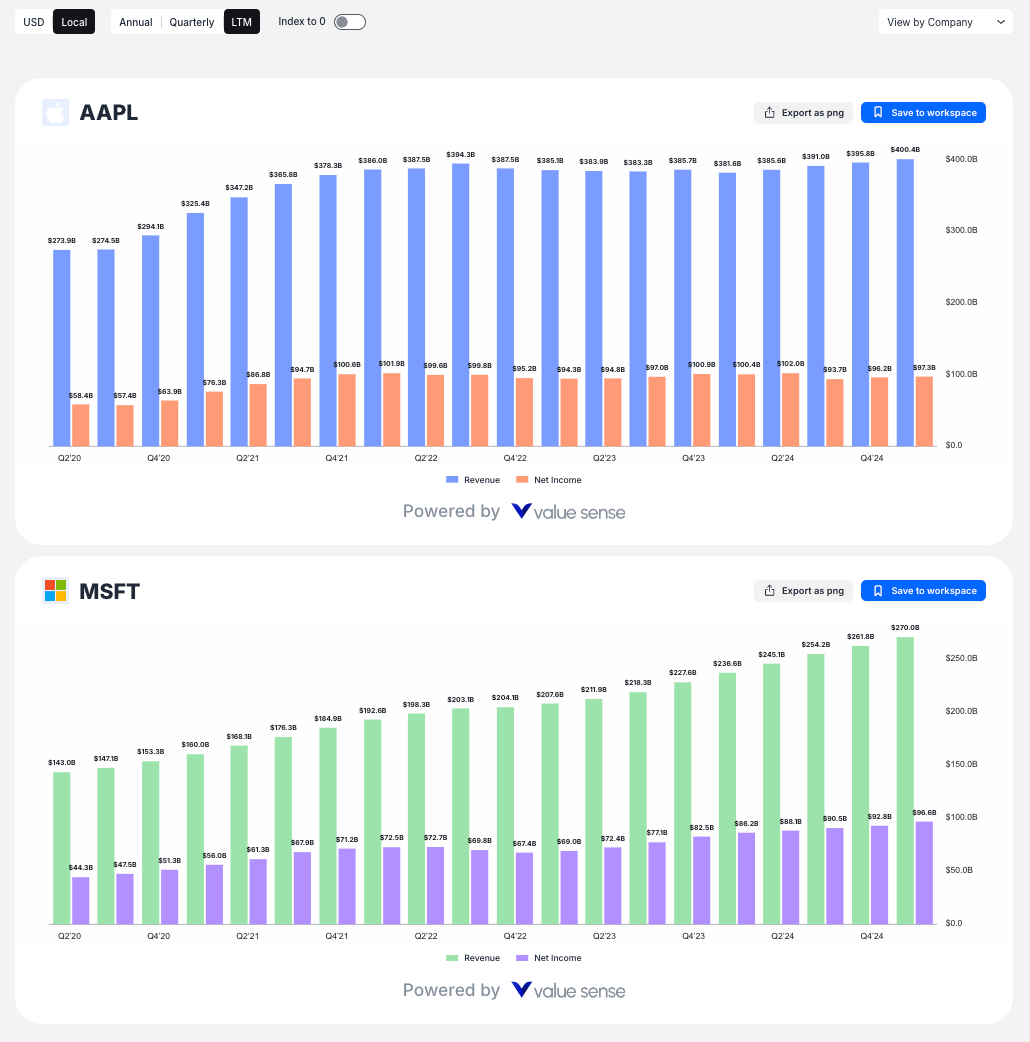
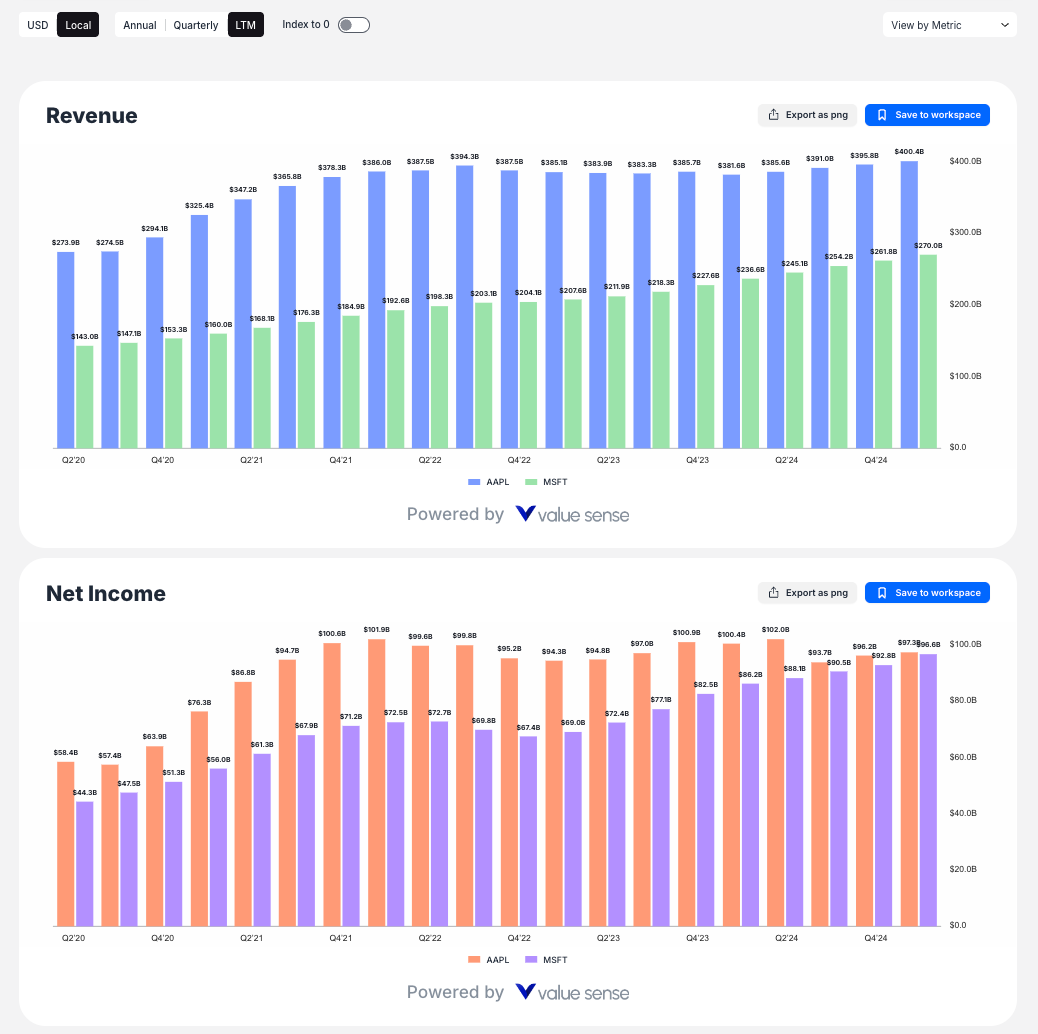
Use the "Add stocks" search bar to find and select companies you want to analyze. Simply type a company name or ticker symbol (e.g., "MSFT" for Microsoft, "AAPL" for Apple) and select from the dropdown results. You can add multiple stocks to create comprehensive comparisons.
Step 3: Select Financial Metrics
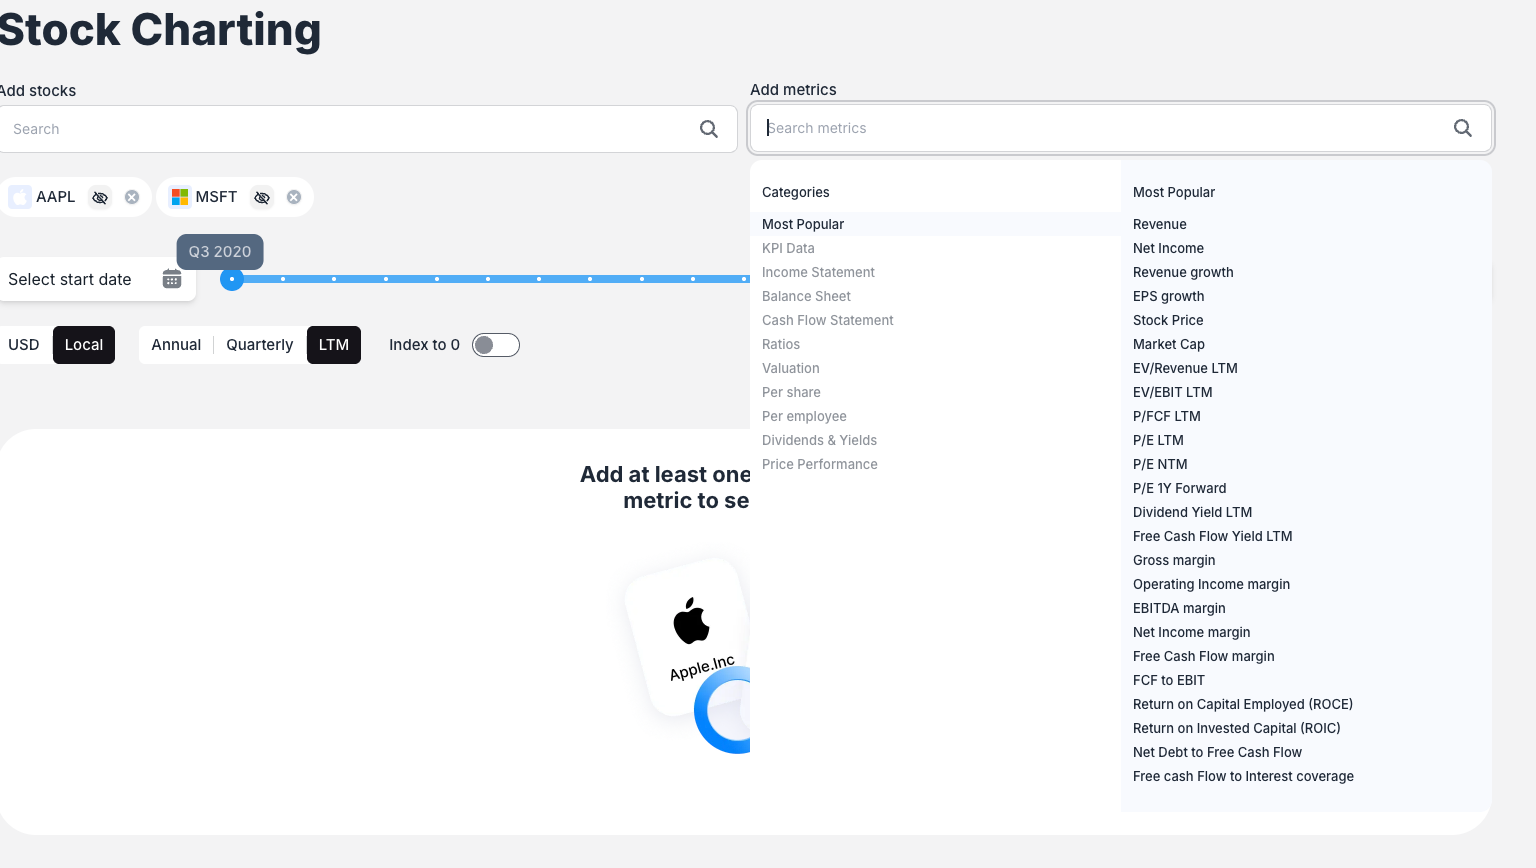
Click the "Add metrics" search bar to choose the fundamental data points you want to chart. The system offers:
- Most Popular metrics: Common financial indicators like Revenue, Net Income, etc.
- KPI Data: Company-specific key performance indicators (e.g., LinkedIn Revenue for Microsoft)
- Hierarchical categories: Navigate through organized metric categories to find specific data points
Key Charting Features
Multiple View Modes
ValueSense offers four distinct view modes to help you analyze your data:
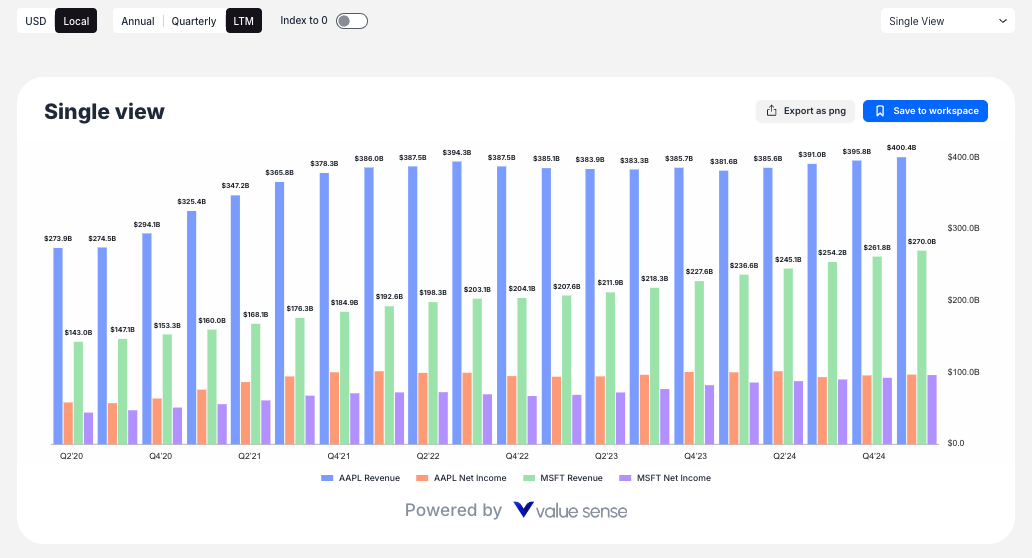
- Single View: Combines all selected metrics for all companies on one unified chart
- View by Company: Creates separate charts for each company, showing all selected metrics
- View by Metric: Creates separate charts for each metric, comparing all selected companies
- Multi View: Creates individual charts for every unique combination of stock and metric
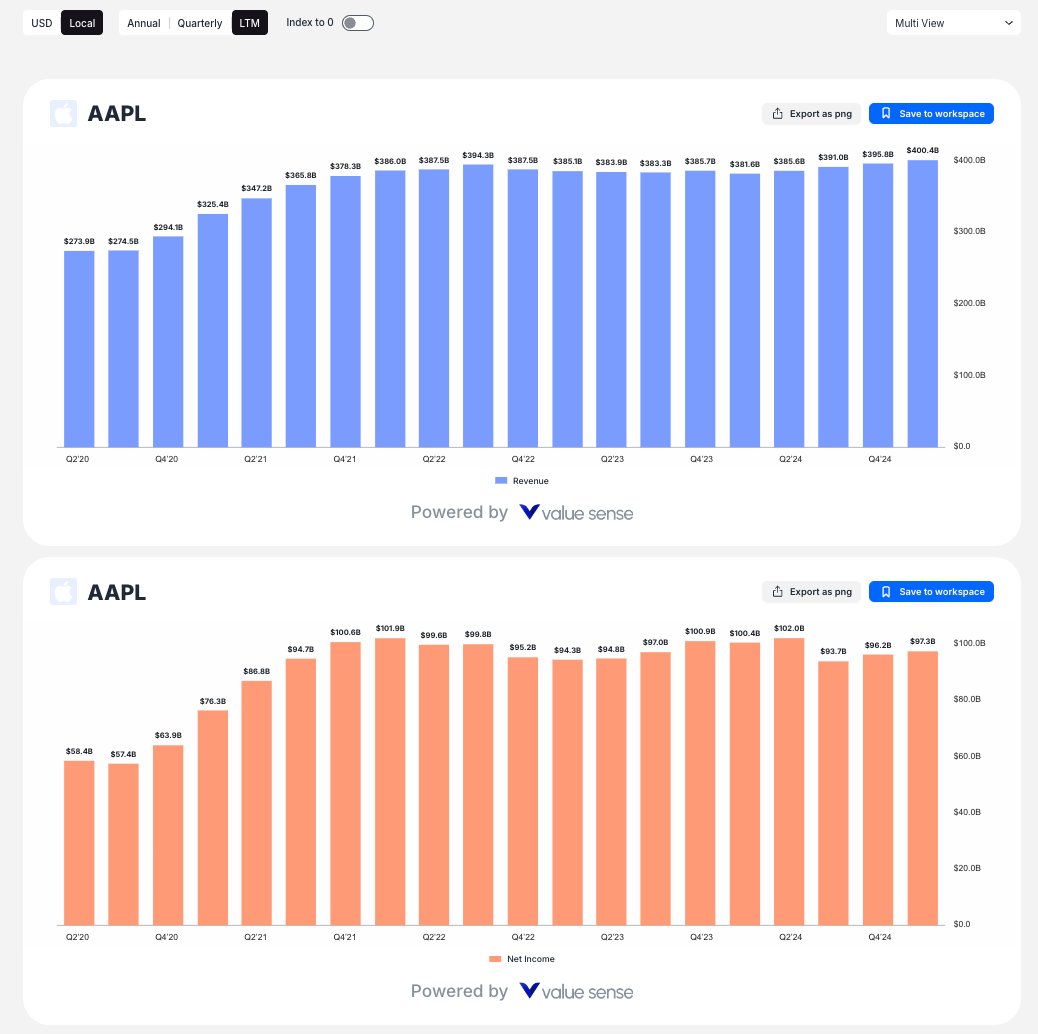
Chart Customization Options
For each metric, you can customize:
- Chart Type: Toggle between Bar Chart and Line Chart display
- Statistical Overlays: Add Average, Median, Min/Max lines to visualize statistical trends
- Secondary Axis: Use dual y-axes for metrics with different scales
- Visibility: Hide or show individual metrics as needed
Advanced Analysis Tools
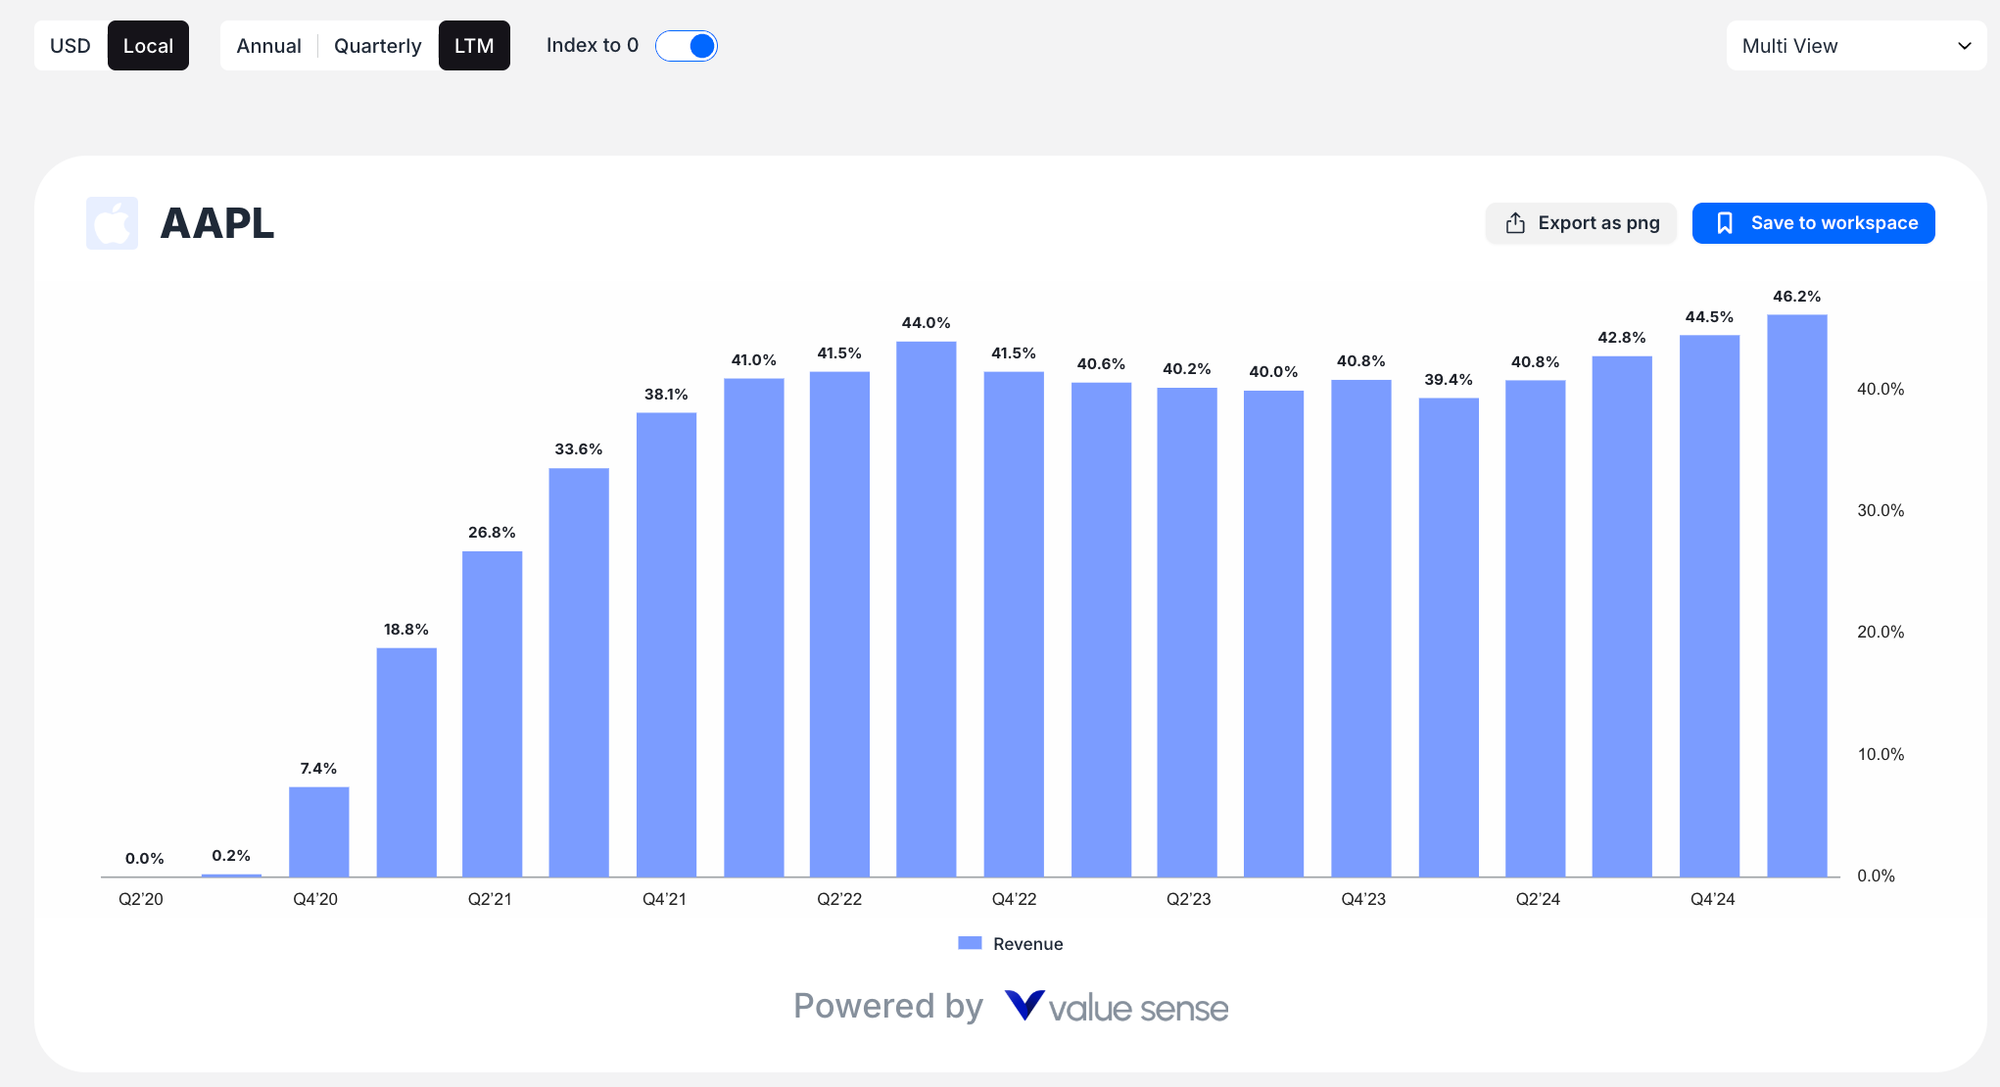
- Index to 0 Normalization: This powerful feature recalculates the Y-axis to show percentage growth from the starting date, allowing you to compare growth rates regardless of absolute values
- Time Controls:

- Interactive date range slider for intuitive time period selection
- Calendar date pickers for precise date selection
- Period buttons (Annual, Quarterly, LTM) to adjust data frequency
- Currency Options: Toggle between USD and Local currency display
Export and Save Options
Every chart includes:
- Export as PNG: Download charts as image files for presentations or reports
- Save to workspace: Store your analysis for future reference and collaboration
Stock screener
ValueSense's Stock Screener is a powerful tool that helps you find investment opportunities by filtering stocks based on fundamental criteria. Whether you're looking for undervalued companies, dividend champions, or growth stocks, the screener provides both quick-start options and detailed customization capabilities.

Getting Started with Stock Screener
Access the Feature
Navigate to "Stock screener" in the main navigation menu at the top of the page.
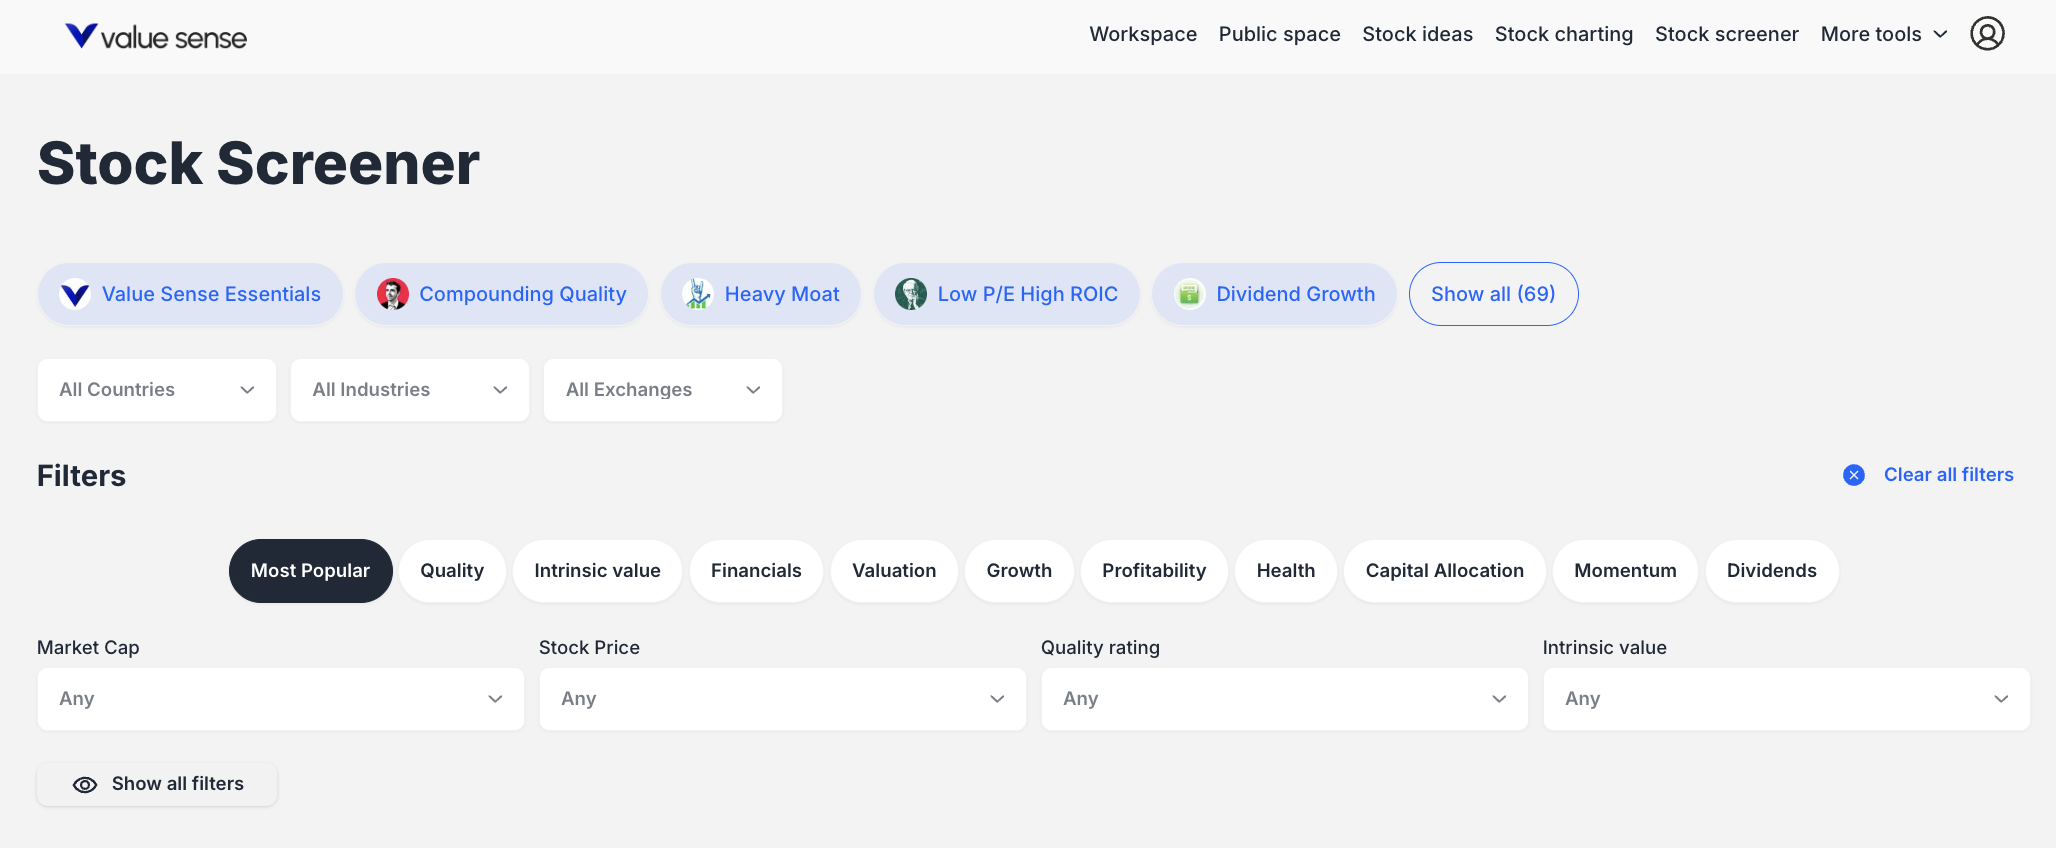
Two Ways to Screen Stocks
- Pre-set Screeners: Choose from 69+ professionally curated screens organized by categories:
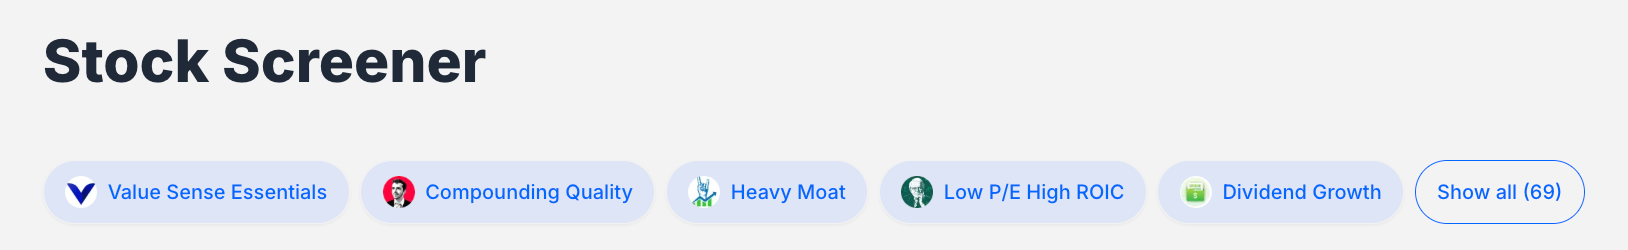
- Quality: Value Sense Essentials, Compounding Quality, Heavy Moat
- Value: Value Stocks, Low P/E Ratio Stocks
- Dividend: Dividend Growth, High Dividend Yield Stocks
- Market Cap: Large Cap, Small Cap Growth Stocks
- Budget-Friendly: Stocks Under $5, Stocks Under $10
- Momentum: Best Performing Stocks YTD, 52 Week High Stocks
- Beginner-Friendly: Best S&P 500 Stocks, Safe Stocks for Beginners
- Custom Filters: Build your own screen using organized filter categories:
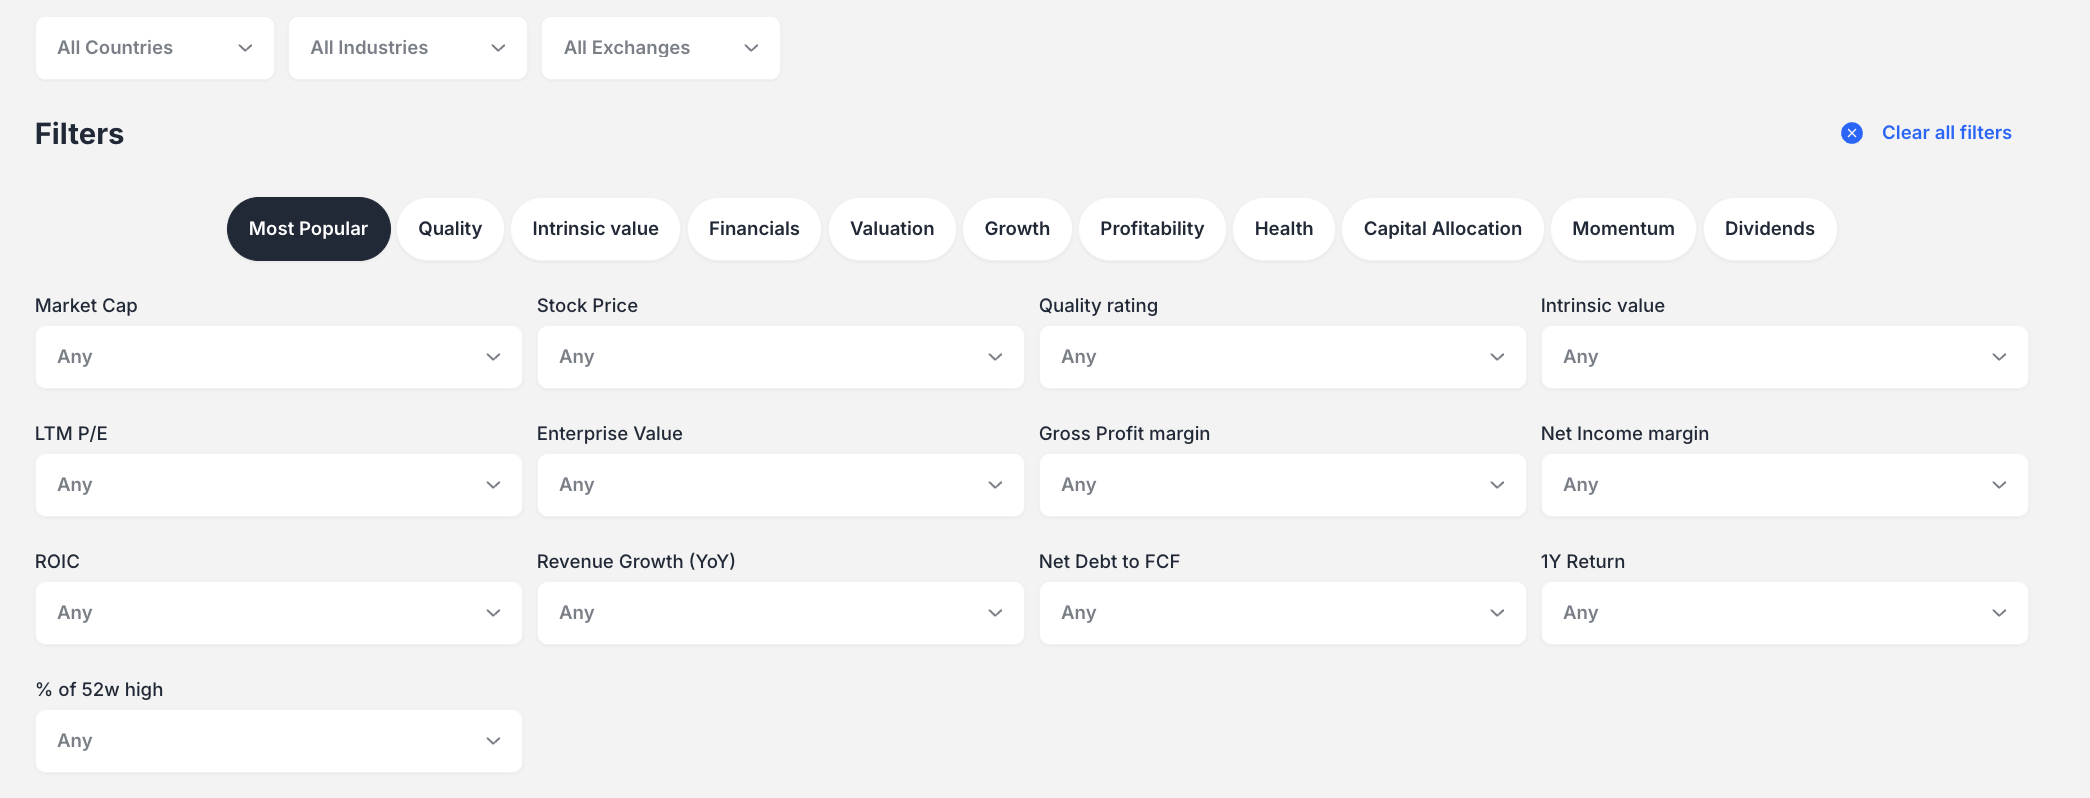
- Most Popular: Market Cap, Stock Price, Quality rating, Intrinsic value
- Quality: Quality rating, ROIC, Gross Profitability
- Intrinsic Value: Undervalued percentages, DCF Value, Ben Graham fair value
- Financials: Revenue, Free Cash Flow, Net Debt
- Health: Health rating, Current ratio, Quick ratio
- And more categories for Valuation, Growth, Profitability, Dividends
How to Create a Custom Screen
- Select Filter Categories: Click on tabs like "Most Popular," "Quality," or "Health"
- Set Criteria: Use dropdowns to select specific values (e.g., "Mid Cap ($2B to $10B)")
- Apply Multiple Filters: Add criteria from different categories as needed
- Update Results: Click "Update screener results" to run your screen
- Save Your Work: Use "Save to workspace" to preserve your custom screen
Analyzing Your Results
Data Table Views Switch between different data perspectives using result tabs:
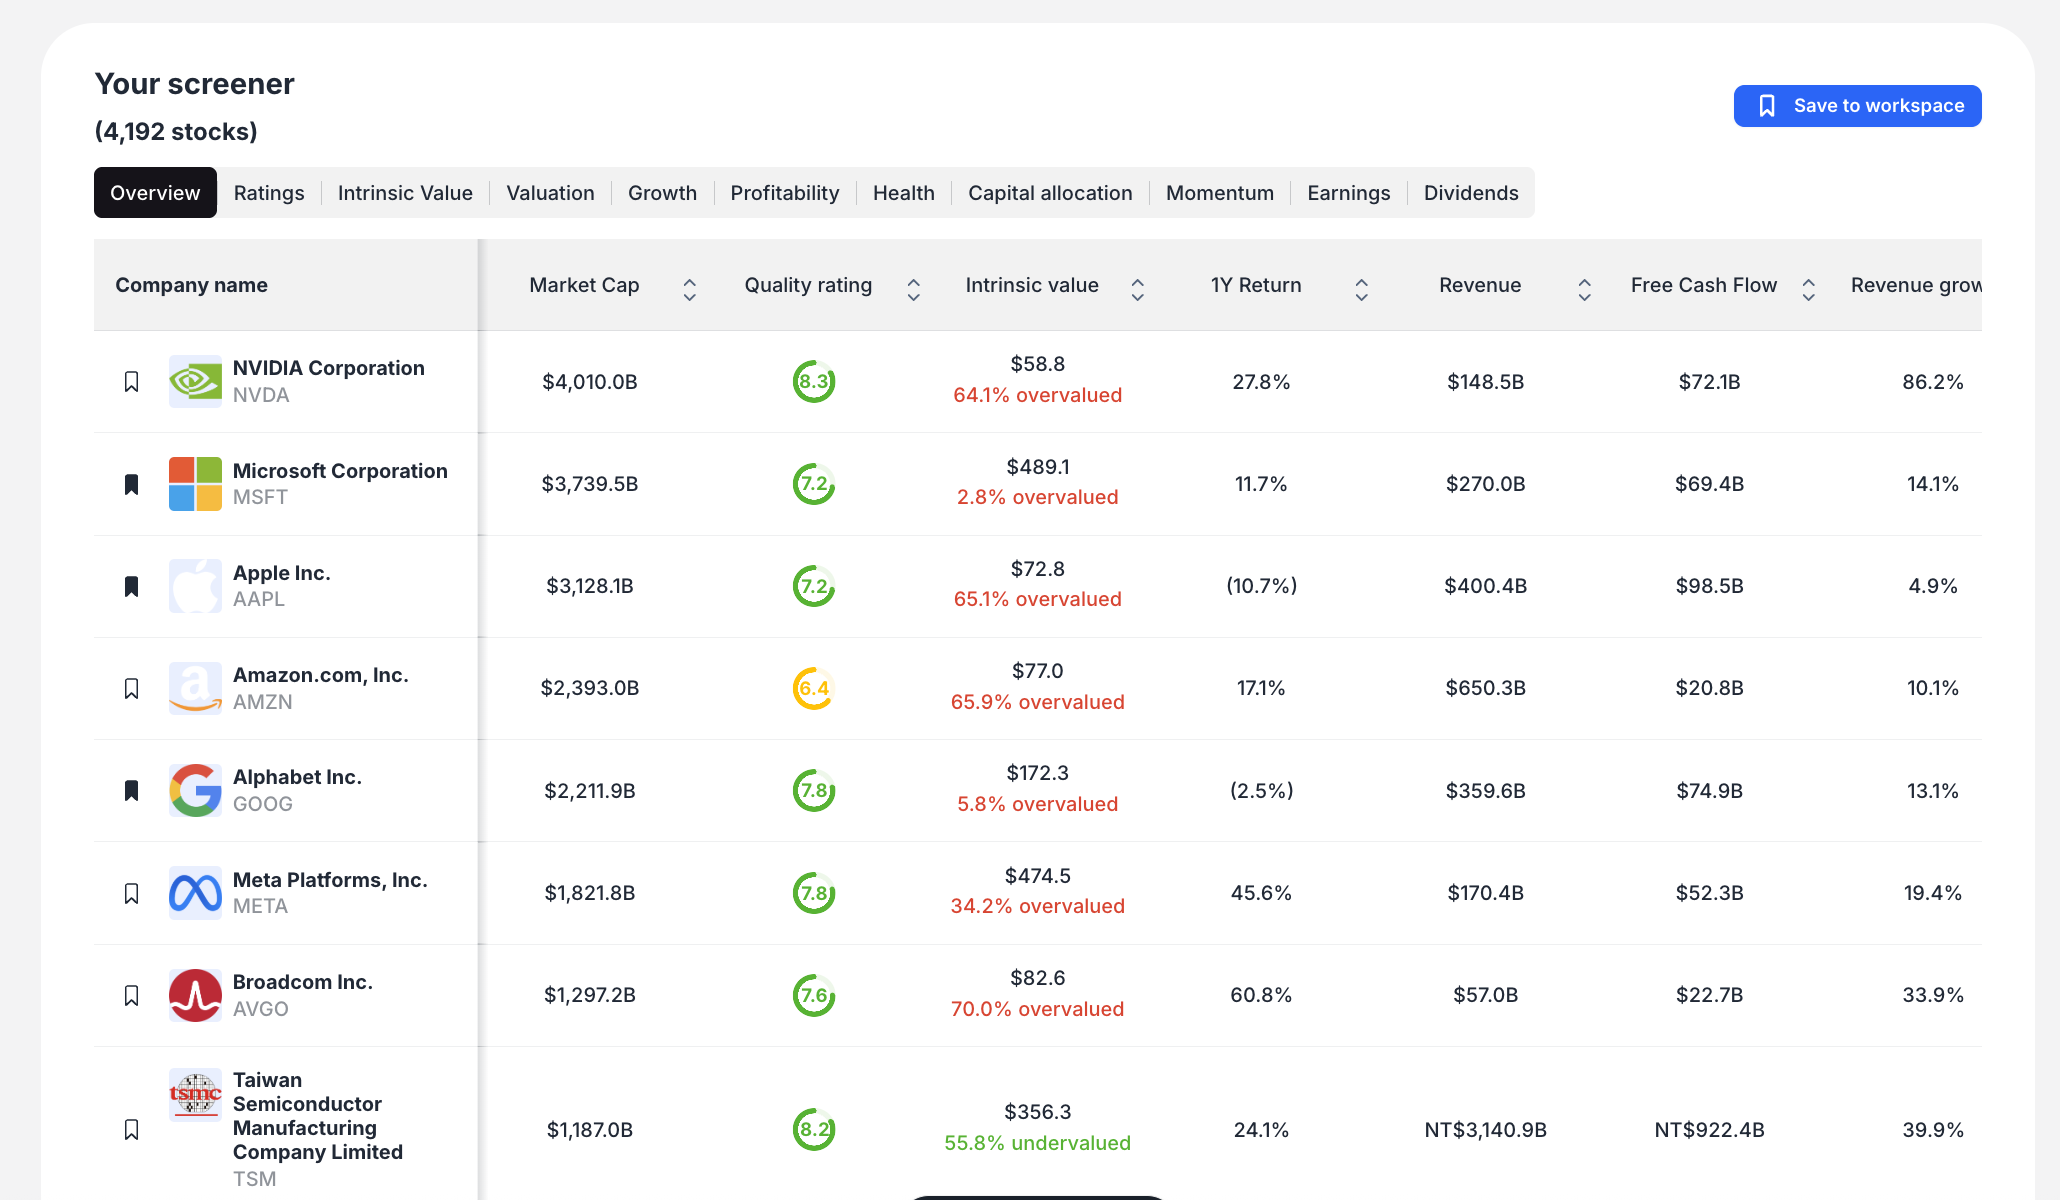
- Overview: Basic company information and key metrics
- Ratings: ValueSense quality, growth, and health ratings
- Intrinsic Value: Valuation analysis and fair value estimates
- Growth: Revenue and earnings growth metrics
- Profitability: Margin analysis and return metrics
- Health: Financial stability indicators
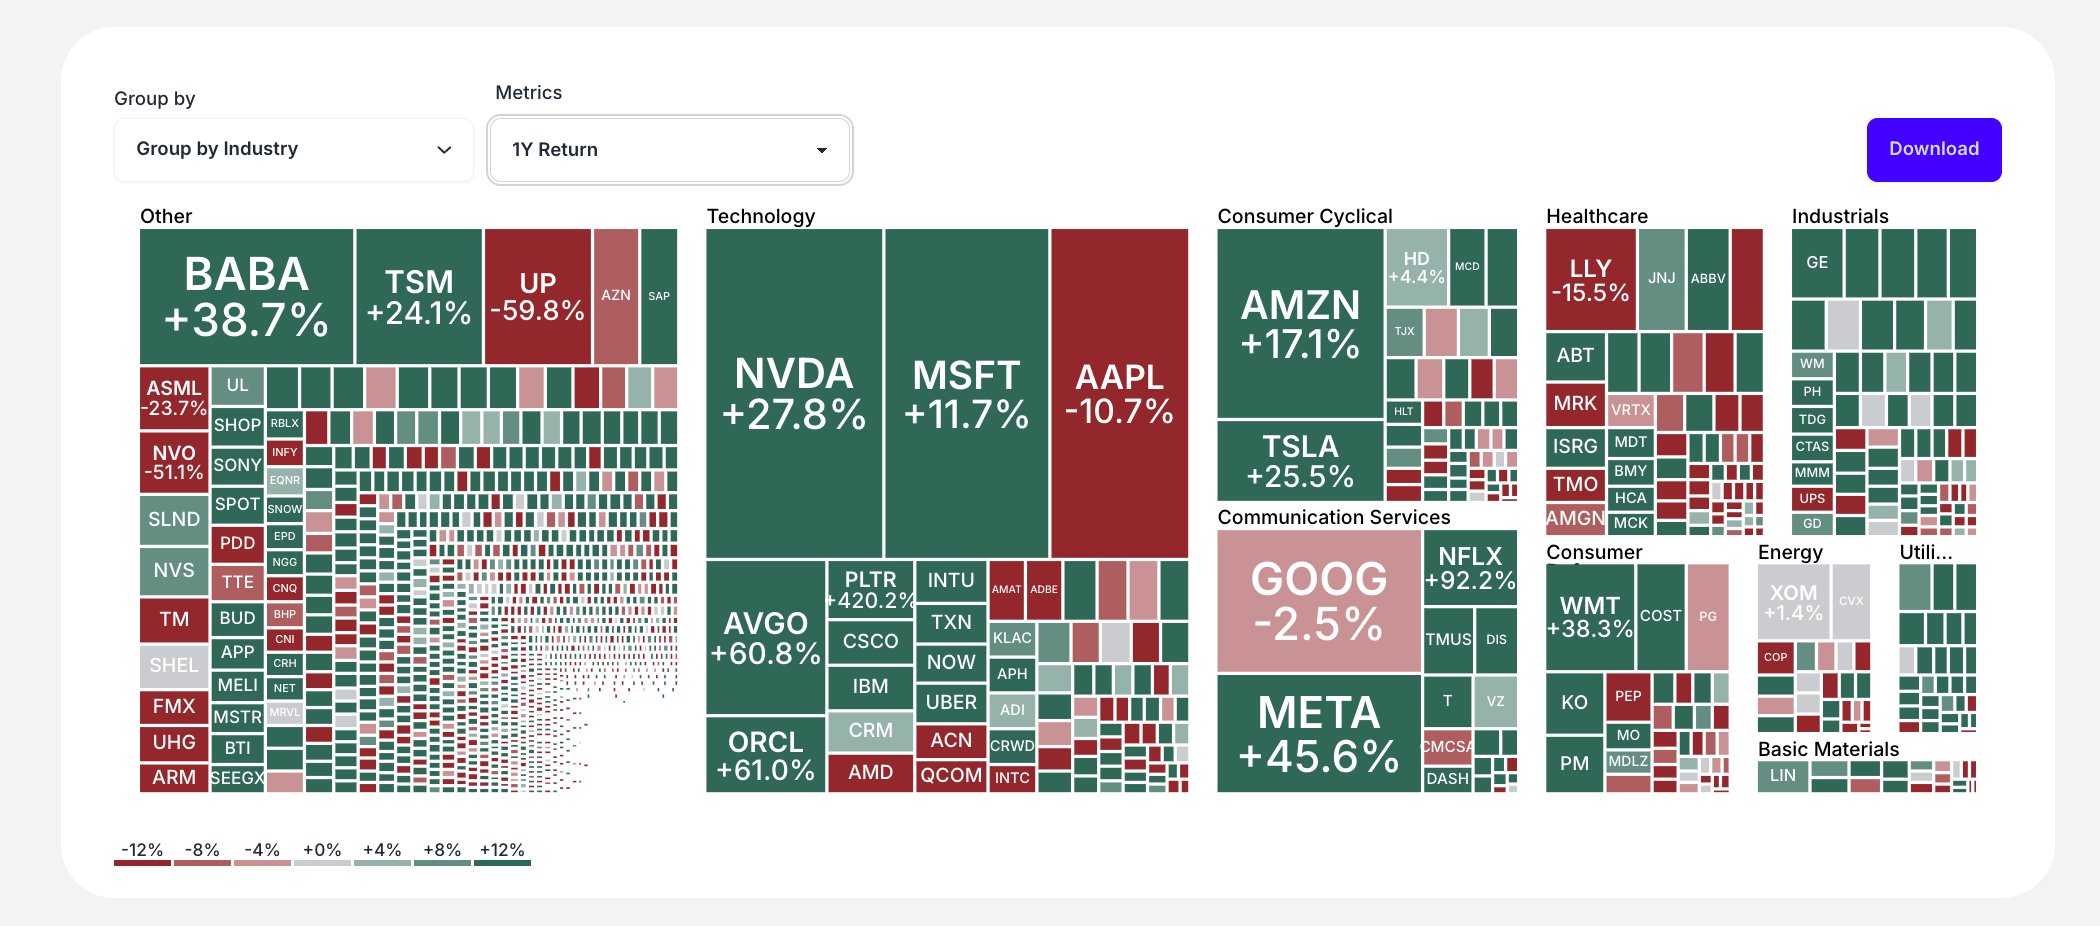
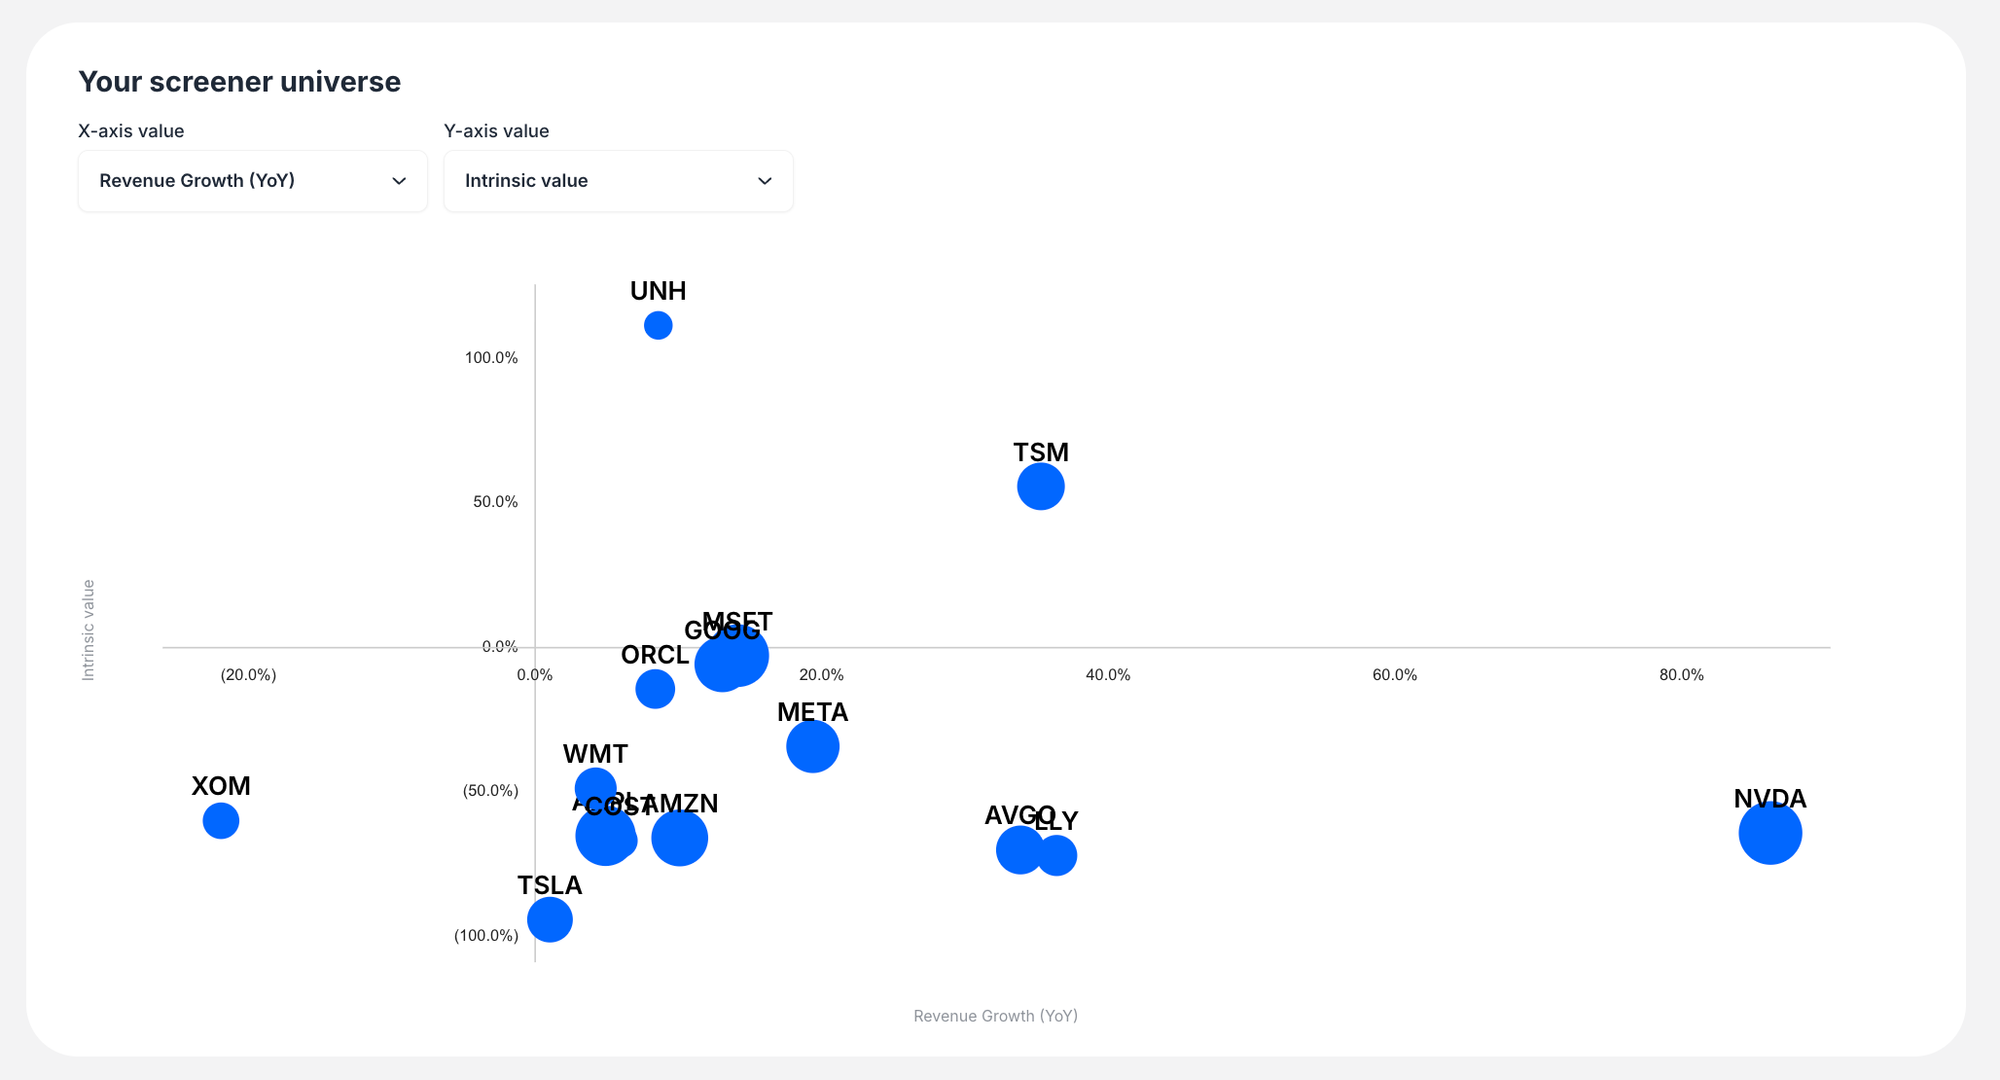
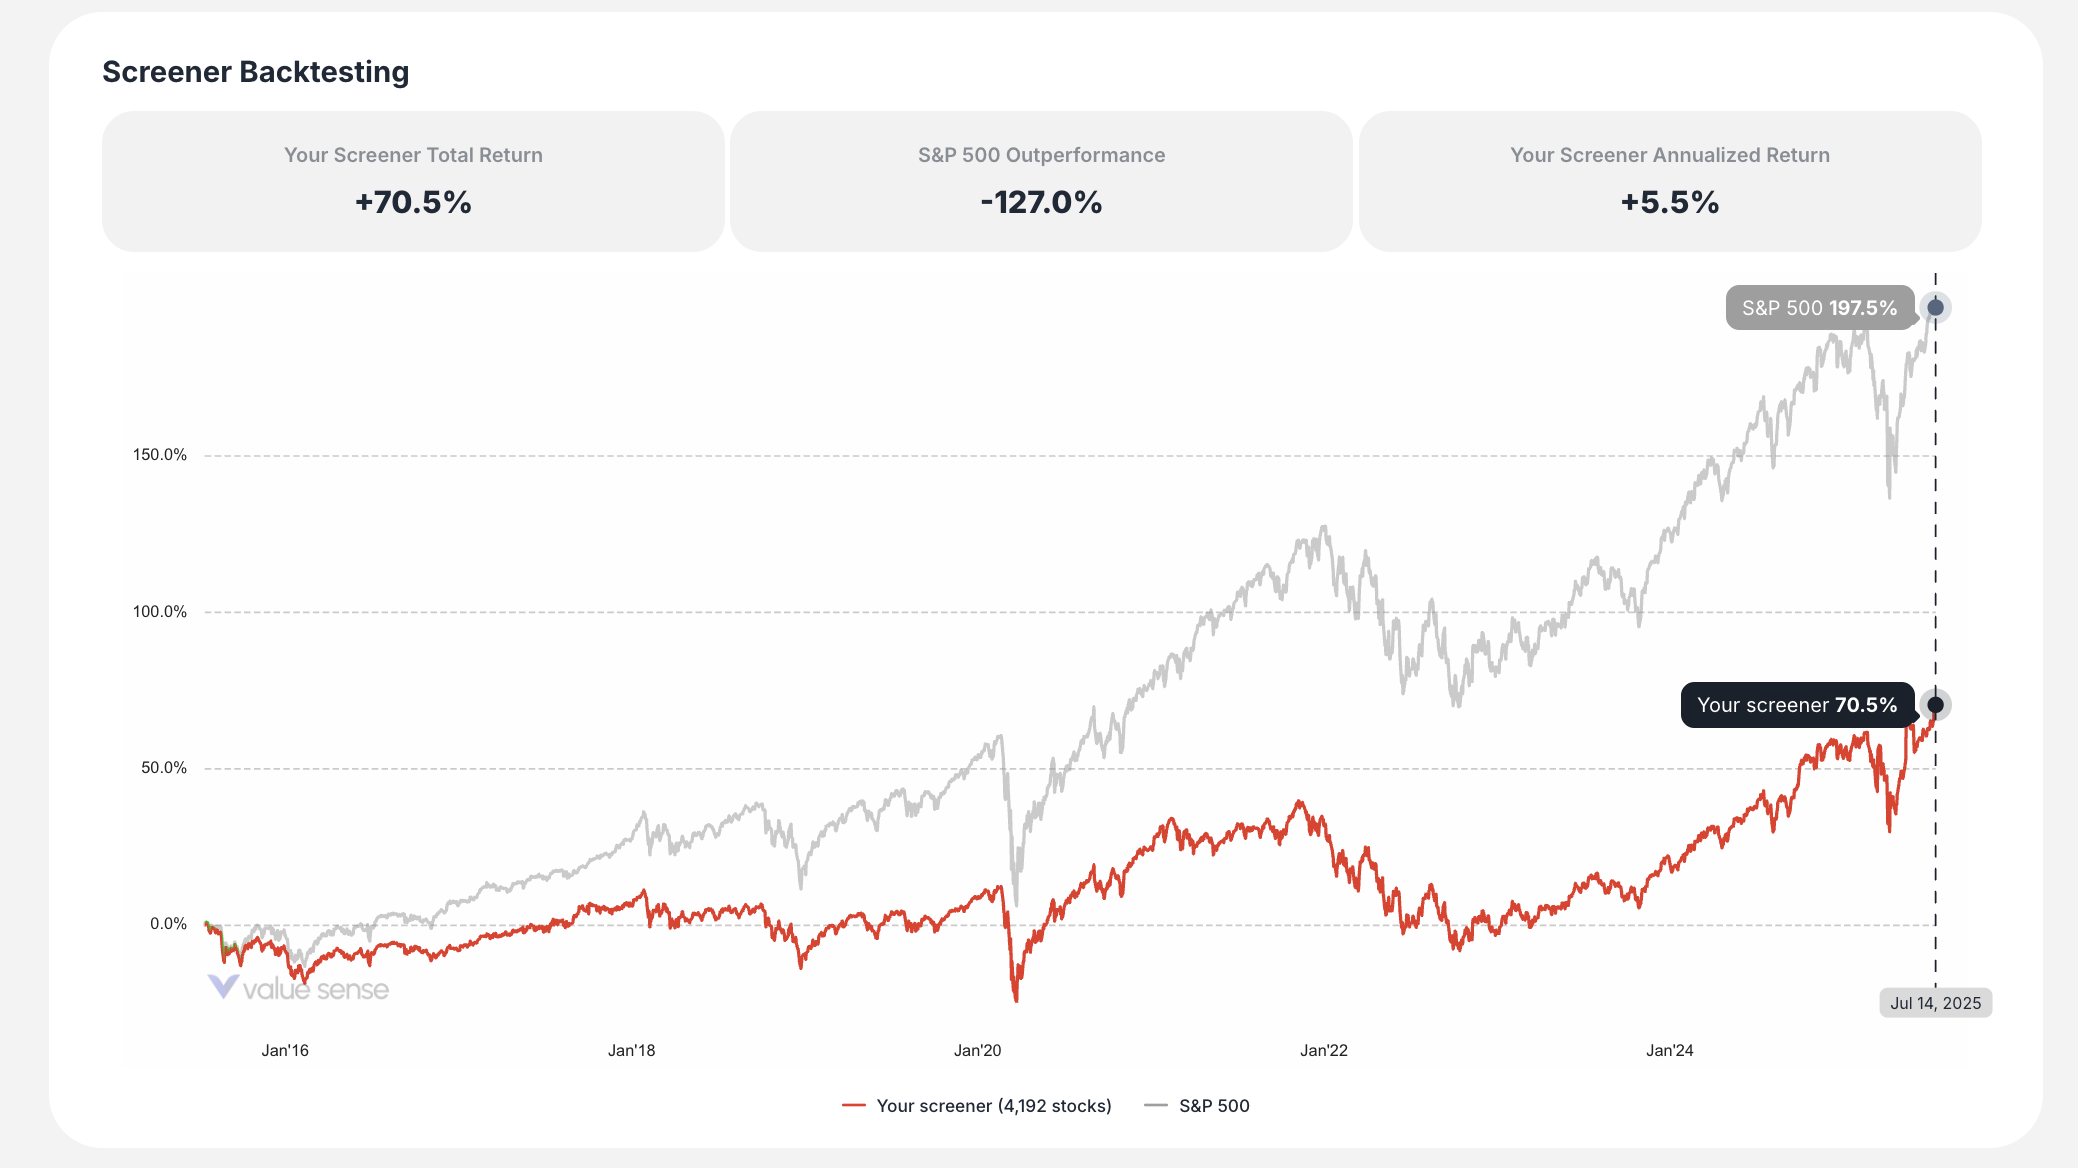
Visual Analysis Tools
- Heat Map: Color-coded performance visualization grouped by industry
- Scatter Plot: Two-dimensional analysis to identify relationships between metrics
- Backtesting Chart: Historical performance comparison of your screener vs. S&P 500
Workspace
Your Workspace is ValueSense's central hub for organizing and managing all your saved research and analysis. Think of it as your personal investment research library where you can store, organize, and revisit all your work in one convenient location.

Accessing Your Workspace
Simply click "Workspace" in the main navigation bar at the top of any page. It's always accessible and serves as your home base for all saved content.
What You Can Save in Your Workspace
The Workspace organizes your content into five main categories:
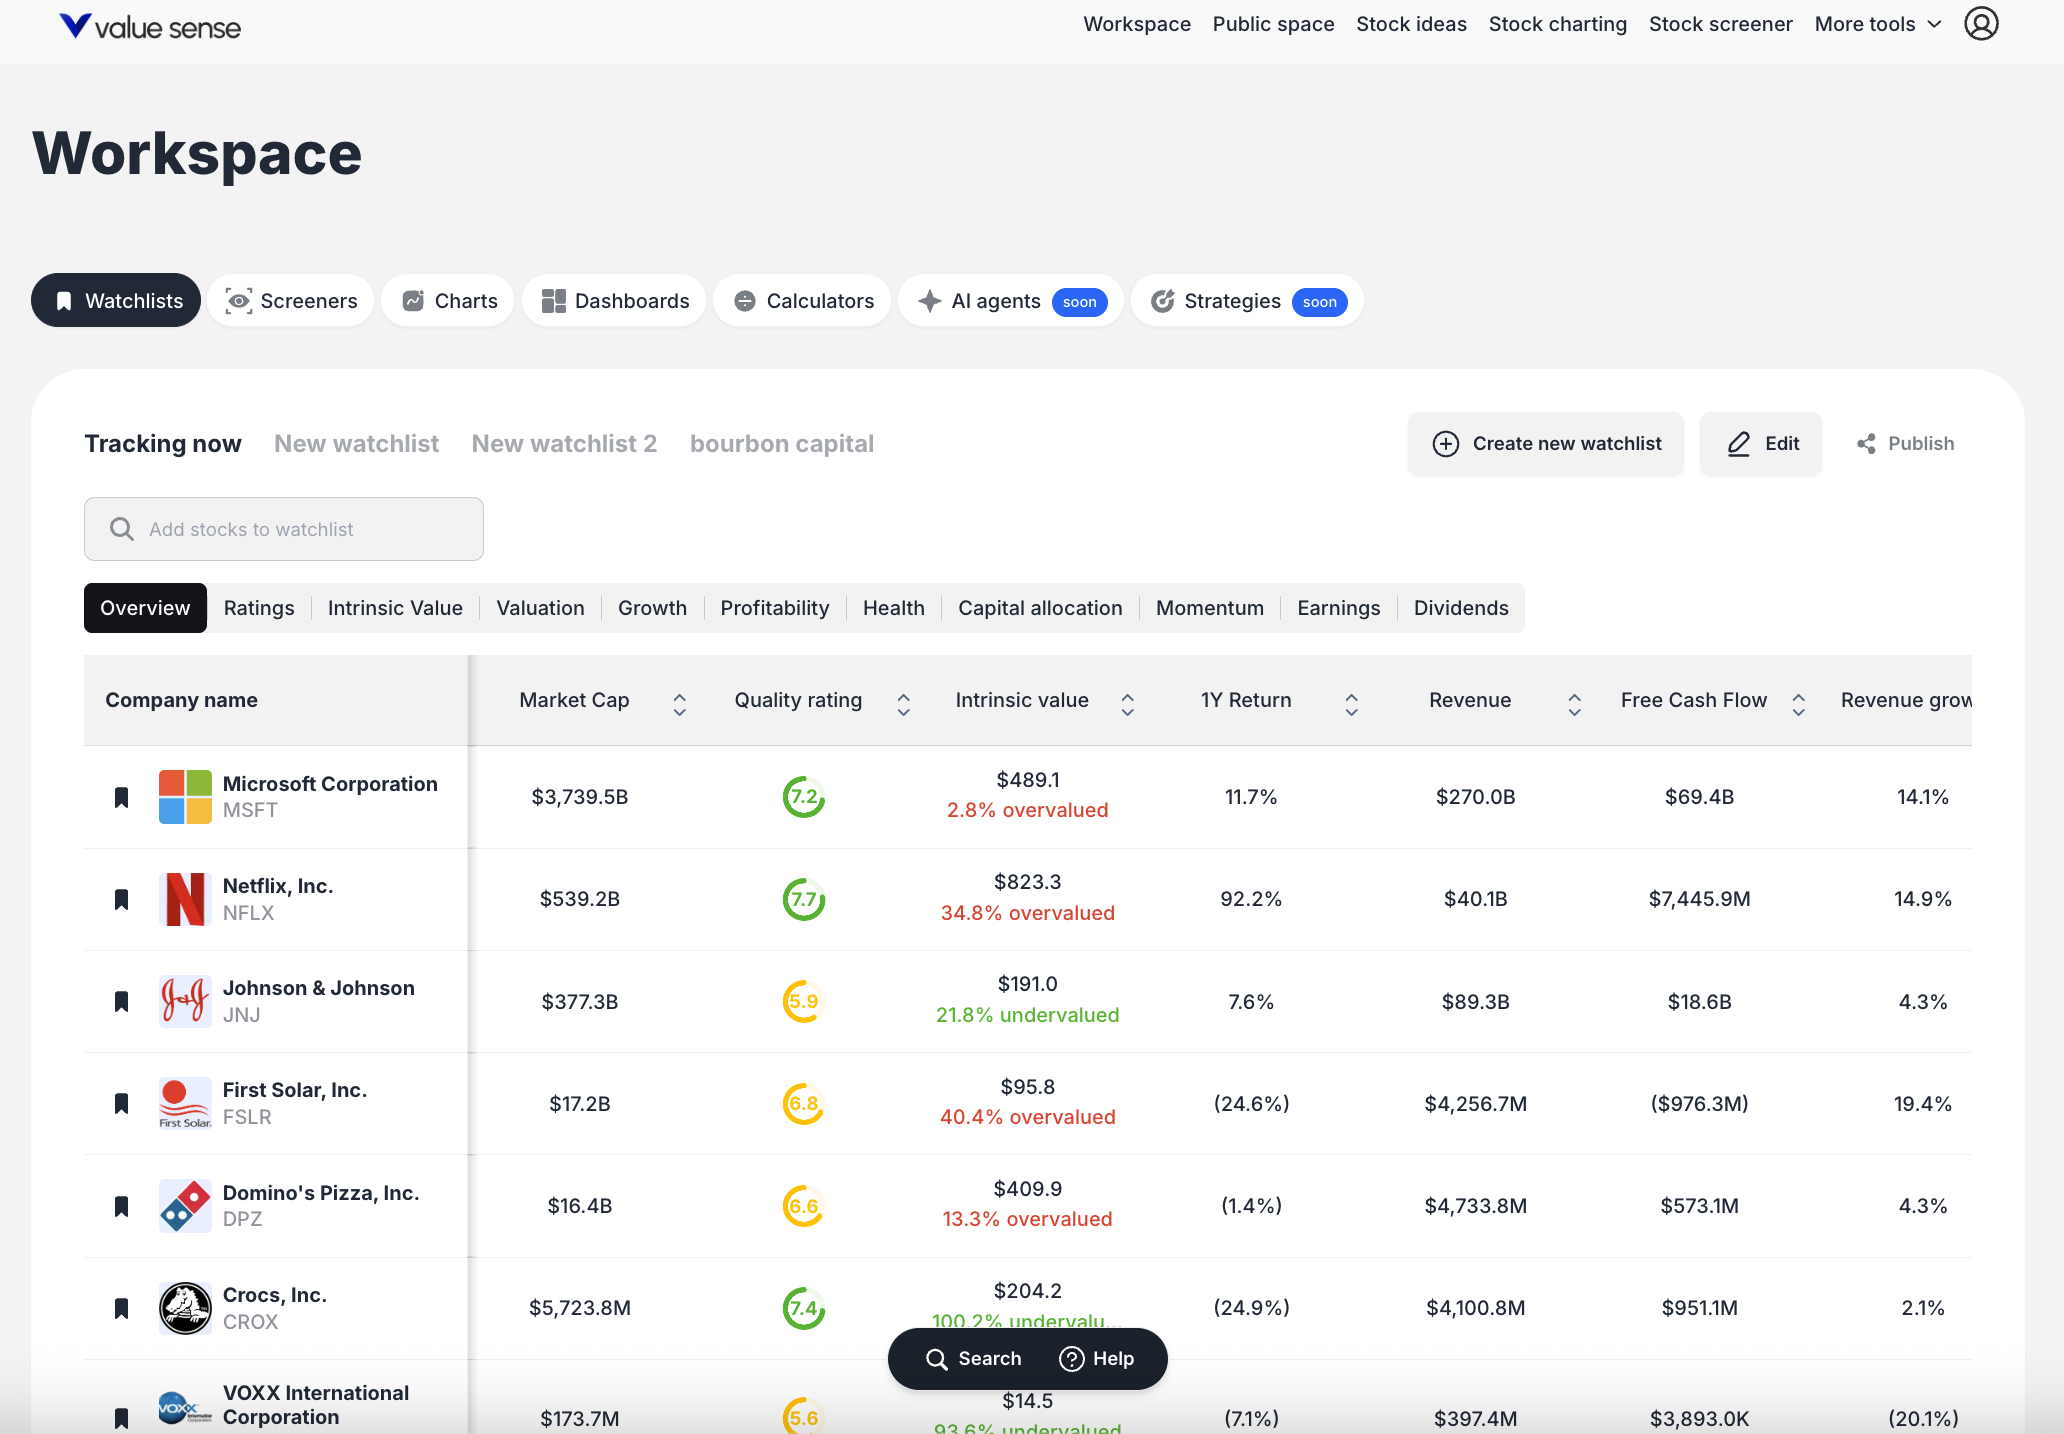
Watchlists Create and manage custom lists of stocks you're tracking. Perfect for monitoring potential investments, portfolio holdings, or companies in specific sectors. You can create multiple named watchlists (like "Tracking now," "Tech stocks," or "Dividend champions") and view key metrics for each stock.
Screeners Save your custom stock screening criteria for reuse. Whether you've built a screen for "Undervalued Small Cap US Stocks" or "High-Quality Dividend Growers," you can save these filters and run them again anytime market conditions change.
Charts Store individual financial charts you've created, such as "AAPL iPhone revenue trends" or "CROX profit margins analysis." Each saved chart preserves your specific metrics, timeframes, and visualization settings.
Dashboards Build comprehensive analysis dashboards that combine multiple charts and data points about specific companies or themes. For example, create a "Why I think CROX is a buy" dashboard with all relevant financial metrics and visualizations.
Calculators Save the results of your financial calculations, such as Reverse DCF analyses for specific companies. This lets you reference your valuation work and assumptions over time.
How to Navigate Your Workspace
Tab-Based Organization: Use the category tabs at the top (Watchlists, Screeners, Charts, Dashboards, Calculators) to switch between different types of saved content.
Card-Based Display: Each saved item appears as a card showing its title and key details, making it easy to identify and access your work.
Multiple Watchlists: Within the Watchlists section, you can create and switch between multiple named lists using the sub-tabs.
Key Workspace Features
Create New Content: Each section includes a "Create new..." button to start building new watchlists, screeners, charts, or dashboards directly from your workspace.
Publishing & Sharing: Use the publish feature to share your analysis with others or keep it private for your own reference.
Quick Access: All your saved work is just two clicks away - navigate to Workspace, then click on any saved item to resume your analysis.
Your Workspace transforms scattered research into an organized, accessible system that helps you make better investment decisions by keeping all your analysis in one place.
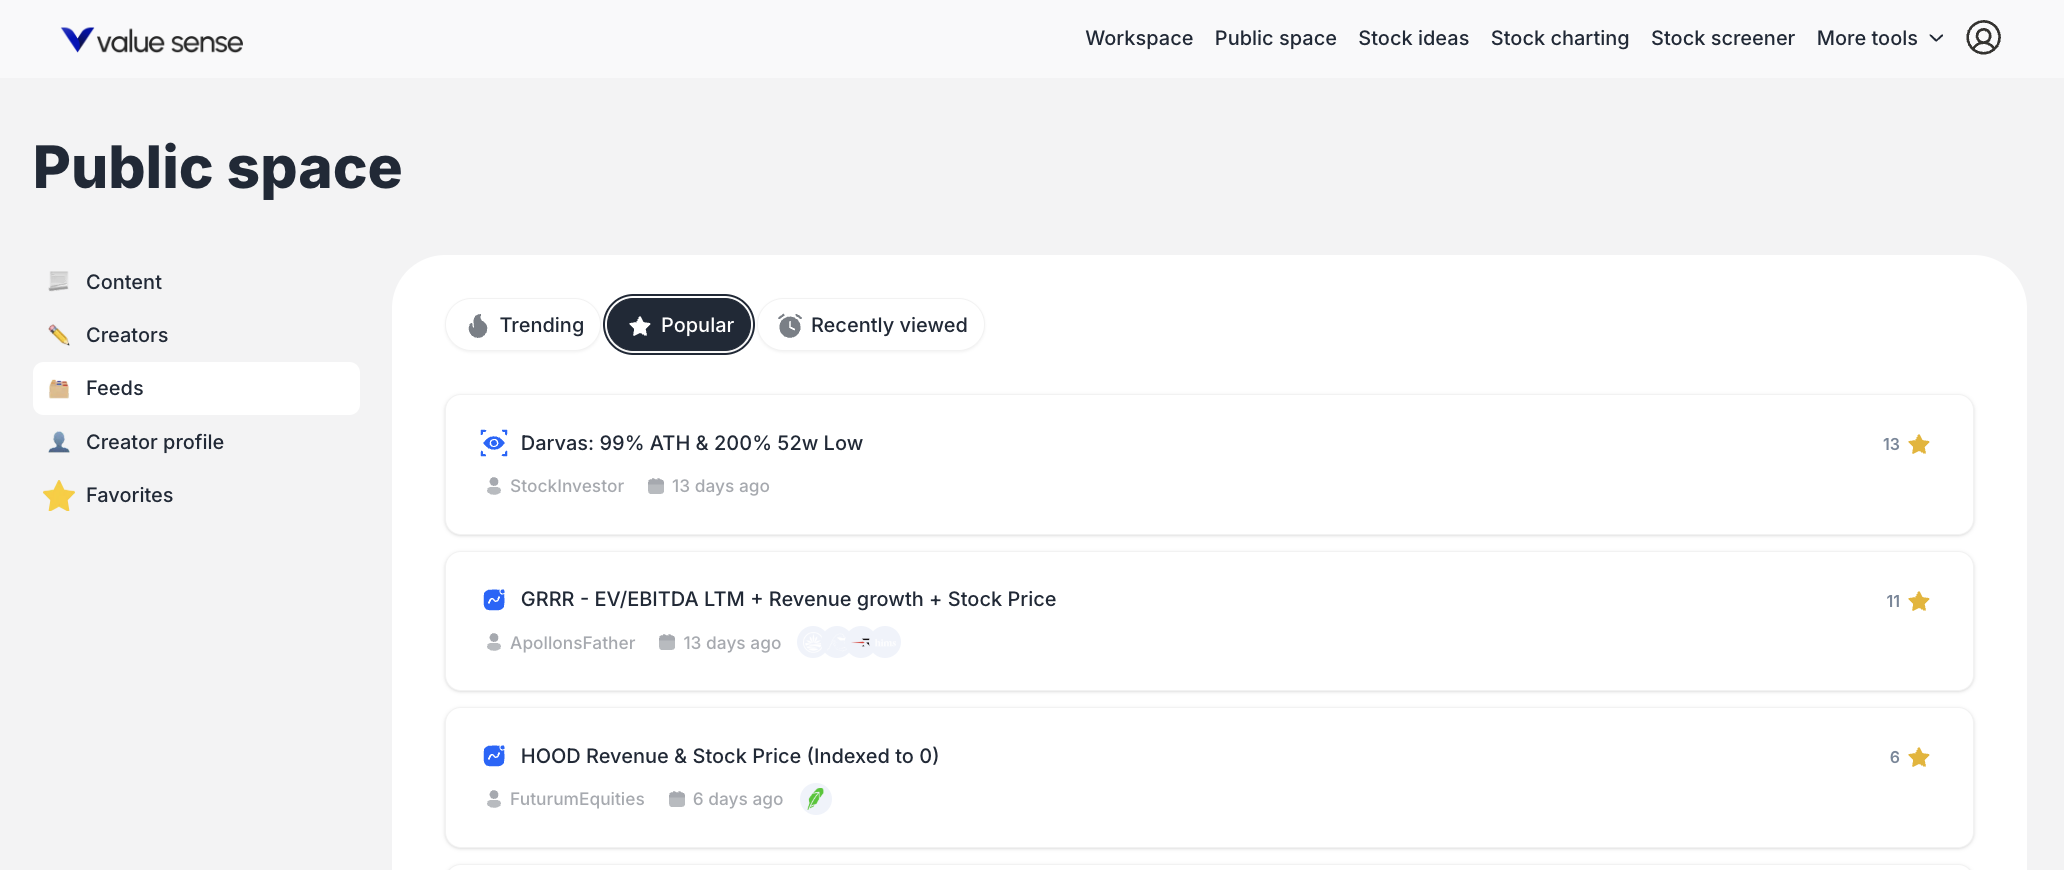
Public space
ValueSense's Public Space is a community hub where users share their investment research and analysis with others. It's where your private workspace analysis can become public insights that benefit the entire ValueSense community.

Accessing Public Space
Click "Public space" in the main navigation bar, located between "Workspace" and "Stock ideas." You can also access it directly after publishing content from your workspace.
What's Available in Public Space
The Public Space is organized into several key sections:
Content Feed Browse all publicly shared analysis from the ValueSense community, including:
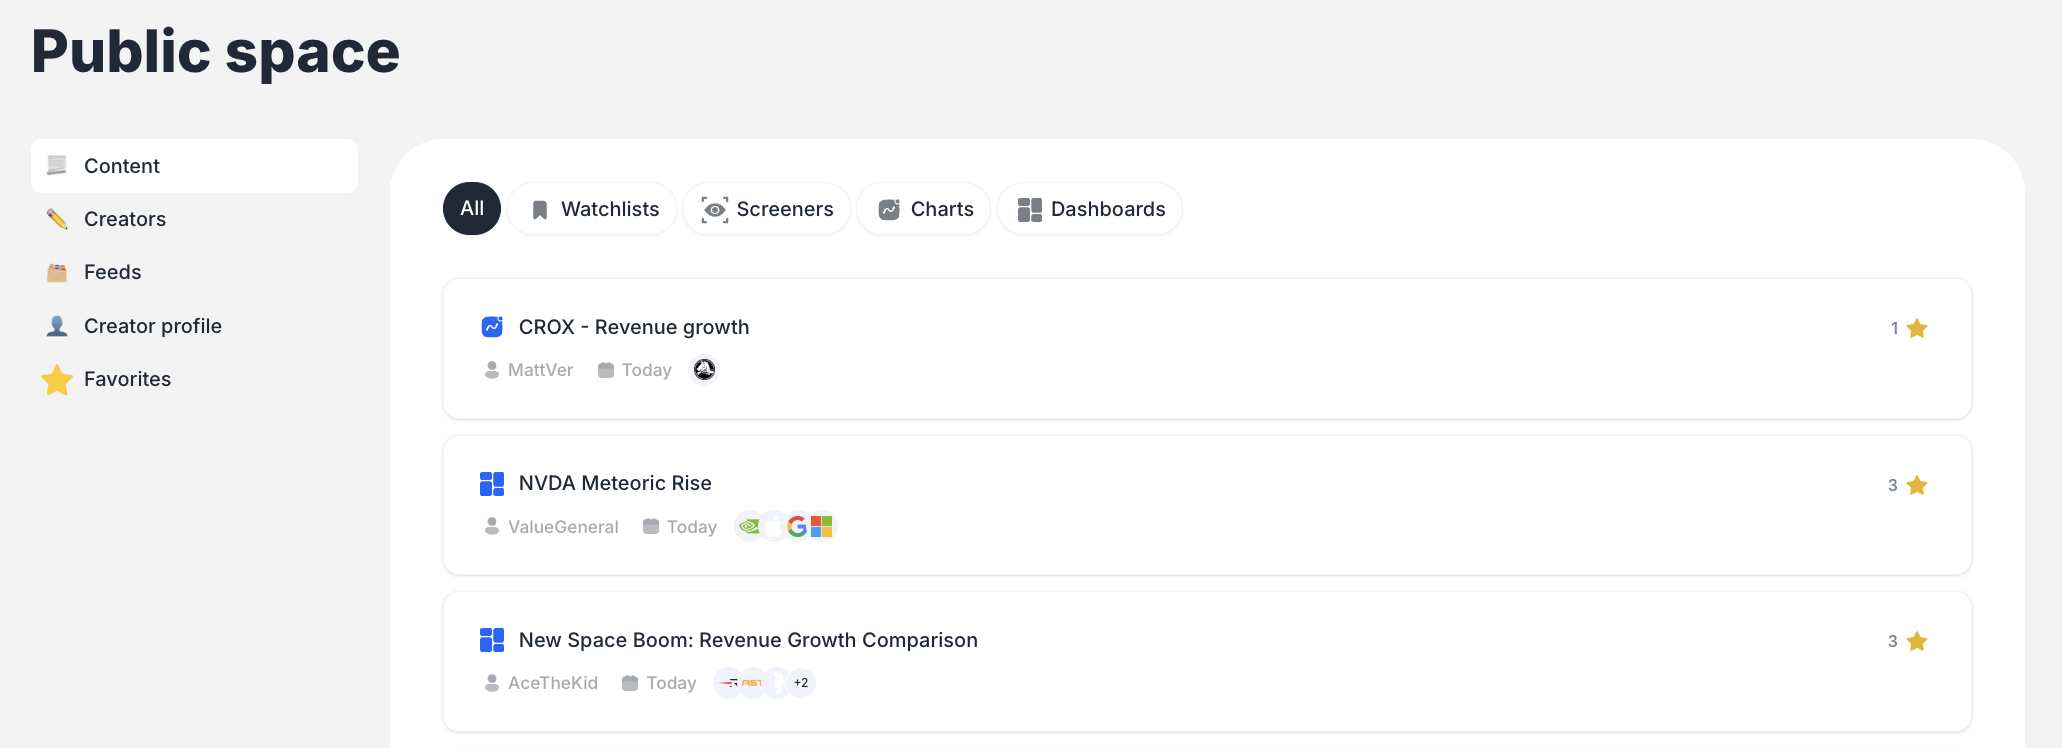
- Charts: Financial visualizations and trend analysis
- Screeners: Custom stock screening criteria
- Watchlists: Curated lists of stocks with specific themes
- Dashboards: Comprehensive analysis combining multiple data points
Creators Directory Discover and follow users who consistently publish valuable analysis. Each creator profile shows their bio, total favorites received, and all published content.
Personal Collections
- Your Creator Profile: Your public portfolio showing all content you've shared
- Favorites: Content you've starred for later reference
How to Share Your Analysis
Publishing from Workspace
- In your Workspace, find any saved chart, screener, watchlist, or dashboard
- Click the "Publish" button on the content card
- Confirm the title in the "Publish to Community" dialog
- Click "Save" to make it public
- Your content immediately appears in the Public Space feed
Managing Your Public Content Once published, your content appears in your Creator Profile where others can discover and favorite your work.
Discovering Valuable Content
Browse and Filter
- Use the "All" tab to see all content types
- Filter by specific content types: Charts, Screeners, Watchlists, Dashboards
- Sort by "Popular" to see community favorites
- Check "Trending" for recently active content
Follow Creators Visit the Creators section to find users whose analysis style matches your interests. Follow them to get their content in your personalized feed.
Save What You Like Click the star icon on any content to:
- Show appreciation to the creator (public "like")
- Save it to your personal Favorites collection for easy access