
11 Best High Quality Stock Picks for November 2025
Welcome to the Value Sense Blog, your resource for insights on the stock market! At Value Sense, we focus on intrinsic value tools and offer stock ideas with undervalued companies. Dive into our research products and learn more about our unique approach at valuesense.io
Explore diverse stock ideas covering technology, healthcare, and commodities sectors. Our insights are crafted to help investors spot opportunities in undervalued growth stocks, enhancing potential returns. Visit us to see evaluations and in-depth market research.
Market Overview & Selection Criteria
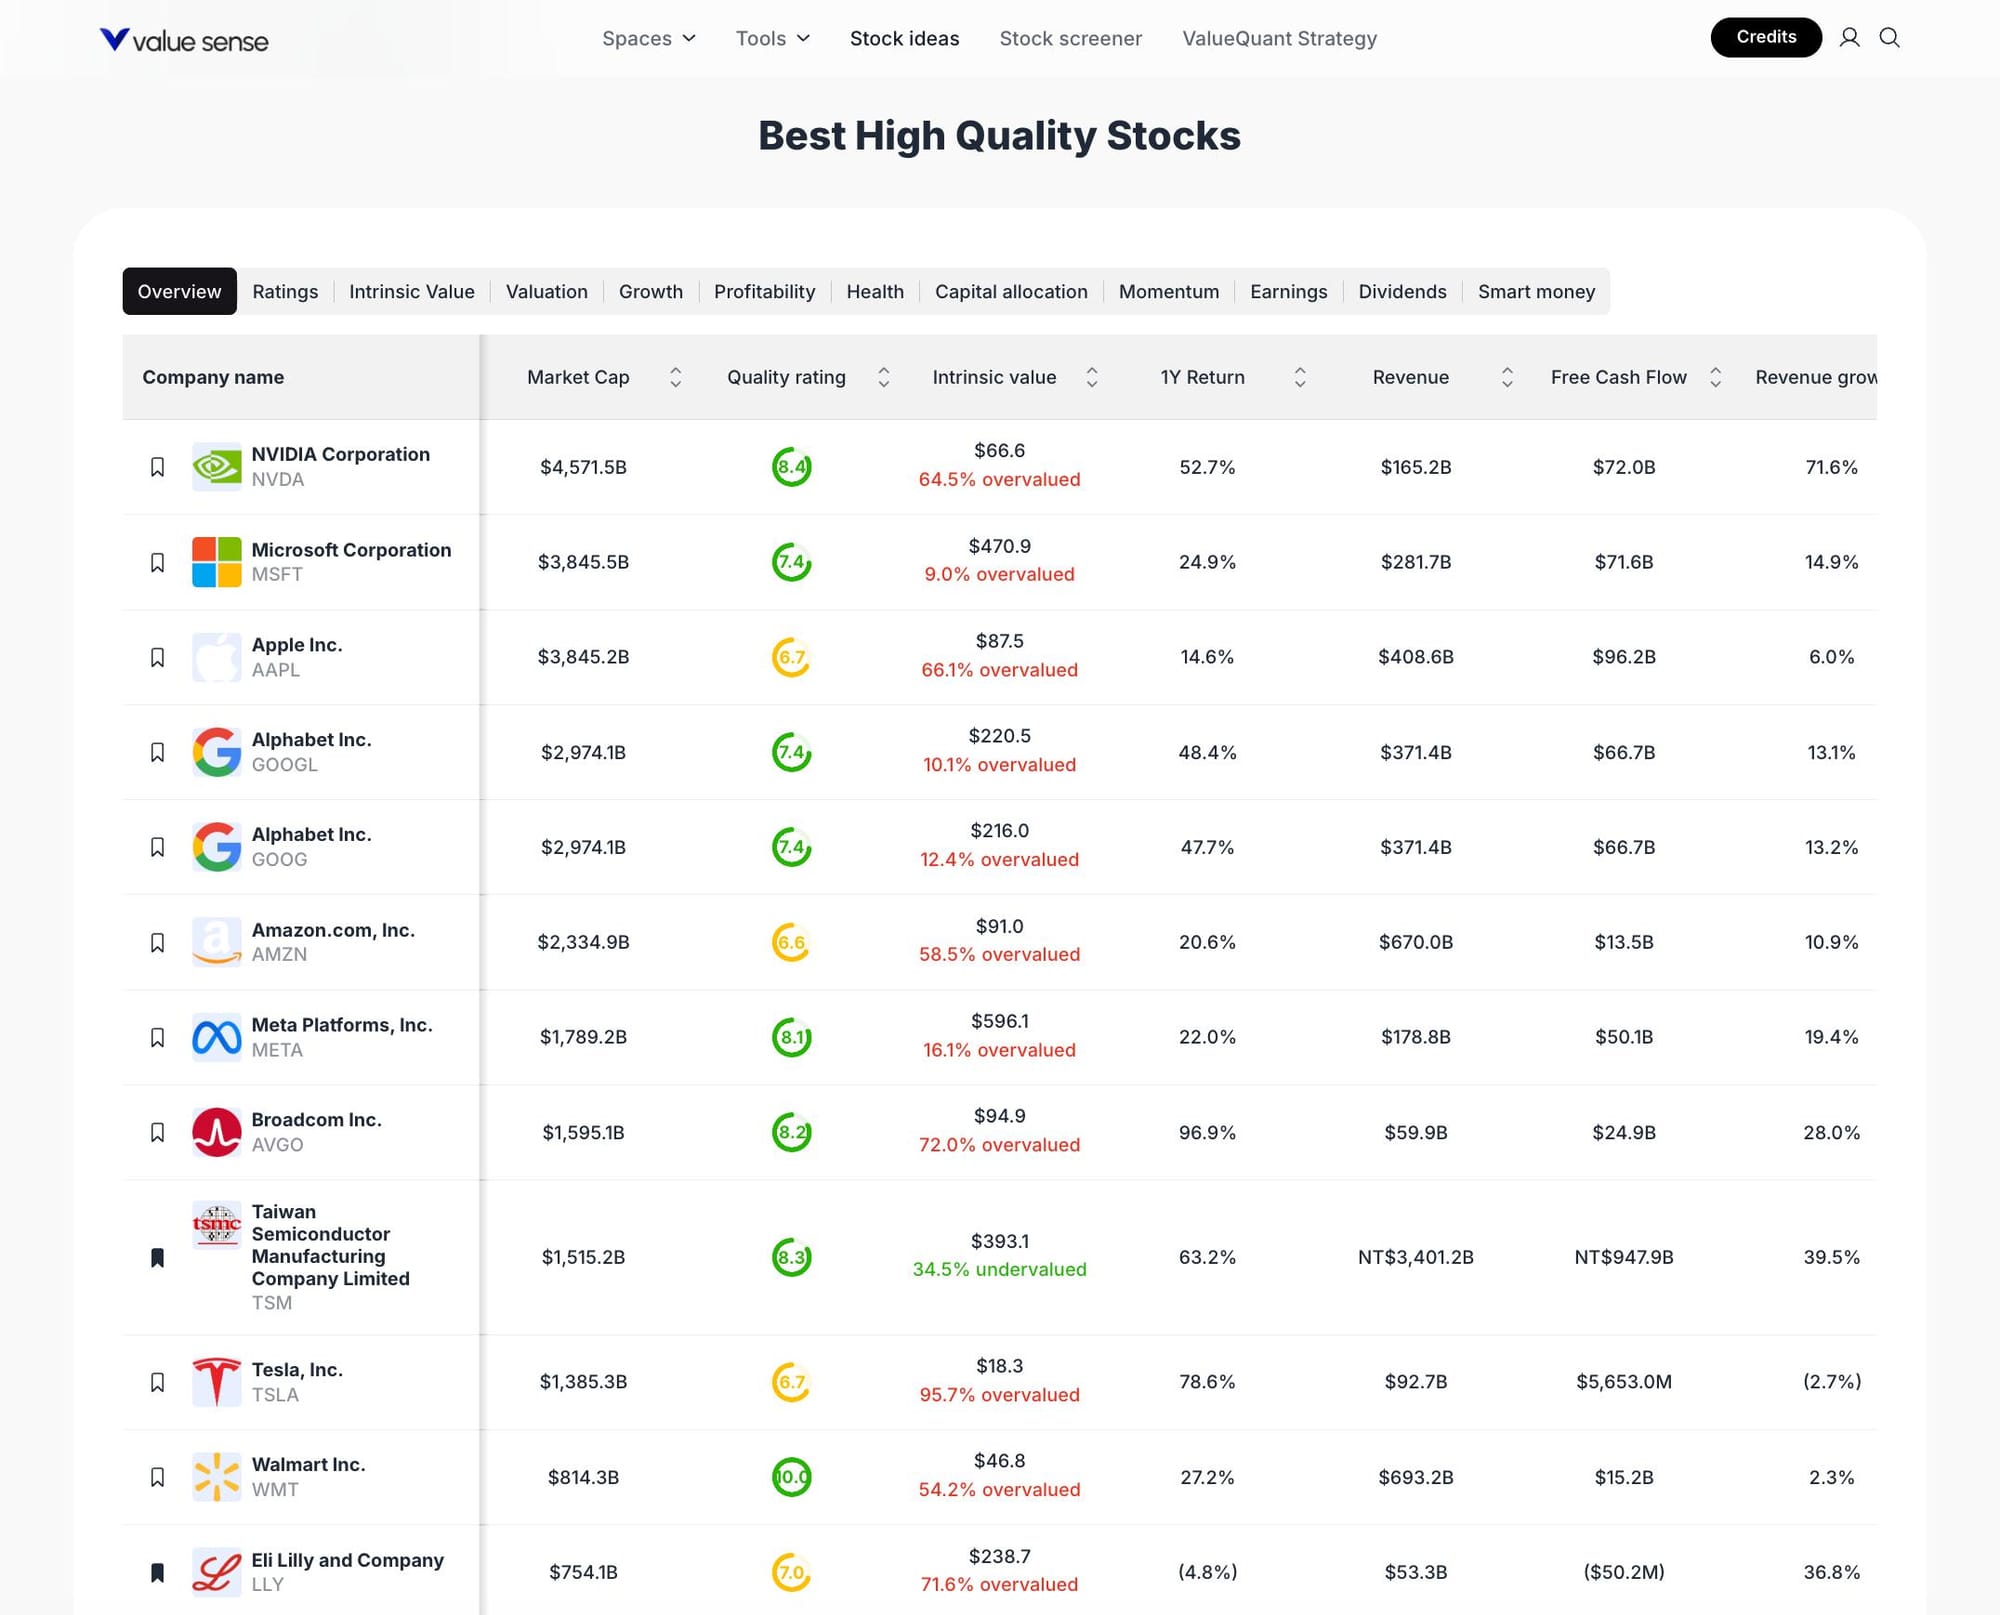
The 2025 market landscape is shaped by rapid innovation, resilient consumer demand, and sector rotation into quality. Our stock selection methodology emphasizes market leadership, consistent profitability, and robust free cash flow. Each stock is evaluated using ValueSense’s proprietary quality rating, intrinsic value analysis, and growth metrics. This approach ensures a diversified watchlist of companies with strong fundamentals and sector representation.
Featured Stock Analysis
Stock #1: NVIDIA Corporation (NVDA)
Quick Stats Table
| Metric | Value |
|---|---|
| Current Price | Not shown |
| Market Cap | $4,571.5B |
| Quality Rating | 6.4 |
| Intrinsic Value | $66.6 (64.5% overvalued) |
| 1Y Return | 52.7% |
| Revenue | $165.2B |
| Free Cash Flow | $72.0B |
| Revenue Growth | 71.6% |
| Sector | Technology |
Investment Thesis
NVIDIA stands at the forefront of the AI and semiconductor revolution, driving exponential revenue growth (71.6%) and robust free cash flow. Its dominant position in GPU technology powers advancements in data centers, gaming, and AI infrastructure. Despite being 64.5% overvalued relative to intrinsic value, NVIDIA’s quality rating of 6.4 and a massive $4.57T market cap reflect investor confidence in its long-term prospects.
The company’s 52.7% one-year return underscores its momentum, fueled by surging demand for AI chips and cloud computing. NVIDIA’s ability to convert innovation into cash flow ($72B) positions it as a core holding for growth-oriented portfolios.
Key Catalysts
- AI adoption across industries
- Expansion in data center and automotive markets
- Continued product innovation and ecosystem dominance
Risk Factors
- High valuation premium
- Competitive pressures from other chipmakers
- Cyclical demand in technology hardware
Stock #2: Microsoft Corporation (MSFT)
Quick Stats Table
| Metric | Value |
|---|---|
| Current Price | Not shown |
| Market Cap | $3,845.5B |
| Quality Rating | 7.4 |
| Intrinsic Value | $470.9 (9.0% overvalued) |
| 1Y Return | 24.9% |
| Revenue | $281.7B |
| Free Cash Flow | $71.6B |
| Revenue Growth | 14.9% |
| Sector | Technology |
Investment Thesis
Microsoft’s diversified business model, spanning cloud, productivity, and AI, delivers consistent revenue and free cash flow. With a quality rating of 7.4 and only 9% overvaluation, Microsoft offers a blend of stability and growth. Its $3.85T market cap and $71.6B in free cash flow highlight operational excellence and capital allocation discipline.
The company’s Azure cloud platform continues to gain market share, while investments in AI and enterprise software reinforce its competitive moat. Microsoft’s 24.9% annual return demonstrates resilience amid market volatility.
Key Catalysts
- Growth in cloud computing and AI services
- Expansion of enterprise software ecosystem
- Strong balance sheet enabling strategic acquisitions
Risk Factors
- Regulatory scrutiny in global markets
- Slower growth in legacy segments
- High dependency on enterprise IT spending
Stock #3: Apple Inc. (AAPL)
Quick Stats Table
| Metric | Value |
|---|---|
| Current Price | Not shown |
| Market Cap | $3,845.2B |
| Quality Rating | 6.7 |
| Intrinsic Value | $87.5 (66.1% overvalued) |
| 1Y Return | 14.6% |
| Revenue | $408.6B |
| Free Cash Flow | $96.2B |
| Revenue Growth | 6.0% |
| Sector | Technology |
Investment Thesis
Apple’s ecosystem strength and brand loyalty drive consistent cash generation, with $96.2B in free cash flow and a $3.85T market cap. Despite a 66.1% overvaluation relative to intrinsic value, Apple’s quality rating of 6.7 and steady 14.6% annual return reflect its enduring appeal.
The company’s focus on services and wearables diversifies revenue streams beyond hardware. Apple’s disciplined capital allocation and innovation pipeline support long-term shareholder value.
Key Catalysts
- Expansion of services and subscription revenue
- New product launches and ecosystem integration
- Global brand strength and pricing power
Risk Factors
- Slower hardware upgrade cycles
- Regulatory and supply chain risks
- High valuation relative to growth
Stock #4: Alphabet Inc. (GOOGL)
Quick Stats Table
| Metric | Value |
|---|---|
| Current Price | Not shown |
| Market Cap | $2,974.1B |
| Quality Rating | 7.4 |
| Intrinsic Value | $220.5 (10.1% overvalued) |
| 1Y Return | 48.4% |
| Revenue | $371.4B |
| Free Cash Flow | $66.7B |
| Revenue Growth | 13.1% |
| Sector | Technology |
Investment Thesis
Alphabet’s dominance in digital advertising and cloud computing underpins its $2.97T market cap and $66.7B in free cash flow. With a quality rating of 7.4 and only 10.1% overvaluation, Alphabet offers a compelling mix of growth and profitability. The company’s 48.4% one-year return highlights its strong execution and innovation in AI and cloud services.
Alphabet’s diversified business model, including YouTube and Google Cloud, provides resilience against market shifts. Its focus on AI integration and new monetization avenues supports long-term growth.
Key Catalysts
- AI-driven product innovation
- Growth in Google Cloud and YouTube
- Expanding digital advertising market
Risk Factors
- Regulatory challenges globally
- Competition in cloud and digital ads
- High R&D spending
Stock #5: Alphabet Inc. (GOOG)
Quick Stats Table
| Metric | Value |
|---|---|
| Current Price | Not shown |
| Market Cap | $2,974.1B |
| Quality Rating | 7.4 |
| Intrinsic Value | $216.0 (12.4% overvalued) |
| 1Y Return | 47.7% |
| Revenue | $371.4B |
| Free Cash Flow | $66.7B |
| Revenue Growth | 13.2% |
| Sector | Technology |
Investment Thesis
GOOG shares represent the same economic interest as GOOGL, with minor differences in voting rights. The financial and operational metrics are identical, offering investors a choice based on liquidity and governance preferences. The stock’s 47.7% annual return and 7.4 quality rating reinforce Alphabet’s leadership in digital innovation.
Key Catalysts
- Same as GOOGL
Risk Factors
- Same as GOOGL
Stock #6: Amazon.com, Inc. (AMZN)
Quick Stats Table
| Metric | Value |
|---|---|
| Current Price | Not shown |
| Market Cap | $2,334.9B |
| Quality Rating | 6.9 |
| Intrinsic Value | $91.0 (58.5% overvalued) |
| 1Y Return | 20.6% |
| Revenue | $670.0B |
| Free Cash Flow | $13.5B |
| Revenue Growth | 10.9% |
| Sector | Technology |
Investment Thesis
Amazon’s scale in e-commerce and cloud computing drives its $2.33T market cap and $670B in revenue. With a quality rating of 6.9 and 20.6% annual return, Amazon remains a growth engine, though currently 58.5% overvalued. AWS continues to be a profit center, while retail and advertising segments provide additional upside.
Amazon’s ability to innovate in logistics and digital services supports its long-term growth trajectory, despite near-term valuation concerns.
Key Catalysts
- Expansion of AWS and cloud services
- Growth in advertising and third-party marketplace
- Logistics and automation advancements
Risk Factors
- Margin pressure in retail
- Regulatory scrutiny
- High valuation relative to earnings
Stock #7: Meta Platforms, Inc. (META)
Quick Stats Table
| Metric | Value |
|---|---|
| Current Price | Not shown |
| Market Cap | $1,789.2B |
| Quality Rating | 8.1 |
| Intrinsic Value | $596.1 (16.1% overvalued) |
| 1Y Return | 22.0% |
| Revenue | $178.8B |
| Free Cash Flow | $50.1B |
| Revenue Growth | 19.4% |
| Sector | Technology |
Investment Thesis
Meta’s leadership in social media and digital advertising is reflected in its $1.79T market cap and $50.1B free cash flow. With the highest quality rating on this list (8.1) and only 16.1% overvaluation, Meta offers a strong balance of growth and profitability. Its 22% annual return and 19.4% revenue growth highlight effective execution and innovation in AI and virtual reality.
Meta’s focus on monetizing its platforms and expanding into the metaverse provides long-term optionality.
Key Catalysts
- Growth in digital advertising
- AI-driven content and engagement
- Expansion into virtual/augmented reality
Risk Factors
- Regulatory and privacy challenges
- Competition from emerging platforms
- High R&D investment
Stock #8: Broadcom Inc. (AVGO)
Quick Stats Table
| Metric | Value |
|---|---|
| Current Price | Not shown |
| Market Cap | $1,595.1B |
| Quality Rating | 6.3 |
| Intrinsic Value | $94.9 (72.0% overvalued) |
| 1Y Return | 96.9% |
| Revenue | $59.9B |
| Free Cash Flow | $24.9B |
| Revenue Growth | 28.0% |
| Sector | Technology |
Investment Thesis
Broadcom’s 96.9% one-year return and 28% revenue growth reflect its strong position in semiconductors and infrastructure software. With a $1.59T market cap and $24.9B in free cash flow, Broadcom is a key beneficiary of digital transformation trends. However, the stock is 72% overvalued relative to intrinsic value, warranting caution.
The company’s diversified product portfolio and strategic acquisitions drive growth and margin expansion.
Key Catalysts
- Expansion in data center and networking
- Strategic M&A activity
- Growth in software and semiconductor demand
Risk Factors
- High valuation risk
- Integration challenges from acquisitions
- Cyclical industry exposure
Stock #9: Taiwan Semiconductor Manufacturing Company Limited (TSM)
Quick Stats Table
| Metric | Value |
|---|---|
| Current Price | Not shown |
| Market Cap | $1,515.2B |
| Quality Rating | 6.3 |
| Intrinsic Value | $393.1 (34.5% undervalued) |
| 1Y Return | 63.2% |
| Revenue | NT$3,401.2B |
| Free Cash Flow | NT$947.9B |
| Revenue Growth | 39.5% |
| Sector | Technology |
Investment Thesis
TSMC is the world’s leading semiconductor foundry, enabling innovation for global tech giants. With a $1.52T market cap and a rare 34.5% undervaluation, TSMC stands out for value-oriented investors. The company’s 63.2% annual return and 39.5% revenue growth highlight its critical role in the semiconductor supply chain.
TSMC’s scale, technological leadership, and robust free cash flow (NT$947.9B) position it as a foundational holding in the sector.
Key Catalysts
- Leadership in advanced chip manufacturing
- Expansion into automotive and AI chips
- Global supply chain diversification
Risk Factors
- Geopolitical tensions in Asia
- Capital intensity and technology cycles
- Customer concentration risk
Stock #10: Tesla, Inc. (TSLA)
Quick Stats Table
| Metric | Value |
|---|---|
| Current Price | Not shown |
| Market Cap | $1,385.3B |
| Quality Rating | 6.2 |
| Intrinsic Value | $18.3 (95.7% overvalued) |
| 1Y Return | 78.6% |
| Revenue | $92.7B |
| Free Cash Flow | $5,653.0M |
| Revenue Growth | (2.7%) |
| Sector | Automotive/Technology |
Investment Thesis
Tesla’s $1.39T market cap and 78.6% annual return reflect its disruptive impact on automotive and energy markets. Despite a 95.7% overvaluation and negative revenue growth (-2.7%), Tesla’s innovation in EVs, batteries, and autonomous technology drives investor enthusiasm.
The company’s $5.65B in free cash flow and global brand recognition support its long-term vision, though near-term volatility remains high.
Key Catalysts
- Expansion of EV production and new models
- Growth in energy storage and solar
- Advances in autonomous driving
Risk Factors
- High valuation and volatility
- Execution risks in scaling production
- Competitive pressures from legacy automakers
Stock #11: Walmart Inc. (WMT)
Quick Stats Table
| Metric | Value |
|---|---|
| Current Price | Not shown |
| Market Cap | $814.3B |
| Quality Rating | 7.0 |
| Intrinsic Value | $46.8 (54.2% overvalued) |
| 1Y Return | 27.2% |
| Revenue | $693.2B |
| Free Cash Flow | $15.2B |
| Revenue Growth | 2.3% |
| Sector | Consumer Staples |
Investment Thesis
Walmart’s $814.3B market cap and $693.2B in revenue make it a global retail powerhouse. With a quality rating of 7.0 and 27.2% annual return, Walmart offers defensive growth and stability. The company’s 54.2% overvaluation suggests caution, but its scale and operational efficiency support long-term resilience.
Walmart’s investments in e-commerce and supply chain modernization enhance its competitive position.
Key Catalysts
- Expansion of digital and omnichannel retail
- Growth in private label and international markets
- Supply chain optimization
Risk Factors
- Margin pressure from competition
- Slower growth in mature markets
- Regulatory and labor challenges
Stock #12: Eli Lilly and Company (LLY)
Quick Stats Table
| Metric | Value |
|---|---|
| Current Price | Not shown |
| Market Cap | $754.1B |
| Quality Rating | 6.8 |
| Intrinsic Value | $238.7 (71.6% overvalued) |
| 1Y Return | (4.8%) |
| Revenue | $53.3B |
| Free Cash Flow | ($50.2M) |
| Revenue Growth | 36.8% |
| Sector | Healthcare |
Investment Thesis
Eli Lilly’s $754.1B market cap and 36.8% revenue growth reflect its leadership in pharmaceuticals and innovation in new therapies. Despite a 71.6% overvaluation and negative free cash flow, the company’s 6.8 quality rating and robust pipeline support its long-term outlook.
Eli Lilly’s focus on high-growth therapeutic areas and global expansion positions it for continued relevance in healthcare.
Key Catalysts
- Launch of new drugs and therapies
- Expansion in global healthcare markets
- Strong R&D pipeline
Risk Factors
- High valuation and negative free cash flow
- Patent expirations and regulatory risks
- Competition from generics and biosimilars
Portfolio Diversification Insights
This watchlist spans technology, healthcare, consumer staples, and automotive sectors, offering a blend of growth, stability, and innovation. Technology dominates the allocation, with significant representation from semiconductors, cloud, and digital platforms. Healthcare (Eli Lilly) and consumer staples (Walmart) provide defensive balance, while Tesla adds exposure to disruptive mobility.
Market Timing & Entry Strategies
Given the prevalence of overvaluation, staggered entry or dollar-cost averaging may help manage risk. Undervalued opportunities like TSMC stand out for immediate consideration, while others may warrant patience for more attractive entry points. Monitoring sector rotation and macroeconomic trends can further refine timing.
Explore More Investment Opportunities
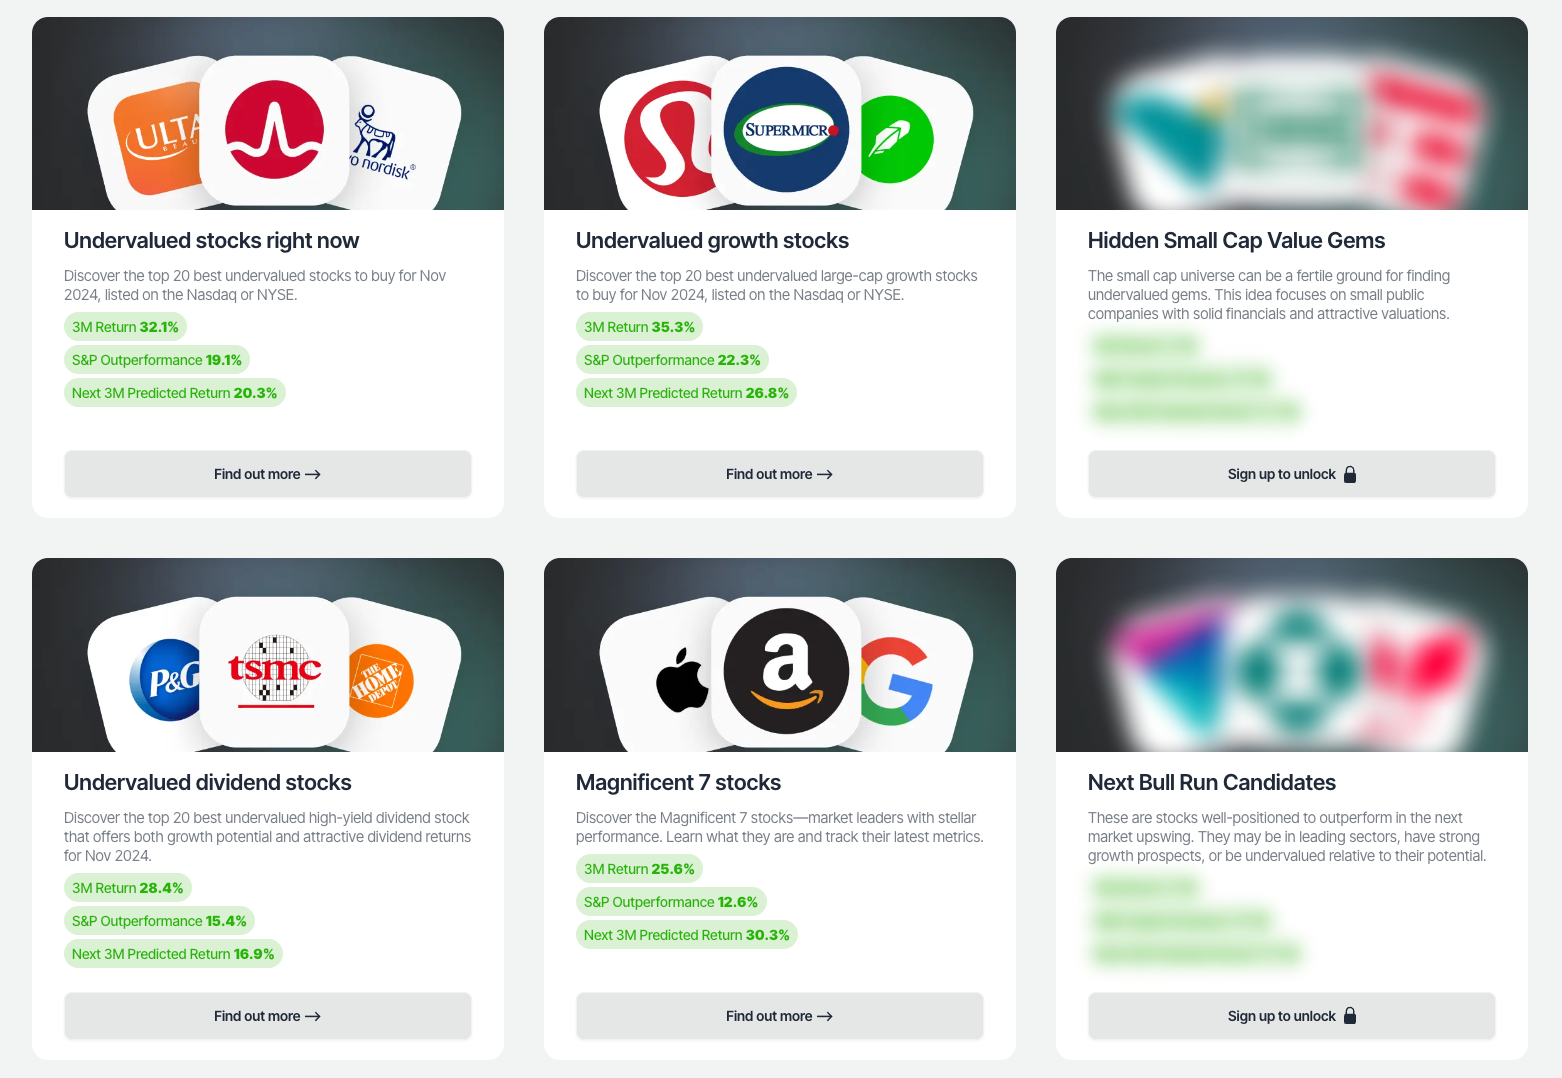
For investors seeking undervalued companies with high fundamental quality, our analytics team provides curated stock lists:
📌 50 Undervalued Stocks (Best overall value plays for 2025)
📌 50 Undervalued Dividend Stocks (For income-focused investors)
📌 50 Undervalued Growth Stocks (High-growth potential with strong fundamentals)
🔍 Check out these stocks on the Value Sense platform for free!
More Articles You Might Like
📖 10 Best GARP Stock Picks for 2025
📖 12 Best High Quality Low EV/EBIT Stocks - October-November 2025
📖 12 Best Stock Picks for Profitable Growth
📖 12 Best Momentum Stock Picks for November 2025
📖 13 Best Wide Moat Stock Picks for 2025
FAQ about quality stocks
Q1: How were these stocks selected?
A: Stocks were chosen based on ValueSense’s quality rating, intrinsic value analysis, and key financial metrics, ensuring a diversified, high-quality watchlist.
Q2: What's the best stock from this list?
A: The answer depends on individual goals, but TSMC stands out as currently undervalued, while Meta Platforms has the highest quality rating.
Q3: Should I buy all these stocks or diversify?
A: Diversification across sectors and companies can help manage risk and capture varied growth opportunities within the watchlist.
Q4: What are the biggest risks with these picks?
A: Key risks include high valuations, regulatory challenges, sector-specific headwinds, and macroeconomic volatility.
Q5: When is the best time to invest in these stocks?
A: Entry timing depends on valuation, market conditions, and individual risk tolerance. Consider phased entry or waiting for price pullbacks on overvalued names.
Summary & Investment Outlook
This ValueSense watchlist highlights 11 best high quality stock picks for 2025, spanning technology, healthcare, and consumer sectors. While many stocks trade at valuation premiums, their leadership, innovation, and financial strength offer compelling long-term potential. For more in-depth analysis and real-time updates, visit ValueSense.