
High ROIC Stocks in September 2025: The Best Quality Compounders
Welcome to the Value Sense Blog, your resource for insights on the stock market! At Value Sense, we focus on intrinsic value tools and offer stock ideas with undervalued companies. Dive into our research products and learn more about our unique approach at valuesense.io
Explore diverse stock ideas covering technology, healthcare, and commodities sectors. Our insights are crafted to help investors spot opportunities in undervalued growth stocks, enhancing potential returns. Visit us to see evaluations and in-depth market research.
Return on Invested Capital (ROIC) continues to be a critical metric for identifying companies that efficiently generate profits from their invested capital. These companies often outperform due to durable competitive advantages, operational excellence, and smart capital allocation. Here’s an in-depth look at some high-ROIC leaders as of September 2025, combining revenue, free cash flow, growth trajectory, margins, and leverage metrics to assess their quality profile.
| Company Name | Revenue | Free Cash Flow | Revenue Growth | FCF Margin | Gross Margin | ROIC | Total Debt to Equity |
|---|---|---|---|---|---|---|---|
| NVIDIA Corporation (NVDA) | $165.2B | $72.0B | 71.6% | 43.6% | 69.8% | 176.6% | 10.6% |
| Microsoft Corporation (MSFT) | $281.7B | $71.6B | 14.9% | 25.4% | 68.8% | 26.9% | 17.6% |
| Apple Inc. (AAPL) | $408.6B | $105.7B | 6.0% | 25.9% | 46.7% | 200.5% | 154.5% |
| Alphabet Inc. (GOOGL) | $371.4B | $66.7B | 13.1% | 18.0% | 58.9% | 34.1% | 11.5% |
| Alphabet Inc. (GOOG) | $371.4B | $66.7B | 13.2% | 18.0% | 58.9% | 34.1% | 9.8% |
| Amazon.com, Inc. (AMZN) | $670.0B | $13.5B | 10.9% | 2.0% | 41.4% | 16.4% | 40.1% |
| Meta Platforms, Inc. (META) | $178.8B | $50.1B | 19.4% | 28.0% | 81.9% | 38.3% | 25.4% |
| Broadcom Inc. (AVGO) | $59.9B | $24.9B | 28.0% | 41.6% | 66.8% | 15.3% | 87.7% |
| Taiwan Semiconductor (TSM) | NT$3,401.2B | NT$750.4B | 39.5% | 22.1% | 58.6% | 34.6% | 0.0% |
| Eli Lilly and Company (LLY) | $53.3B | $1.8B | 36.8% | 3.4% | 82.6% | 35.6% | 217.5% |
NVIDIA Corporation (NVDA)
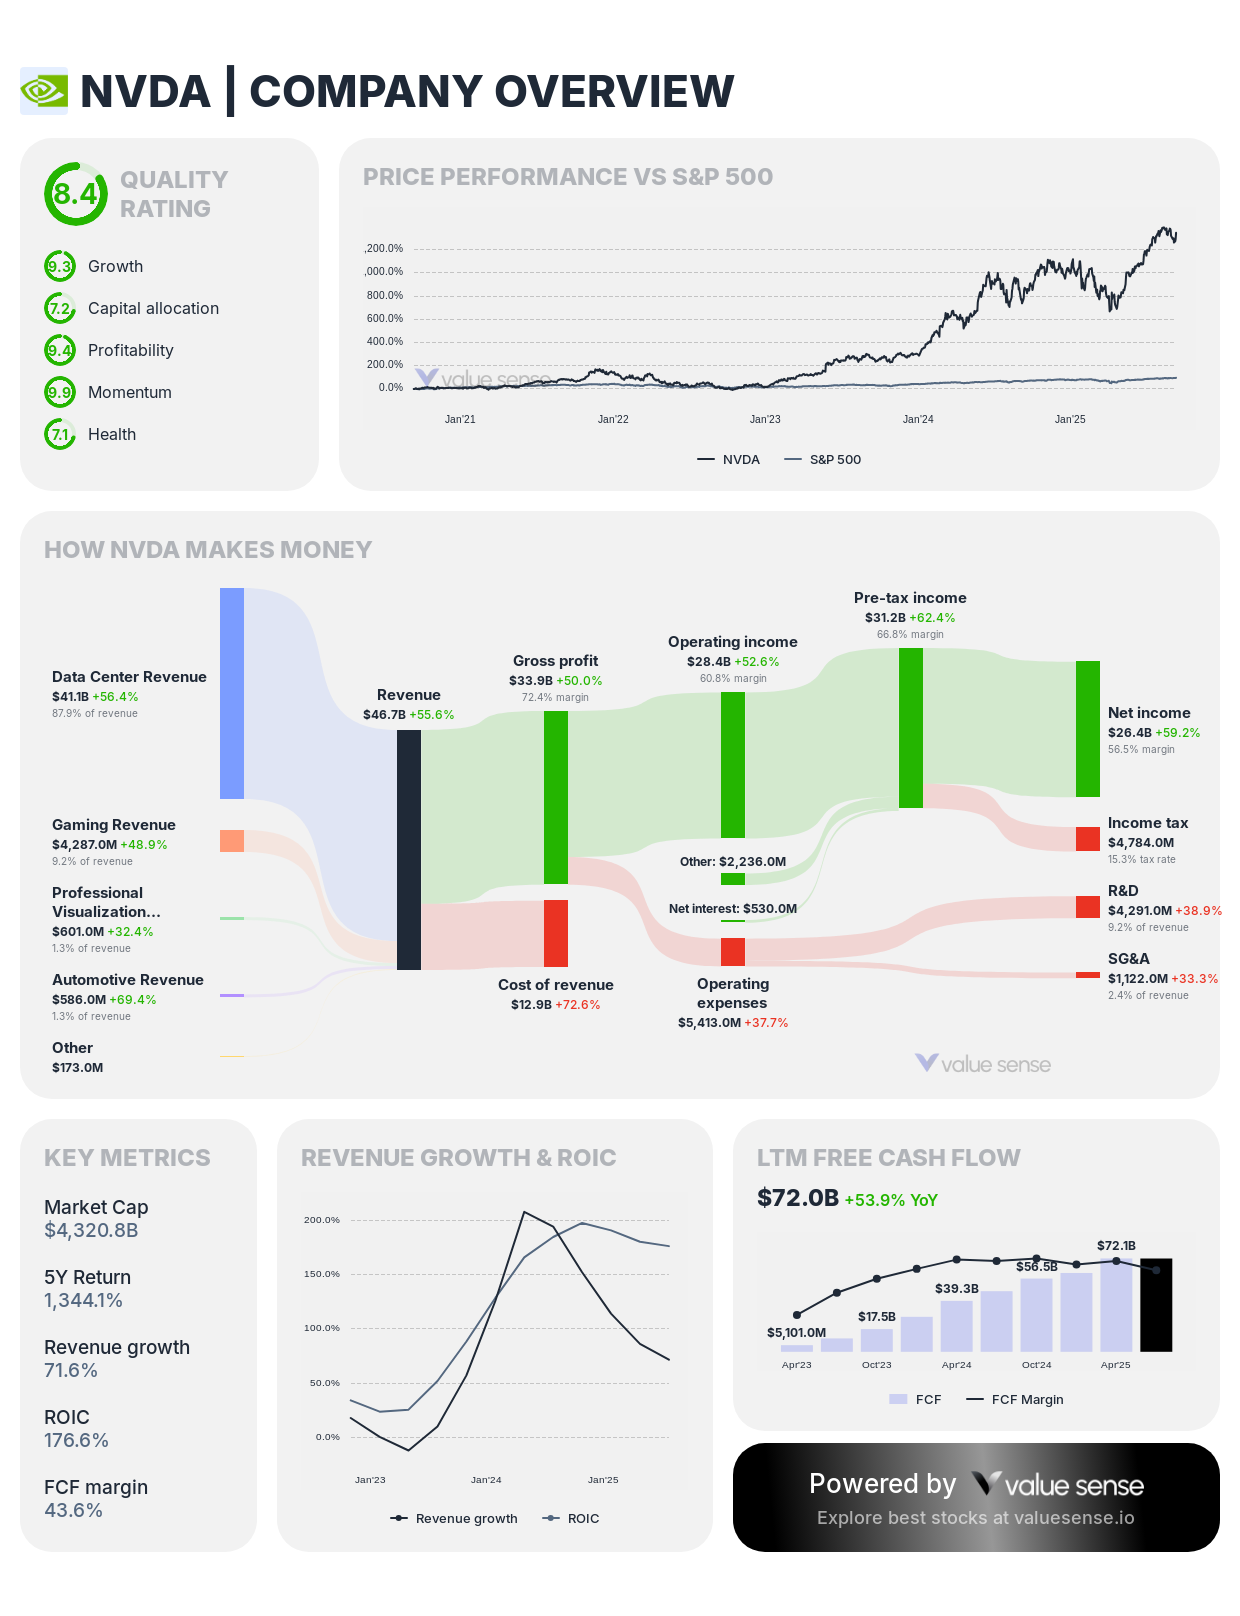
- Revenue: $165.2B
- Free Cash Flow: $72.0B
- Revenue Growth: 71.6% (exceptional growth powered by AI and data center demand)
- FCF Margin: 43.6%
- Gross Margin: 69.8%
- ROIC: 176.6% (extremely high capital efficiency)
- Debt to Equity: 10.6% (low leverage)
NVIDIA is the dominant chipmaker driving the AI revolution. Its leadership in GPUs for machine learning, gaming, and high-performance computing fuels extraordinary revenue growth and industry-best cash flow margins. The company's efficient capital use (massive ROIC) reflects its strong moat and scalable business model.
Microsoft Corporation (MSFT)
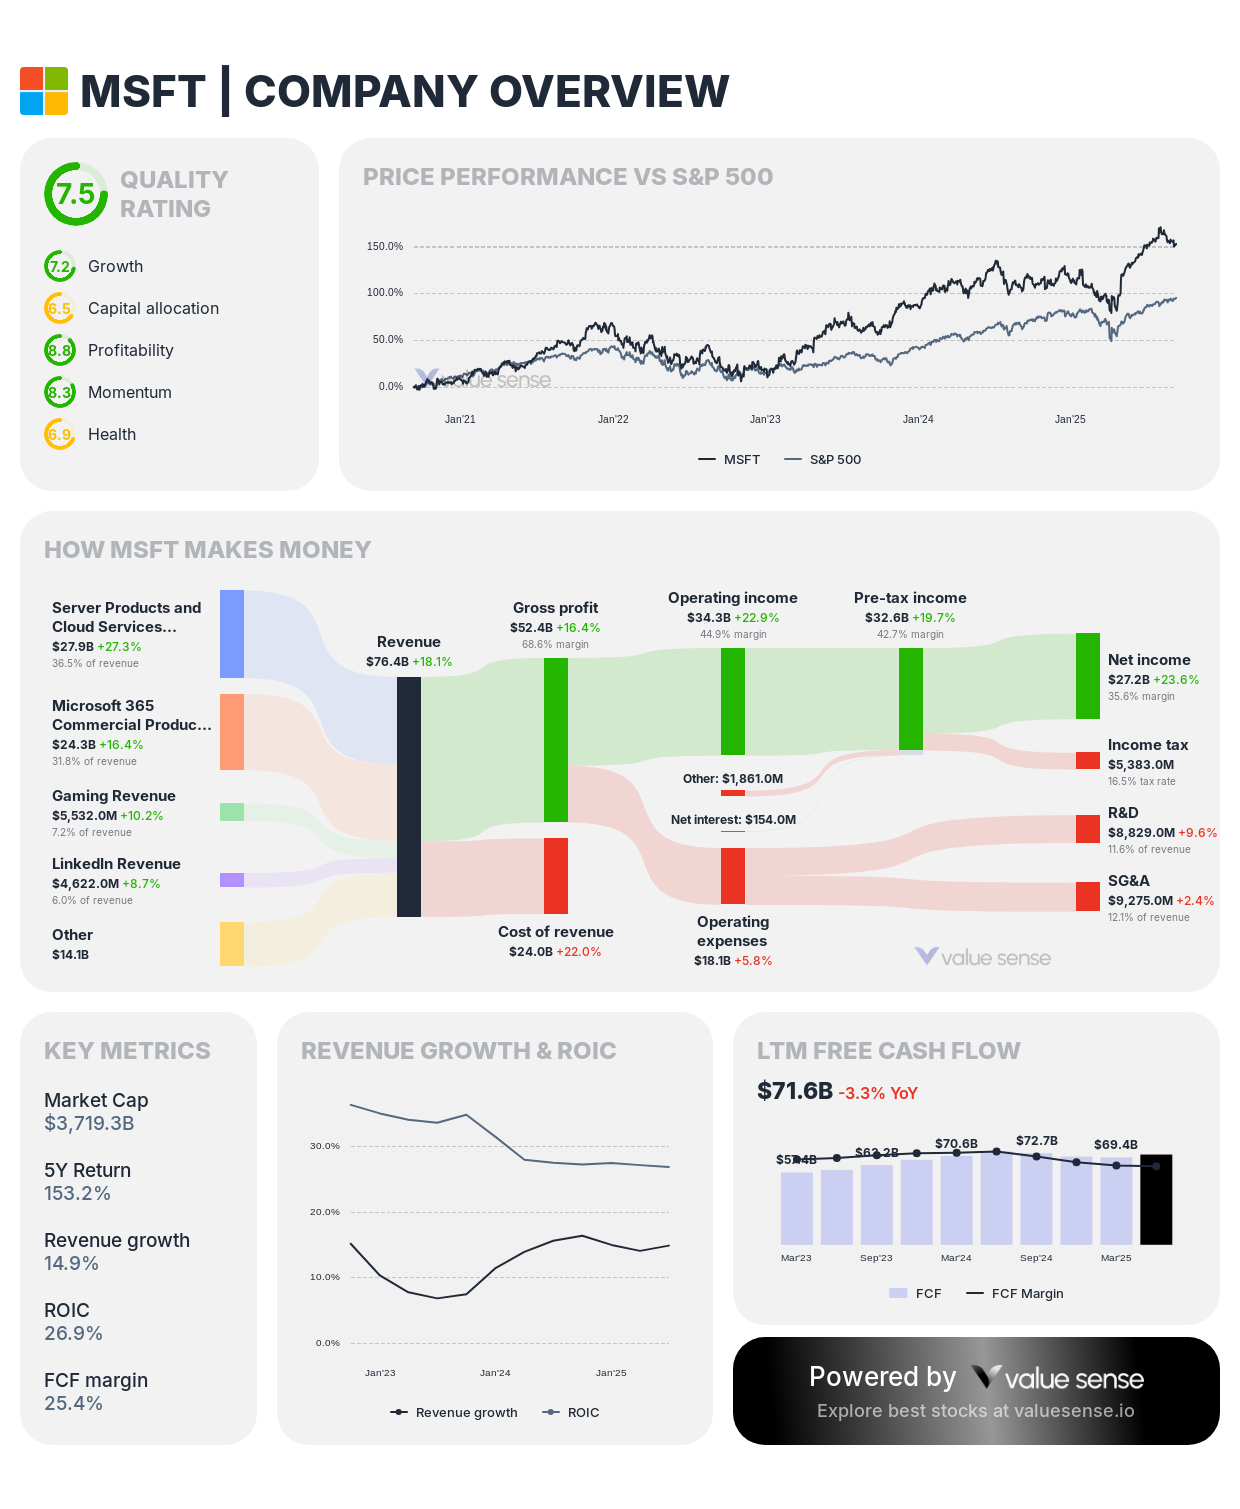
- Revenue: $281.7B
- Free Cash Flow: $71.6B
- Revenue Growth: 14.9%
- FCF Margin: 25.4%
- Gross Margin: 68.8%
- ROIC: 26.9% (solid for a large, mature technology business)
- Debt to Equity: 17.6%
Microsoft balances cloud infrastructure, productivity software, and business services to generate strong recurring revenues and steady growth. Its high gross margins and substantial cash flows enable substantial reinvestment and shareholder returns without excessive leverage.
Apple Inc. (AAPL)
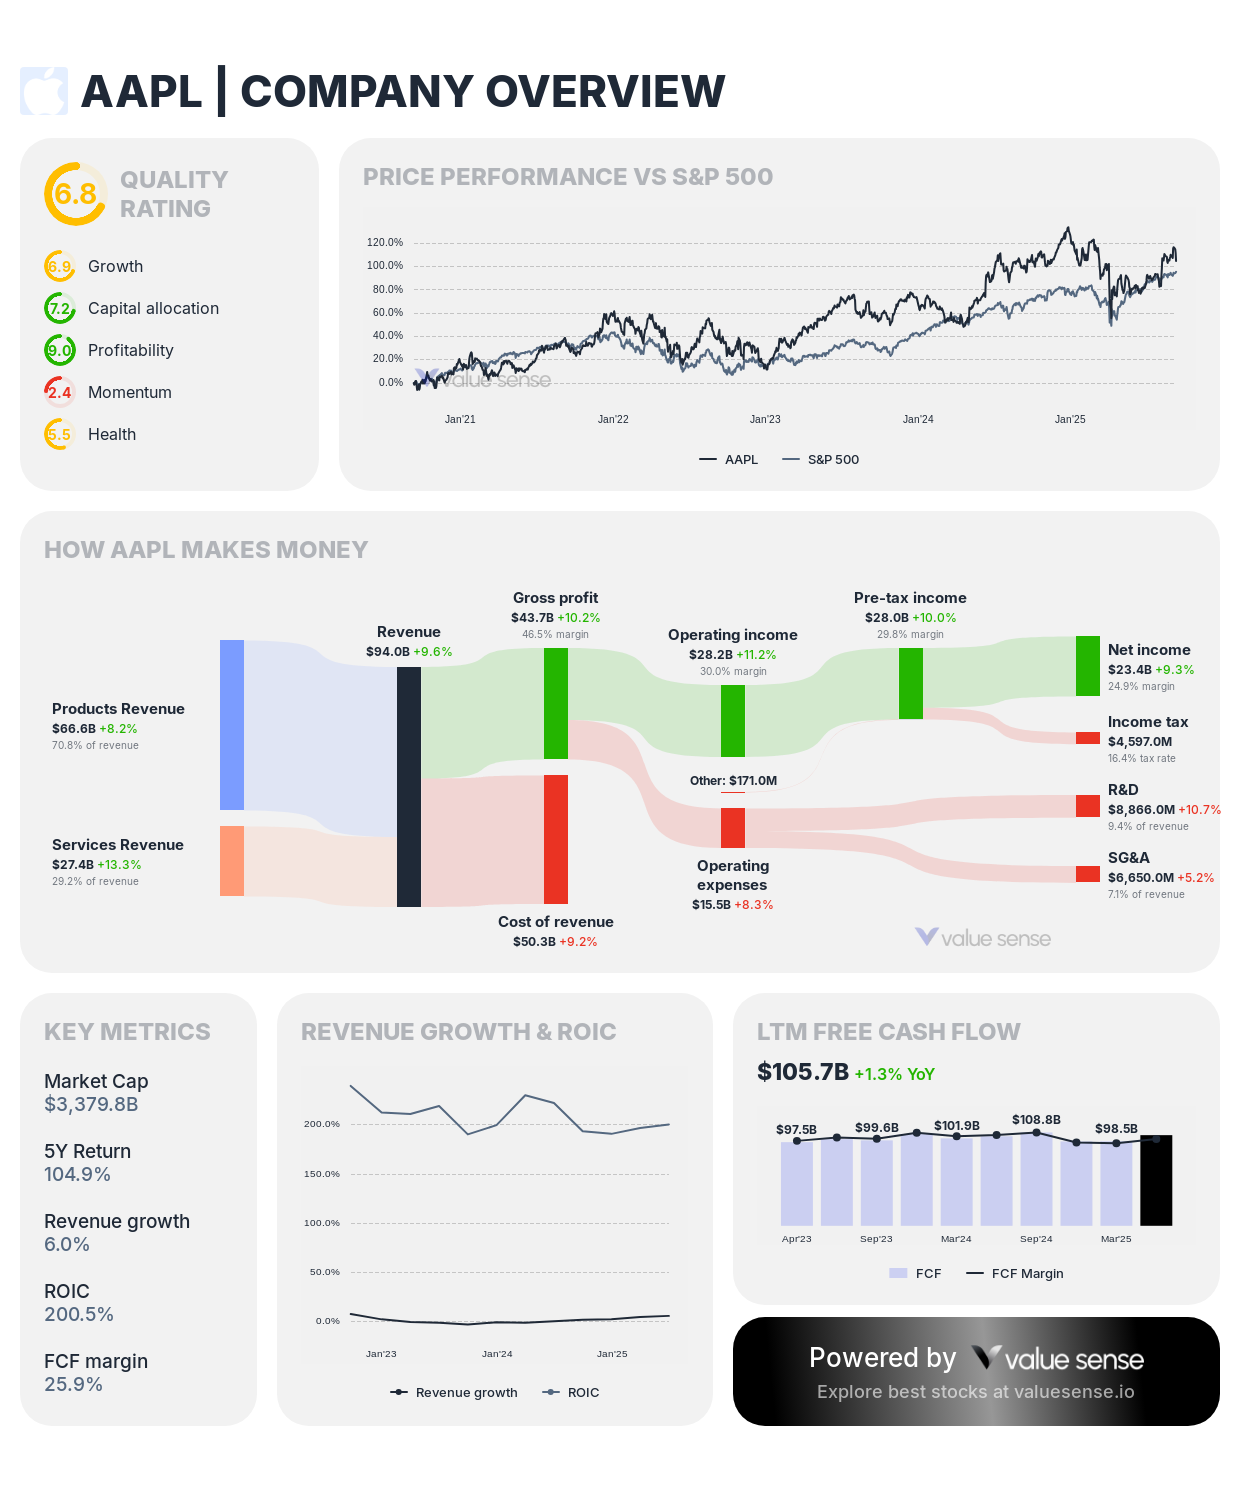
- Revenue: $408.6B
- Free Cash Flow: $105.7B
- Revenue Growth: 6.0% (slowing but stable)
- FCF Margin: 25.9%
- Gross Margin: 46.7%
- ROIC: 200.5% (exceptionally efficient capital use)
- Debt to Equity: 154.5% (high leverage, common for capital return strategies)
Apple showcases industry-leading profitability with massive free cash flow and a dominant ecosystem driving hardware and services revenues. Though leverage is high, it supports massive capital returns through buybacks and dividends, supported by ultra-strong returns on capital.
Alphabet Inc. (GOOGL and GOOG)
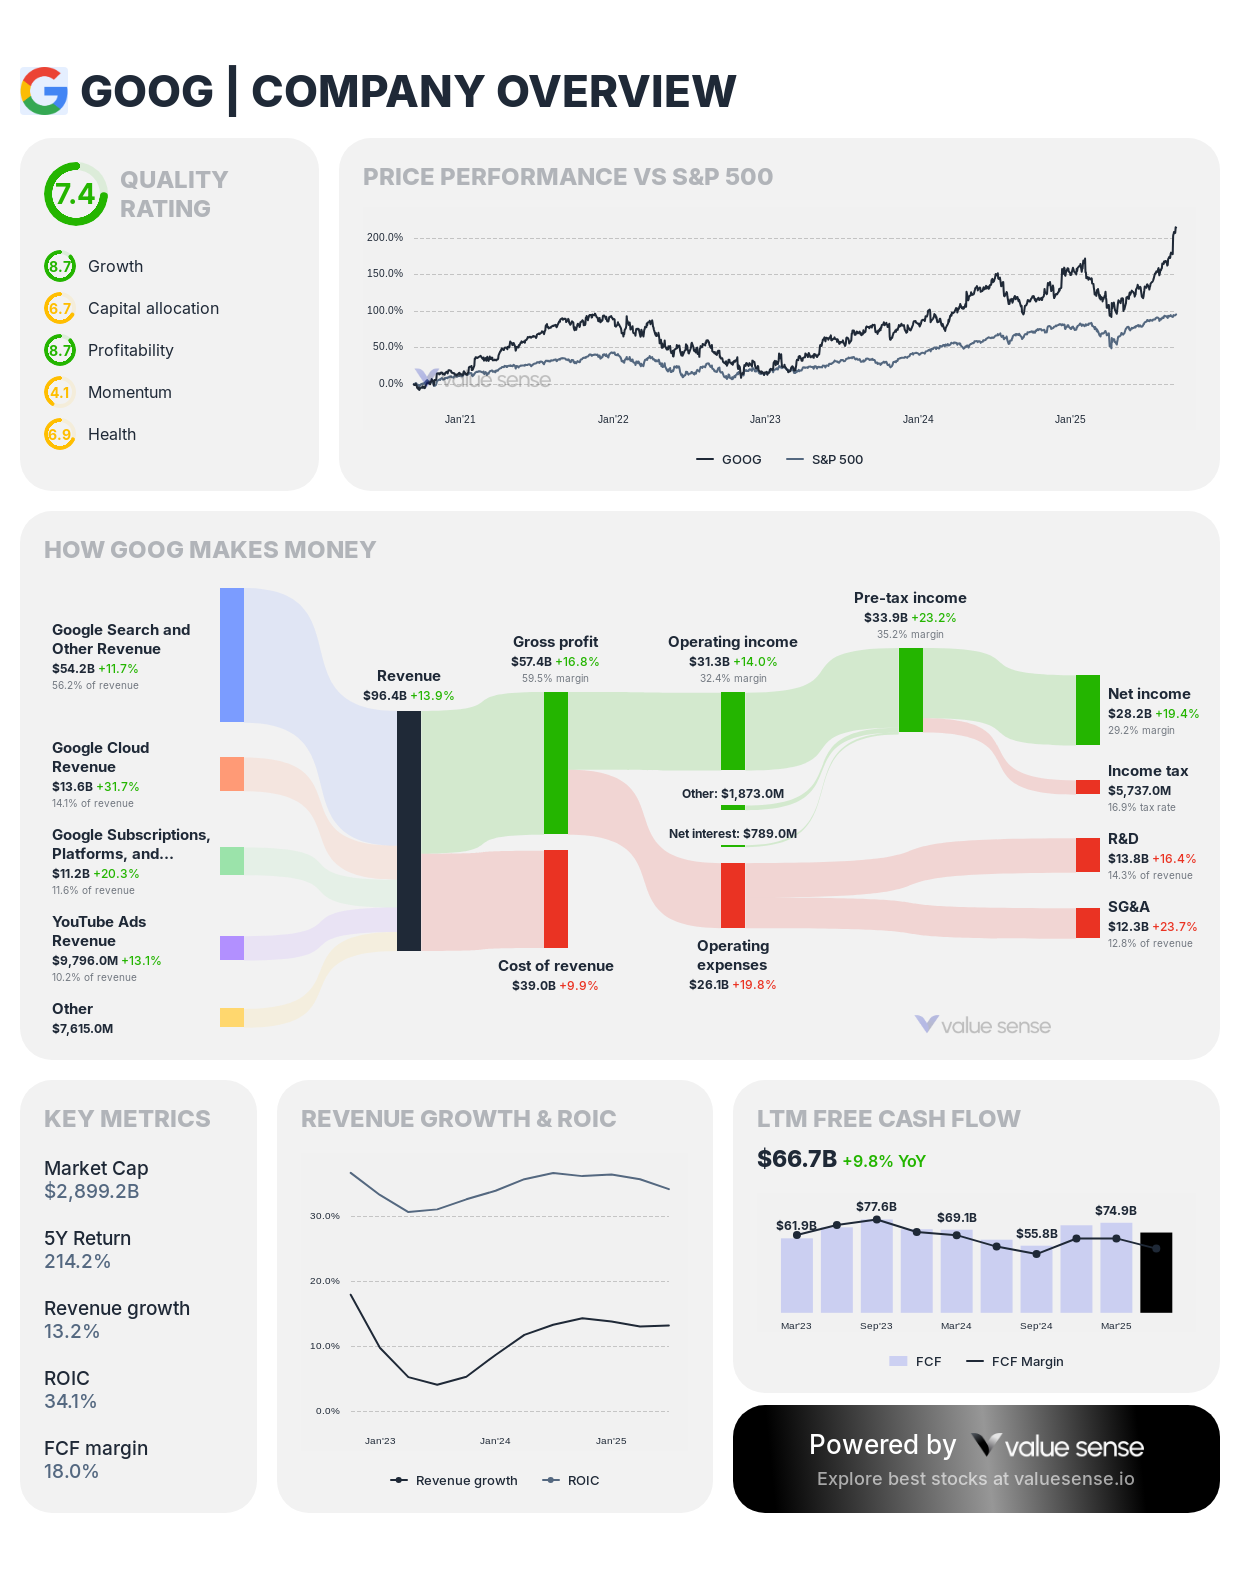
- Revenue: $371.4B
- Free Cash Flow: $66.7B
- Revenue Growth: ~13.1–13.2%
- FCF Margin: 18.0%
- Gross Margin: 58.9%
- ROIC: 34.1%
- Debt to Equity: 9.8–11.5%
Alphabet remains resilient through diversified revenue streams including search, advertising, cloud, and YouTube. Solid revenue growth combined with good cash flow conversion and manageable leverage underline its quality status in tech.
Amazon.com, Inc. (AMZN)
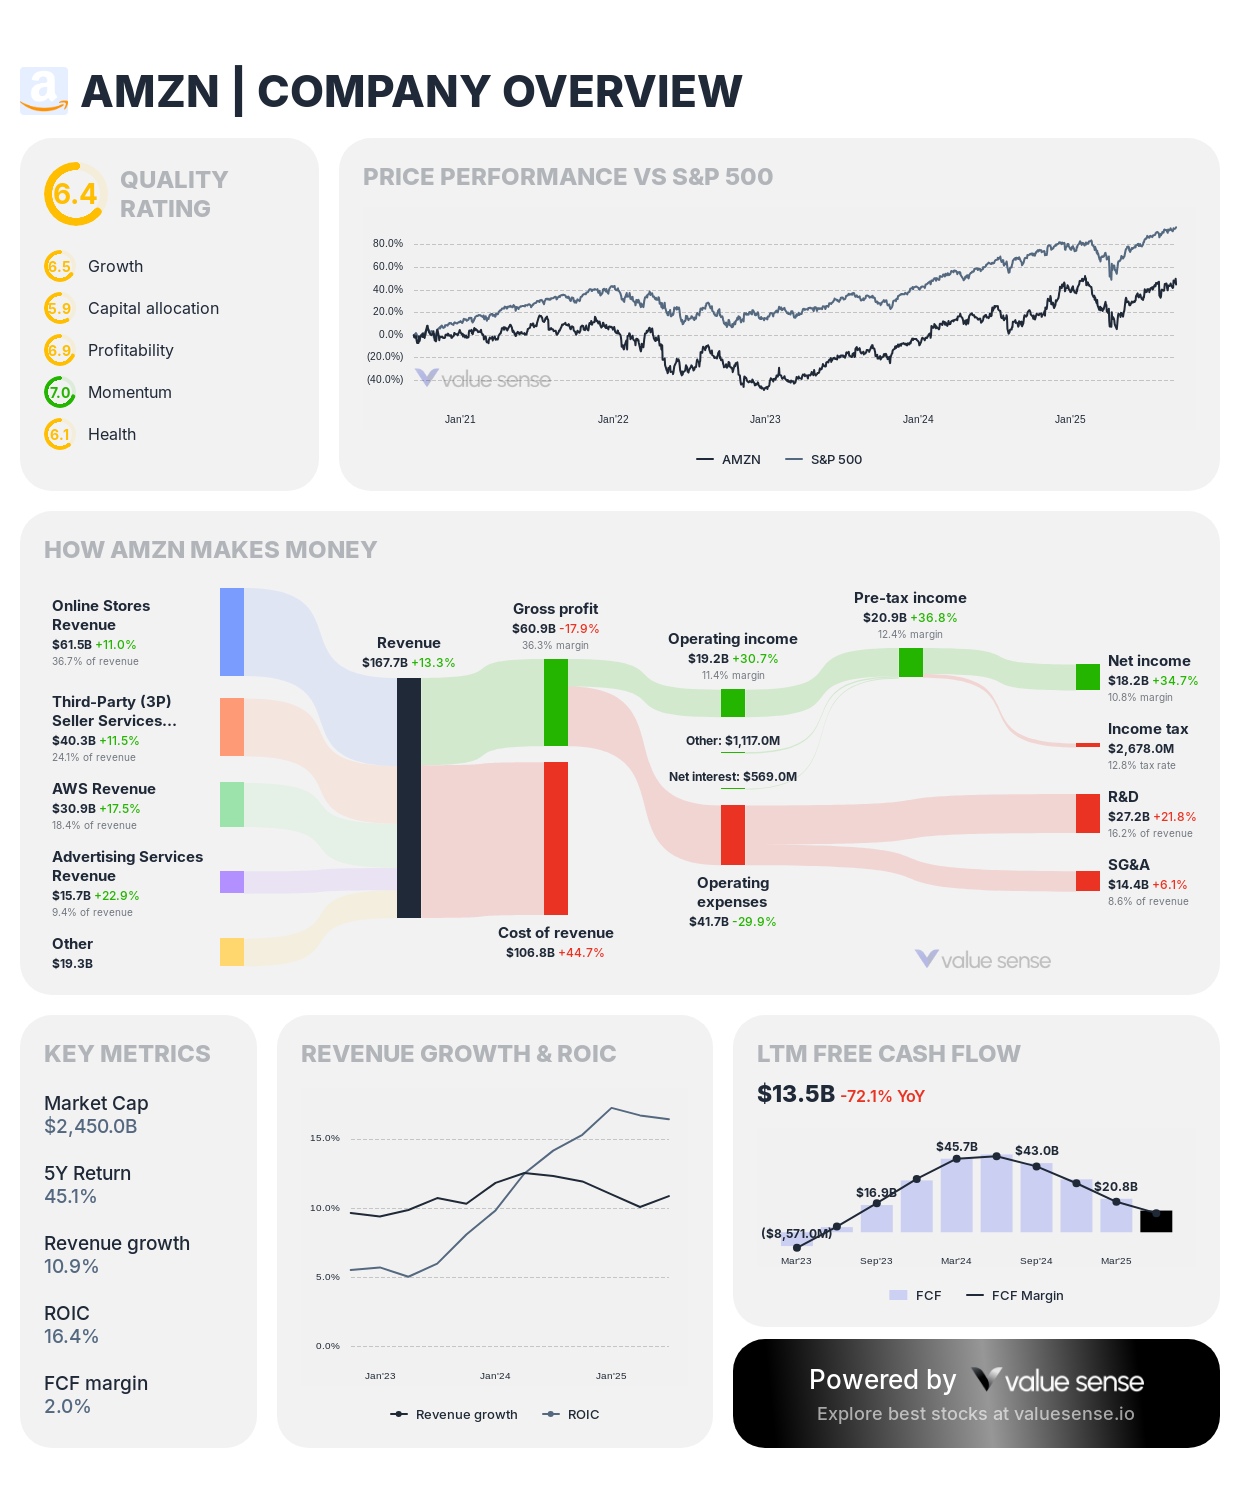
- Revenue: $670.0B
- Free Cash Flow: $13.5B
- Revenue Growth: 10.9%
- FCF Margin: 2.0% (thin but growing)
- Gross Margin: 41.4%
- ROIC: 16.4%
- Debt to Equity: 40.1%
Amazon’s large scale and pioneering logistics/capabilities drive revenue growth, though its low FCF margin signals reinvestment and expanding costs. Still, ROIC above 15% reflects solid returns for a company heavily investing in future growth.
Meta Platforms, Inc. (META)
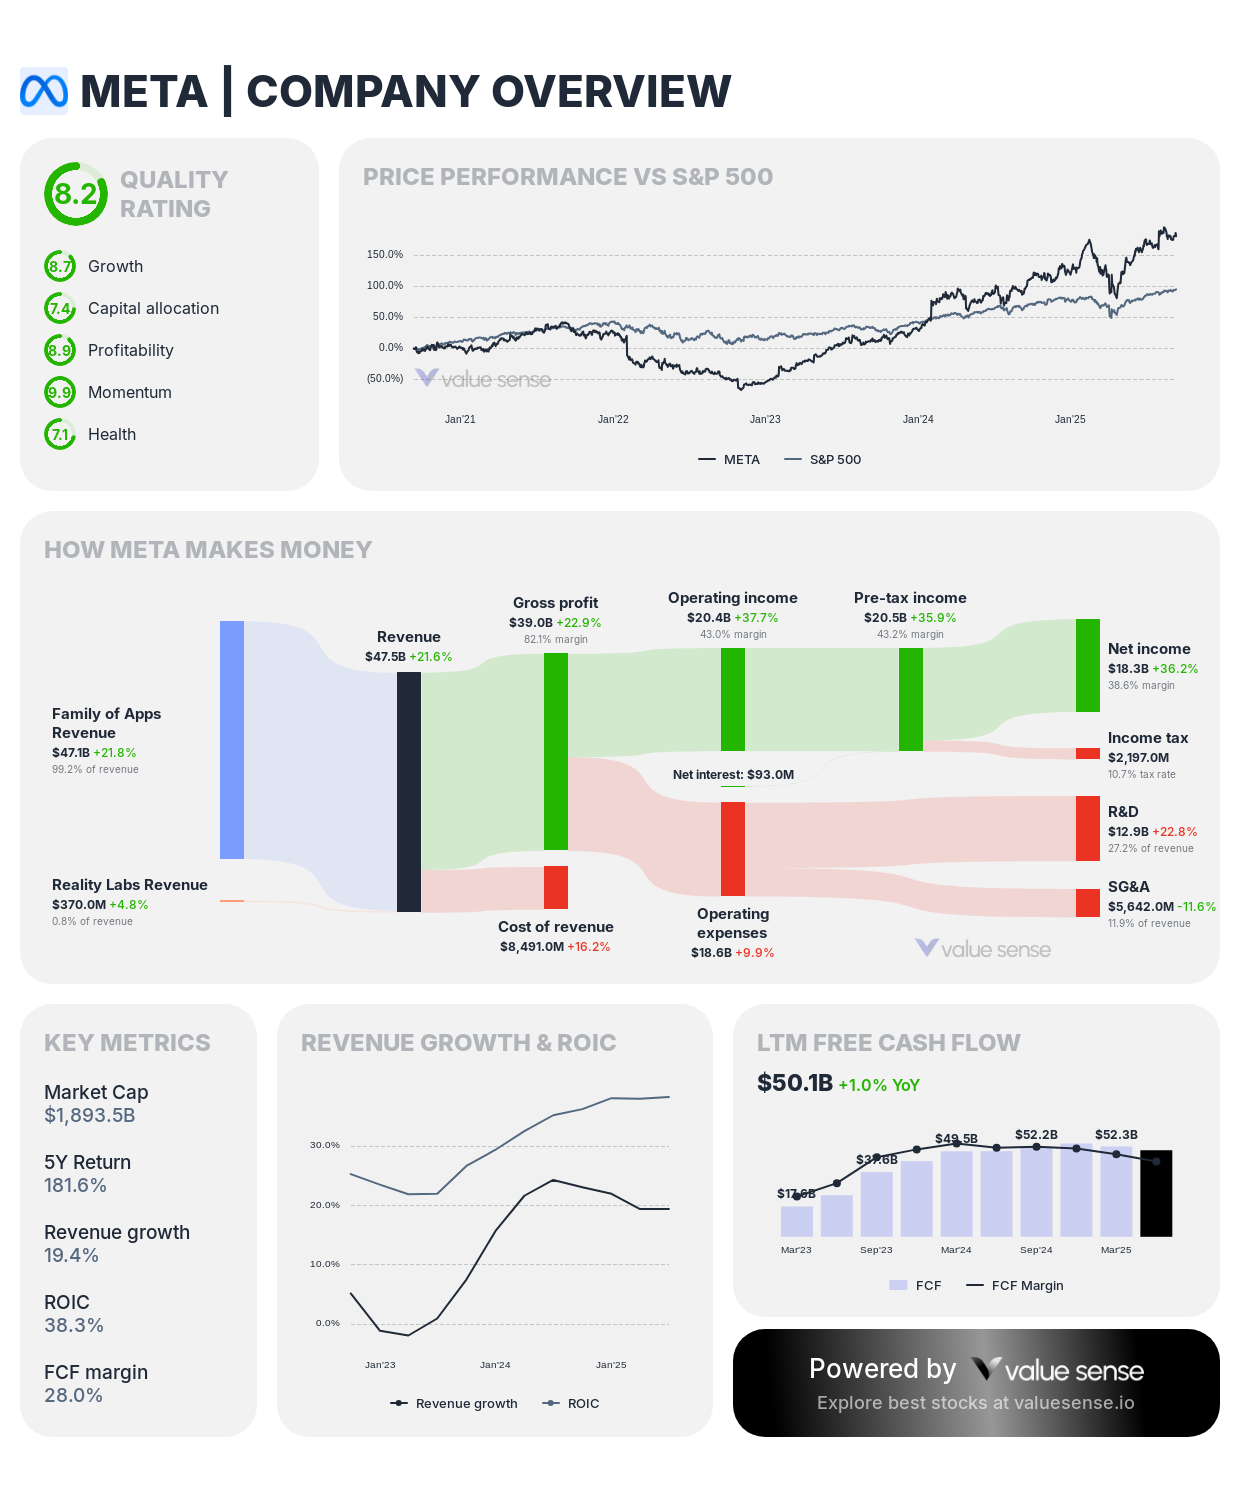
- Revenue: $178.8B
- Free Cash Flow: $50.1B
- Revenue Growth: 19.4%
- FCF Margin: 28.0%
- Gross Margin: 81.9% (extremely high)
- ROIC: 38.3%
- Debt to Equity: 25.4%
Meta capitalizes on its dominant social media platforms and expanding presence in virtual reality and AI. High gross and cash flow margins with strong capital returns mark it as an industry-leading compounder.
Broadcom Inc. (AVGO)
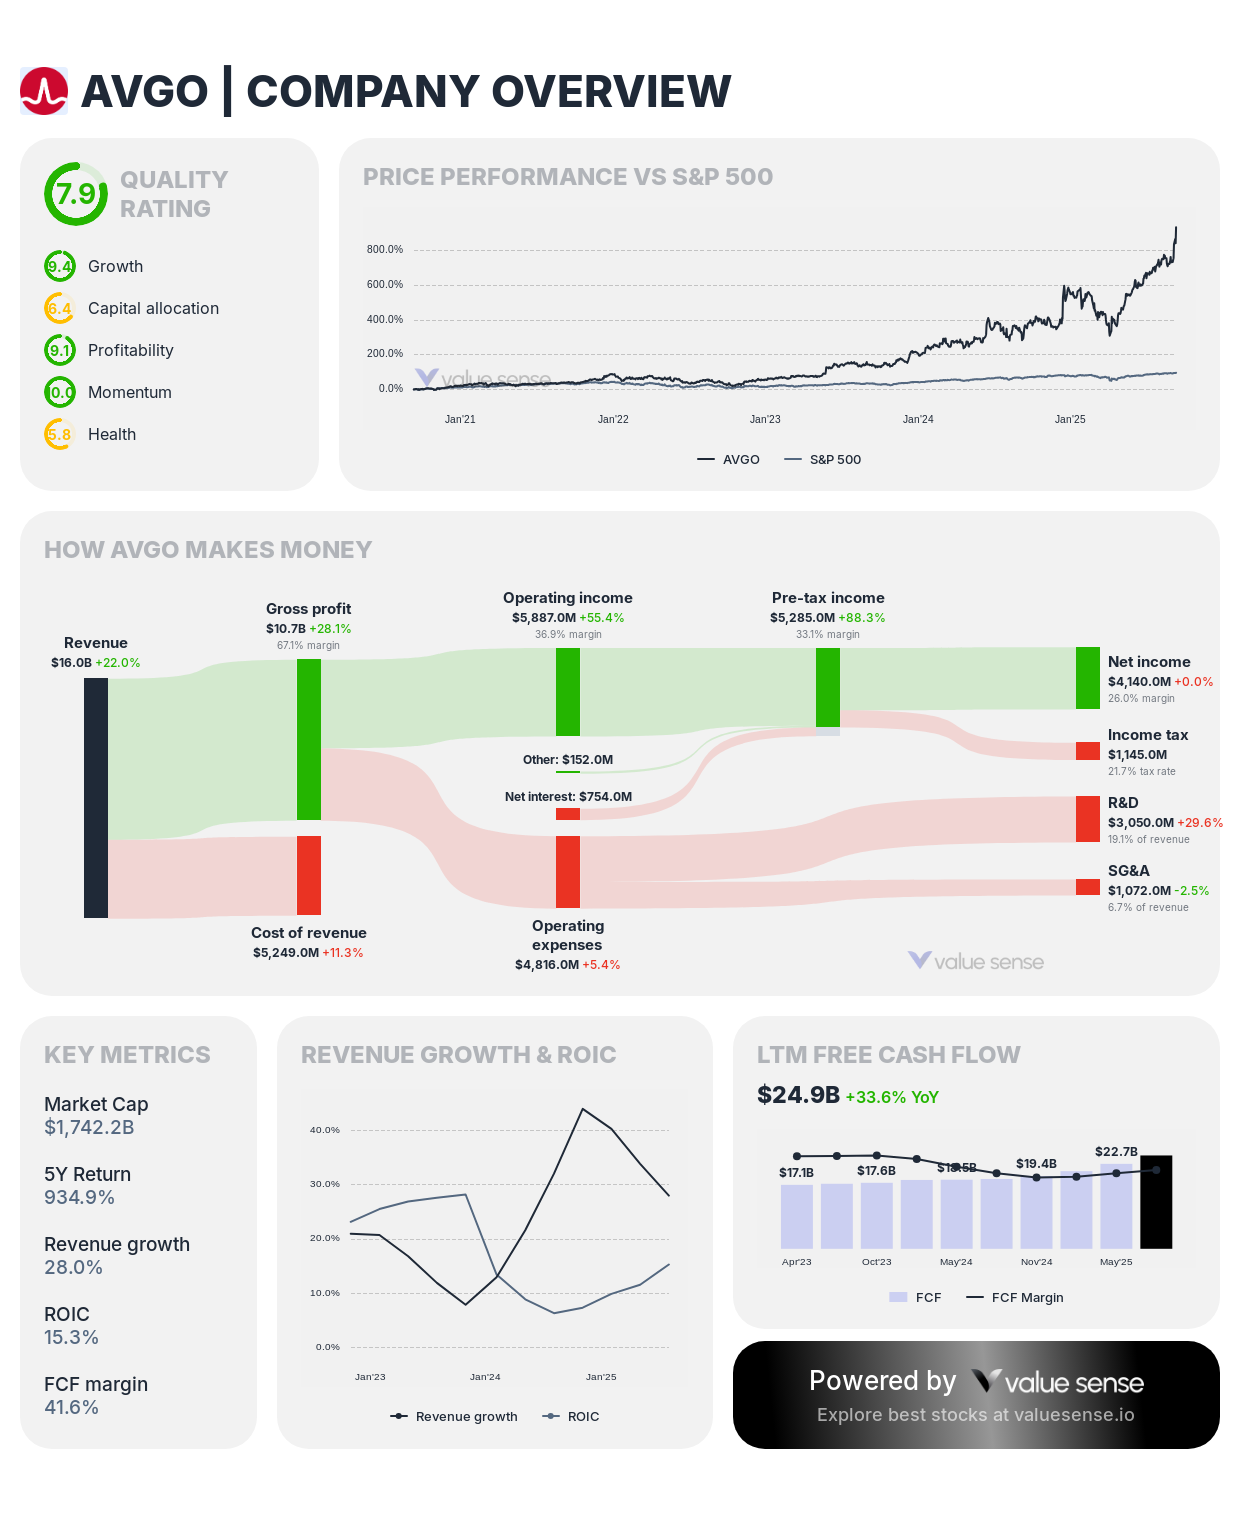
- Revenue: $59.9B
- Free Cash Flow: $24.9B
- Revenue Growth: 28.0%
- FCF Margin: 41.6%
- Gross Margin: 66.8%
- ROIC: 15.3%
- Debt to Equity: 87.7%
Broadcom enjoys high cash flow margins powered by semiconductors and infrastructure software. Revenue growth is strong, and despite relatively high leverage, the company's disciplined capital allocation maintains a sound financial footing.
Taiwan Semiconductor Manufacturing Company (TSMC)
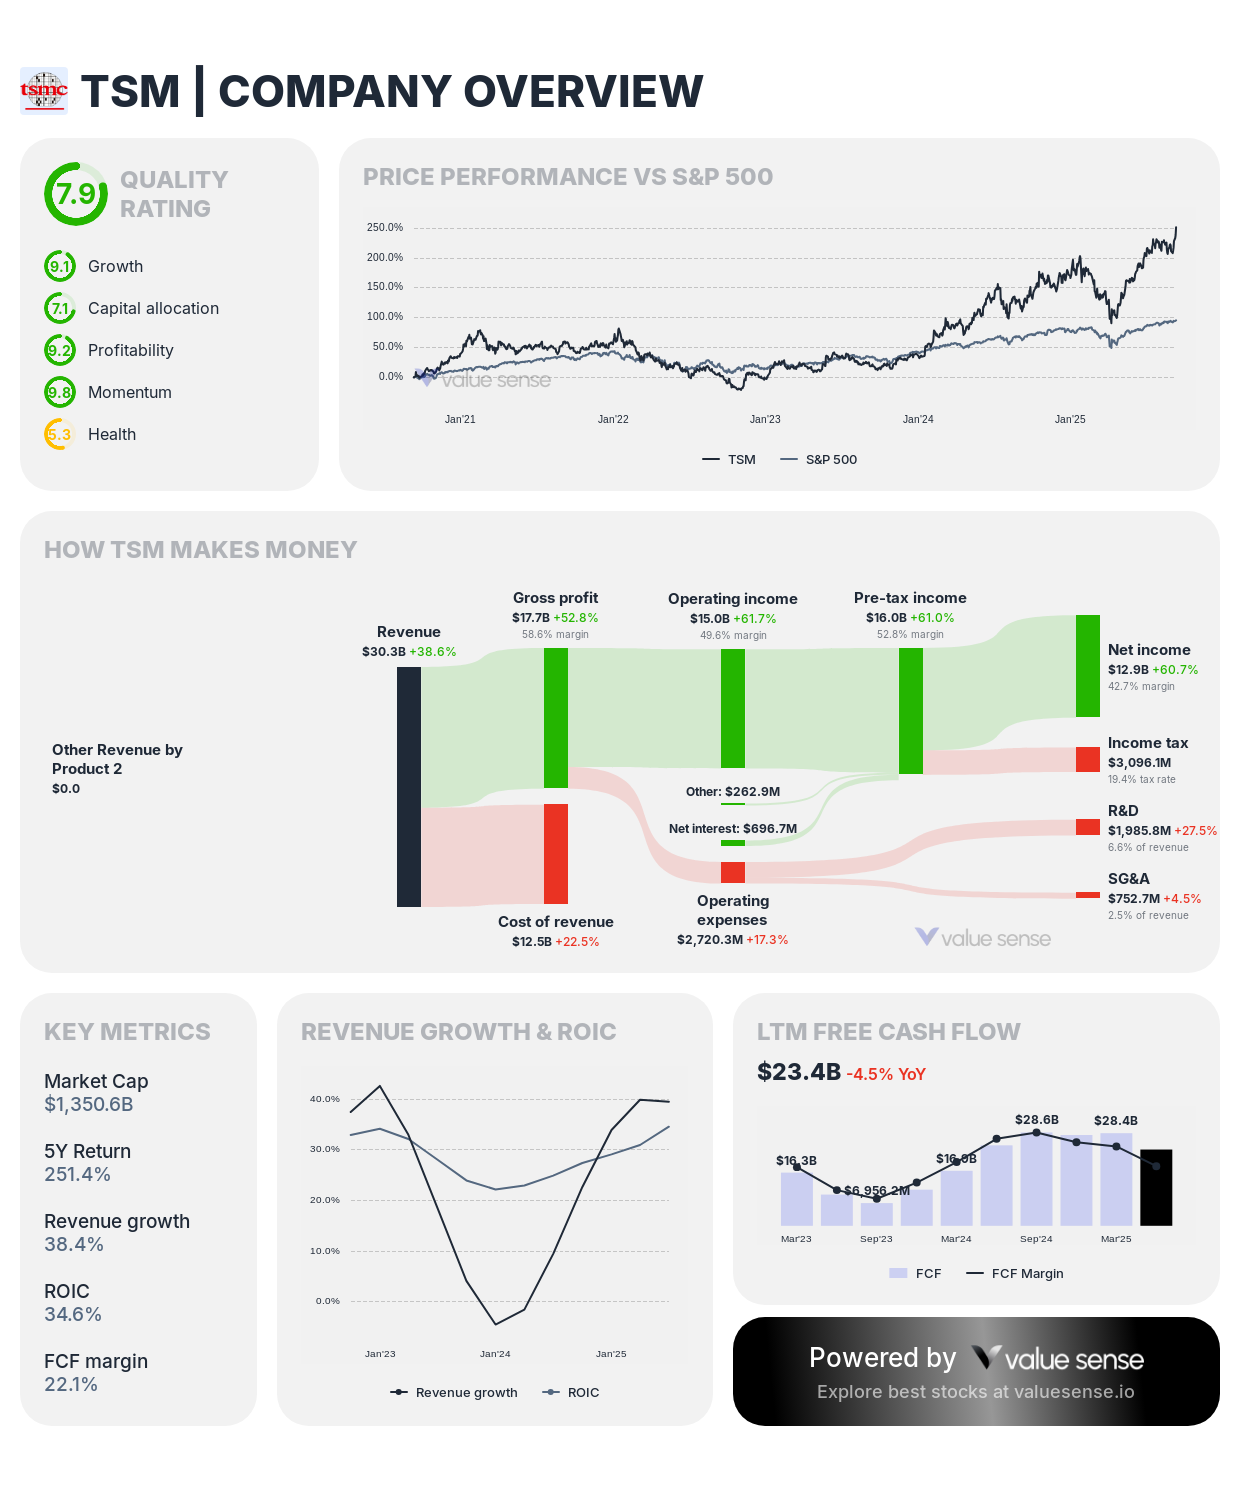
- Revenue: NT$3,401.2B
- Free Cash Flow: NT$750.4B
- Revenue Growth: 39.5%
- FCF Margin: 22.1%
- Gross Margin: 58.6%
- ROIC: 34.6%
- Debt to Equity: 0.0%
TSMC, as the world’s leading semiconductor foundry, leverages enormous scale and cutting-edge manufacturing technology to drive explosive revenue growth and efficient capital return. Zero net debt strengthens its financial flexibility.
Eli Lilly and Company (LLY)
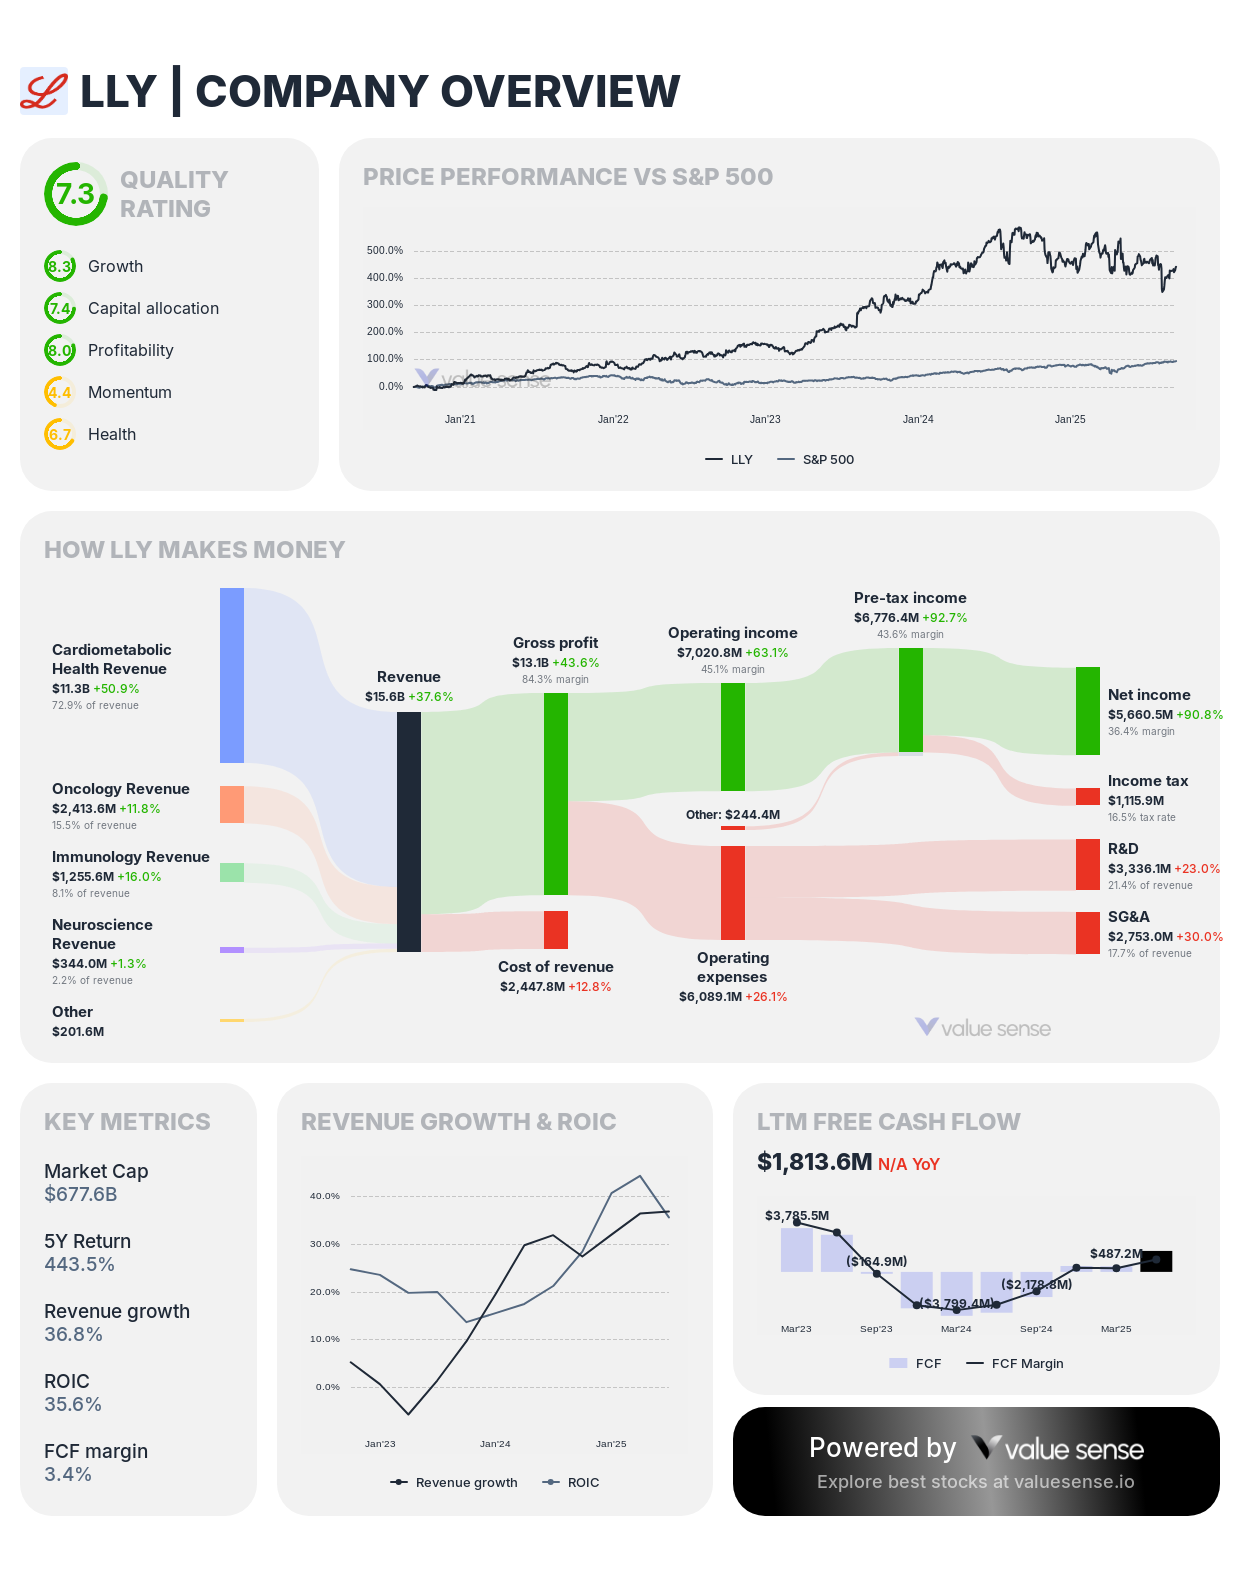
- Revenue: $53.3B
- Free Cash Flow: $1.8B
- Revenue Growth: 36.8%
- FCF Margin: 3.4%
- Gross Margin: 82.6%
- ROIC: 35.6%
- Debt to Equity: 217.5%
Eli Lilly is a pharma giant benefiting from breakthrough drugs in diabetes and oncology. While its debt is very high, the company is generating strong growth and exceptional gross margins, fueling the high ROIC figure.
Summary
These companies feature superior ROIC, robust revenue and cash flow generation, and strategic capital management, making them exemplars of high-quality investments as of September 2025. From AI chipmaker NVIDIA to tech titans like Apple and Microsoft, and pharma leader Eli Lilly, these firms exhibit the ability to compound shareholder capital efficiently while investing in growth.
Explore More Investment Opportunities
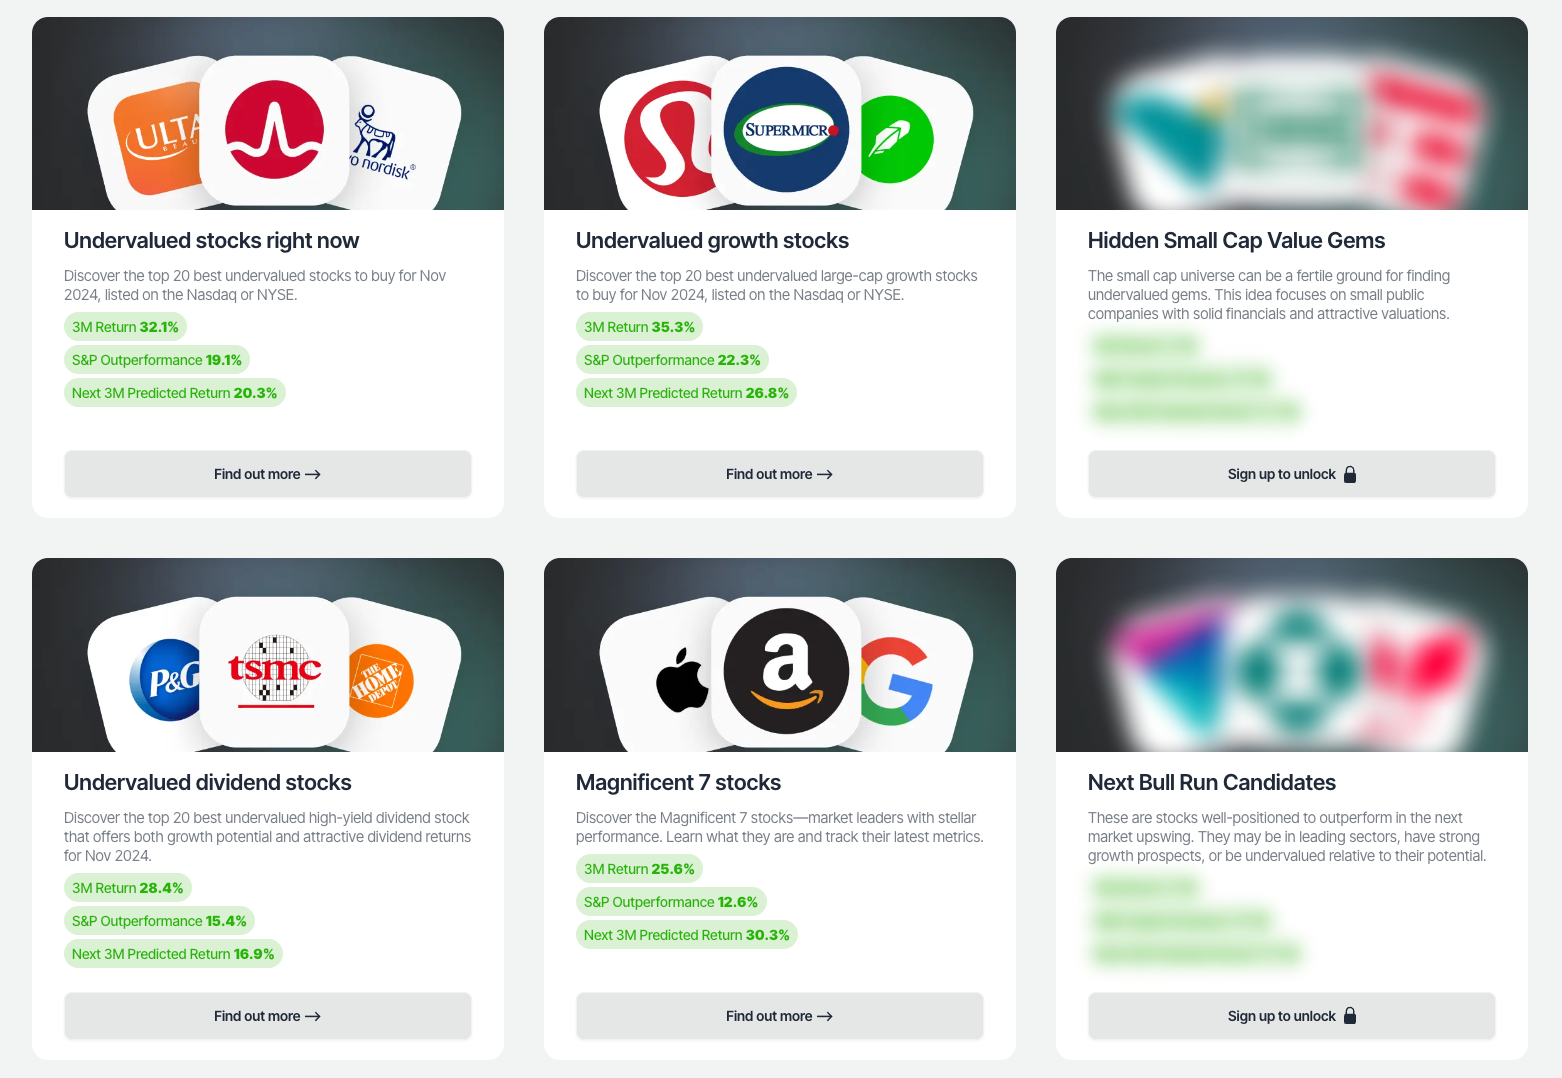
For investors seeking undervalued companies with high fundamental quality, our analytics team provides curated stock lists:
📌 50 Undervalued Stocks (Best overall value plays for 2025)
📌 50 Undervalued Dividend Stocks (For income-focused investors)
📌 50 Undervalued Growth Stocks (High-growth potential with strong fundamentals)
🔍 Check out these stocks on the Value Sense platform for free!
More Articles You Might Like
📖 Visa Stock Analysis: Undervalued Digital Payments Growth Story
📖 Procter & Gamble Undervalued: Consumer Staples Dividend Champion
📖 Which Gold Mining Stocks Are Undervalued in September 2025
📖 Adobe Stock Analysis: Undervalued Creative Software Monopoly