
Home Depot vs Lowe's: Which Home Improvement Stock Is More Undervalued? - Complete 2025 Investment Analysis
Welcome to the Value Sense Blog, your resource for insights on the stock market! At Value Sense, we focus on intrinsic value tools and offer stock ideas with undervalued companies. Dive into our research products and learn more about our unique approach at valuesense.io
Explore diverse stock ideas covering technology, healthcare, and commodities sectors. Our insights are crafted to help investors spot opportunities in undervalued growth stocks, enhancing potential returns. Visit us to see evaluations and in-depth market research.
The home improvement retail sector represents one of America's most resilient industries, weathering economic downturns, supply chain disruptions, and changing consumer behaviors with remarkable adaptability. At the heart of this $500+ billion market stand two retail giants: Home Depot (NYSE: HD) and Lowe's Companies (NYSE: LOW), locked in perpetual competition for market dominance and investor attention.
As we navigate through 2025's complex investment landscape, characterized by shifting interest rates, evolving consumer spending patterns, and persistent inflation concerns, the question of valuation becomes increasingly critical. Both companies have demonstrated extraordinary resilience, but their current market valuations present vastly different investment propositions.
This comprehensive analysis examines every aspect of the Home Depot vs Lowes undervalued debate, diving deep into financial metrics, competitive positioning, market dynamics, and future growth prospects to determine which home improvement stock offers superior investment value.
Market Leadership: Understanding the Competitive Landscape
Home Depot's Dominance Strategy
Home Depot has maintained its position as the undisputed leader in home improvement retail through strategic advantages that extend far beyond simple size metrics. The company operates over 2,300 stores across North America, serving both do-it-yourself (DIY) customers and professional contractors through a sophisticated omnichannel platform.
The company's "One Home Depot" strategy focuses on interconnecting digital and physical retail experiences, creating seamless customer journeys that maximize basket size and frequency. This approach has proven particularly effective during economic uncertainty, as customers seek convenience and reliability in their home improvement projects.
HD's professional business segment represents approximately 45% of total sales, providing stability during consumer spending volatility. Professional contractors require consistent supply availability, bulk purchasing options, and specialized services - areas where Home Depot's scale advantages create meaningful competitive moats.
Lowe's Transformation Journey
Lowe's has undergone significant strategic transformation under CEO Marvin Ellison's leadership, shifting from a traditional retail model toward operational excellence and market share gains. The company's "Total Home" strategy positions LOW as a comprehensive home improvement solution provider, targeting both DIY enthusiasts and professional customers.
Key initiatives include store optimization, supply chain modernization, and enhanced digital capabilities. Lowe's has systematically closed underperforming locations while investing heavily in high-traffic markets, resulting in improved store productivity and profitability metrics.
The company's focus on operational efficiency has yielded impressive results, particularly evident in superior return on invested capital figures that suggest management's capital allocation decisions are generating substantial shareholder value.
Revenue Analysis: Scale vs. Efficiency Trade-offs
Home Depot's Revenue Superiority
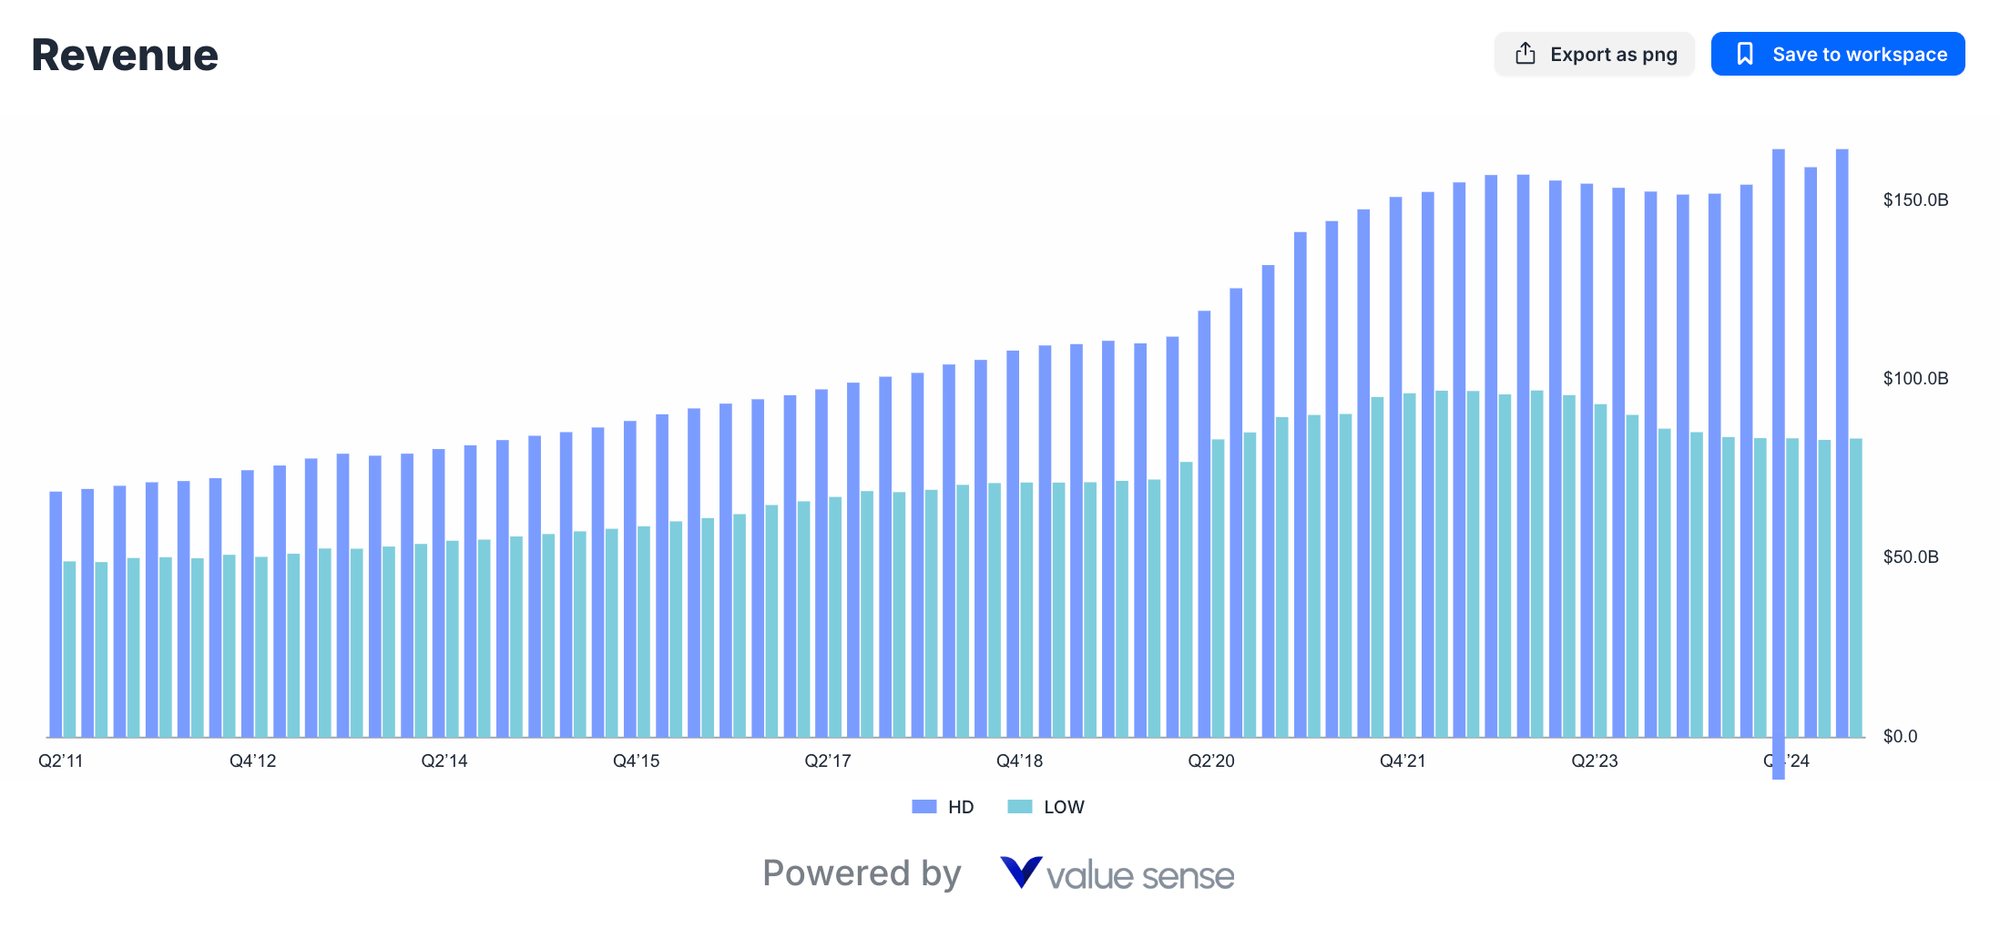
Home Depot's revenue leadership reflects decades of strategic market positioning and execution excellence. Current projections show HD generating $164.5 billion in quarterly revenue compared to Lowe's $83.6 billion - representing Home Depot's nearly 2:1 revenue advantage.
This substantial scale difference provides Home Depot with several competitive advantages:
Purchasing Power: HD's massive scale enables superior vendor negotiations, exclusive product arrangements, and favorable payment terms that directly impact gross margins and inventory management.
Geographic Coverage: Home Depot's extensive store network creates market density that reduces logistics costs while improving customer accessibility and professional contractor convenience.
Brand Recognition: Superior scale translates into marketing efficiency, with HD's advertising investments generating broader reach and better return on marketing spend.
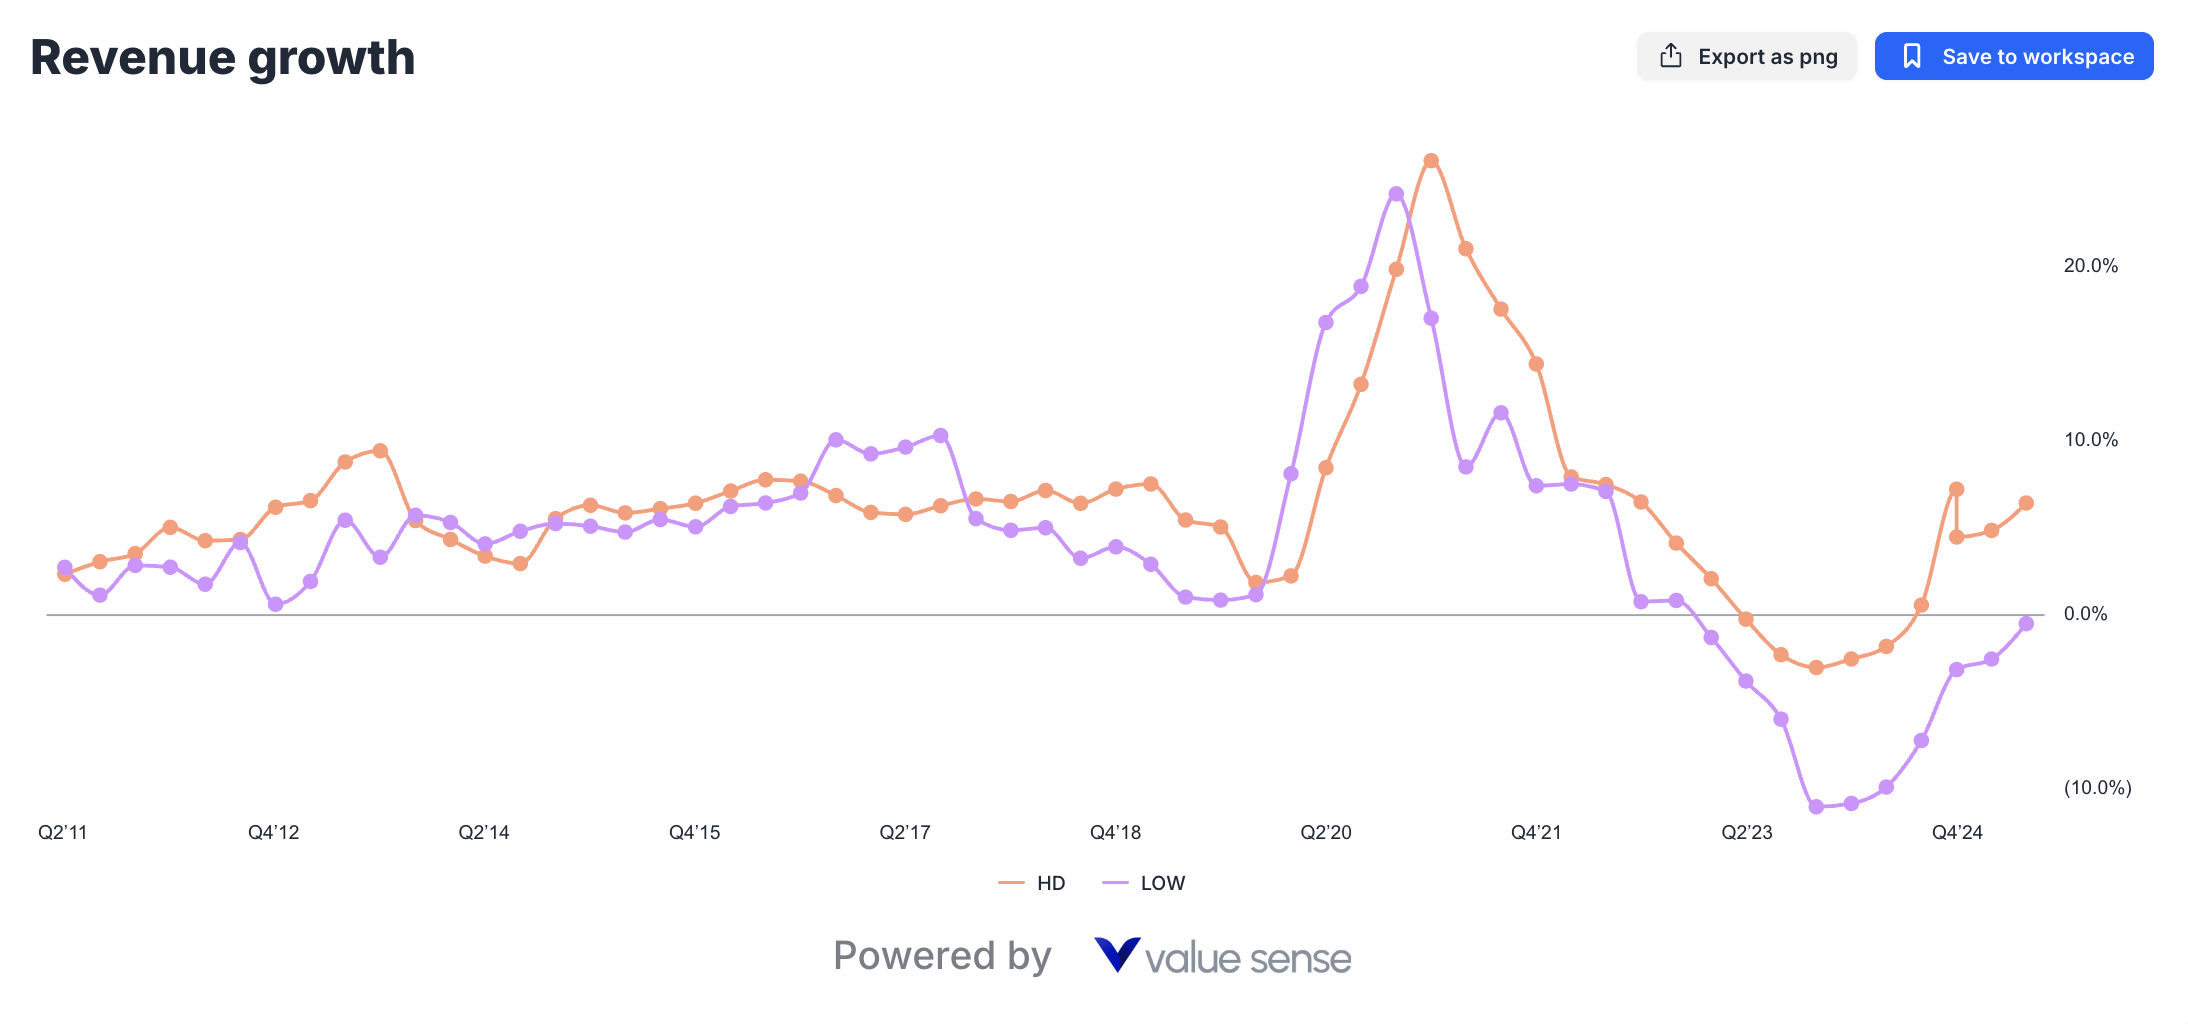
However, revenue growth trends reveal important nuances in the competitive dynamic. Home Depot's current 6.4% growth rate, while positive, has shown volatility throughout recent quarters, particularly during periods of housing market uncertainty.
Lowe's Efficiency Focus
Lowe's strategic approach prioritizes operational efficiency over pure scale expansion. The company's recent revenue contraction of -0.5% reflects deliberate strategic choices rather than fundamental business weakness.
Management's decision to exit certain low-margin categories, optimize store footprints, and focus on higher-value customer segments has temporarily impacted revenue growth but improved profitability metrics significantly. This strategic trade-off demonstrates management's commitment to long-term value creation over short-term revenue maximization.
The HD vs LOW value comparison becomes particularly interesting when examining revenue quality rather than quantity. Lowe's improved customer mix, enhanced product margins, and operational efficiency gains suggest sustainable competitive advantages that may not be fully reflected in current market valuations.
Profitability Deep Dive: Operational Excellence Analysis
Gross Margin Stability and Implications
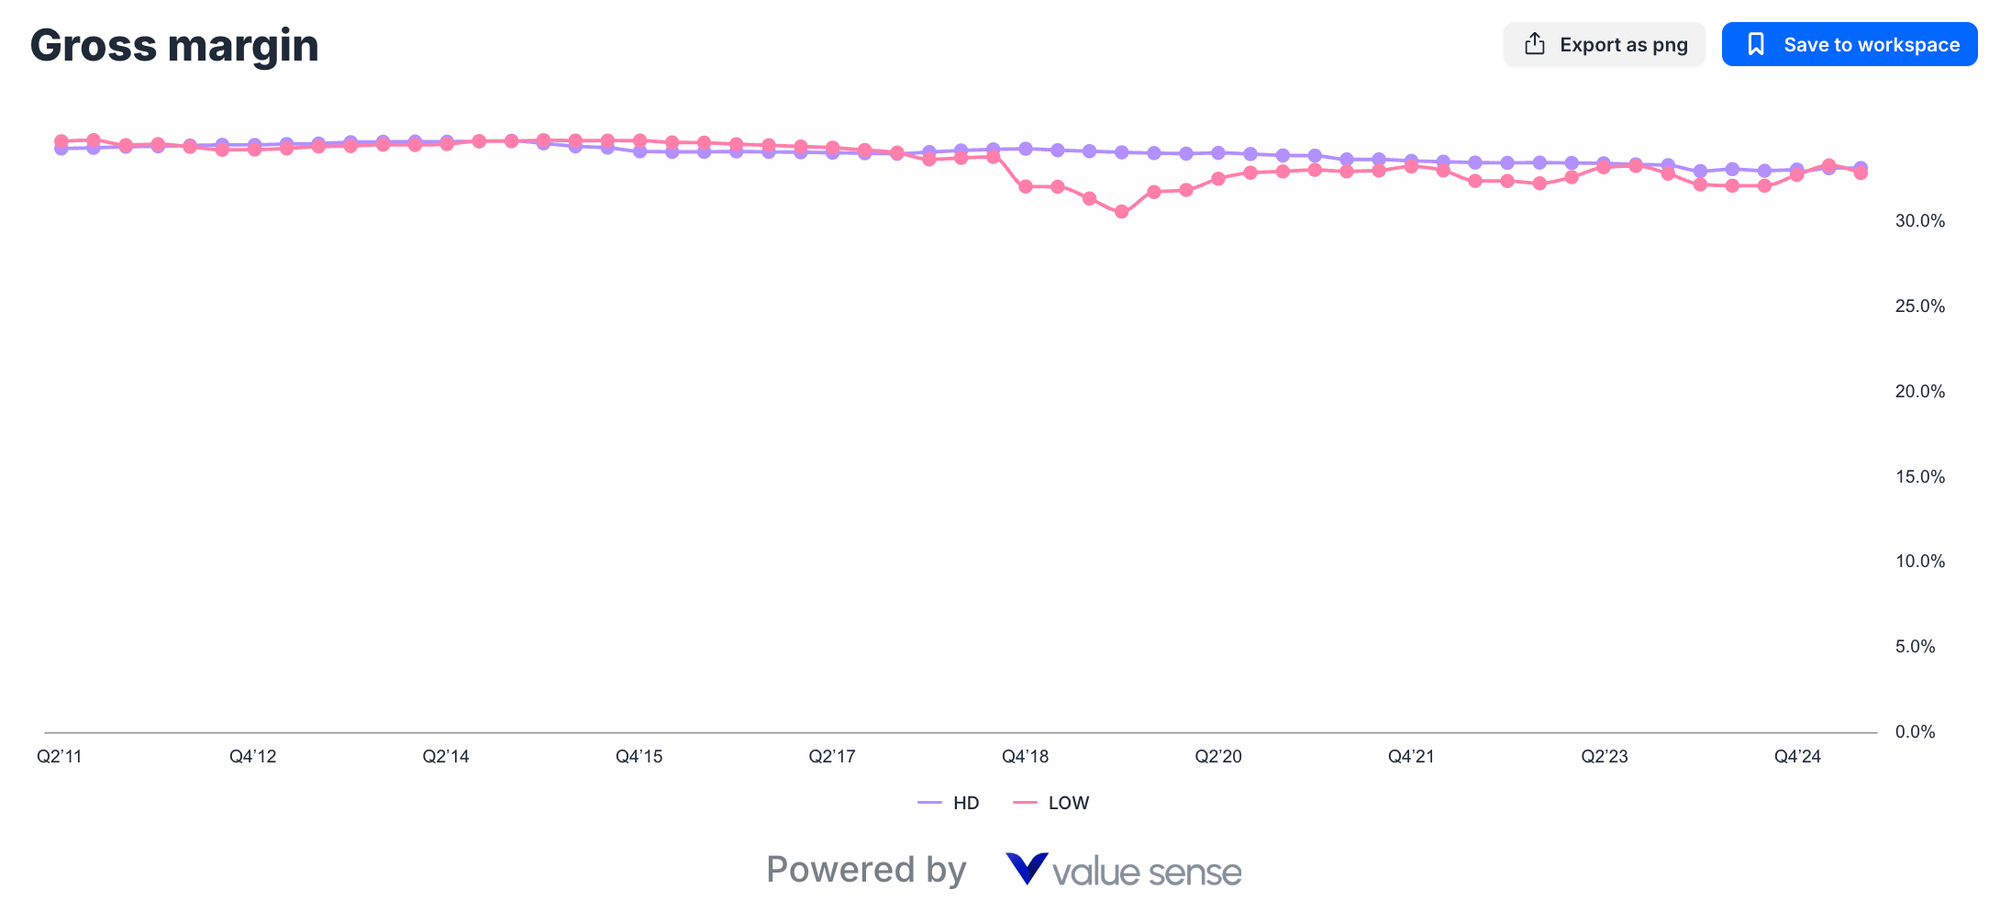
Both companies maintain remarkably consistent gross margins - Home Depot at 33.2% versus Lowe's 32.9% - indicating mature, well-managed operations with established competitive positioning. This narrow margin differential suggests several important factors:
Pricing Power Parity: Both retailers maintain similar pricing strategies and customer value propositions, indicating healthy competitive balance rather than destructive price competition.
Supply Chain Efficiency: Comparable gross margins reflect operational maturity and effective vendor relationship management across both organizations.
Product Mix Optimization: Both companies have successfully optimized product categories and SKU management to maintain stable profitability despite inflationary pressures.
The slight advantage Home Depot maintains in gross margins likely reflects scale benefits in purchasing and logistics, though Lowe's competitive position remains strong and sustainable.
Free Cash Flow: The Ultimate Efficiency Metric
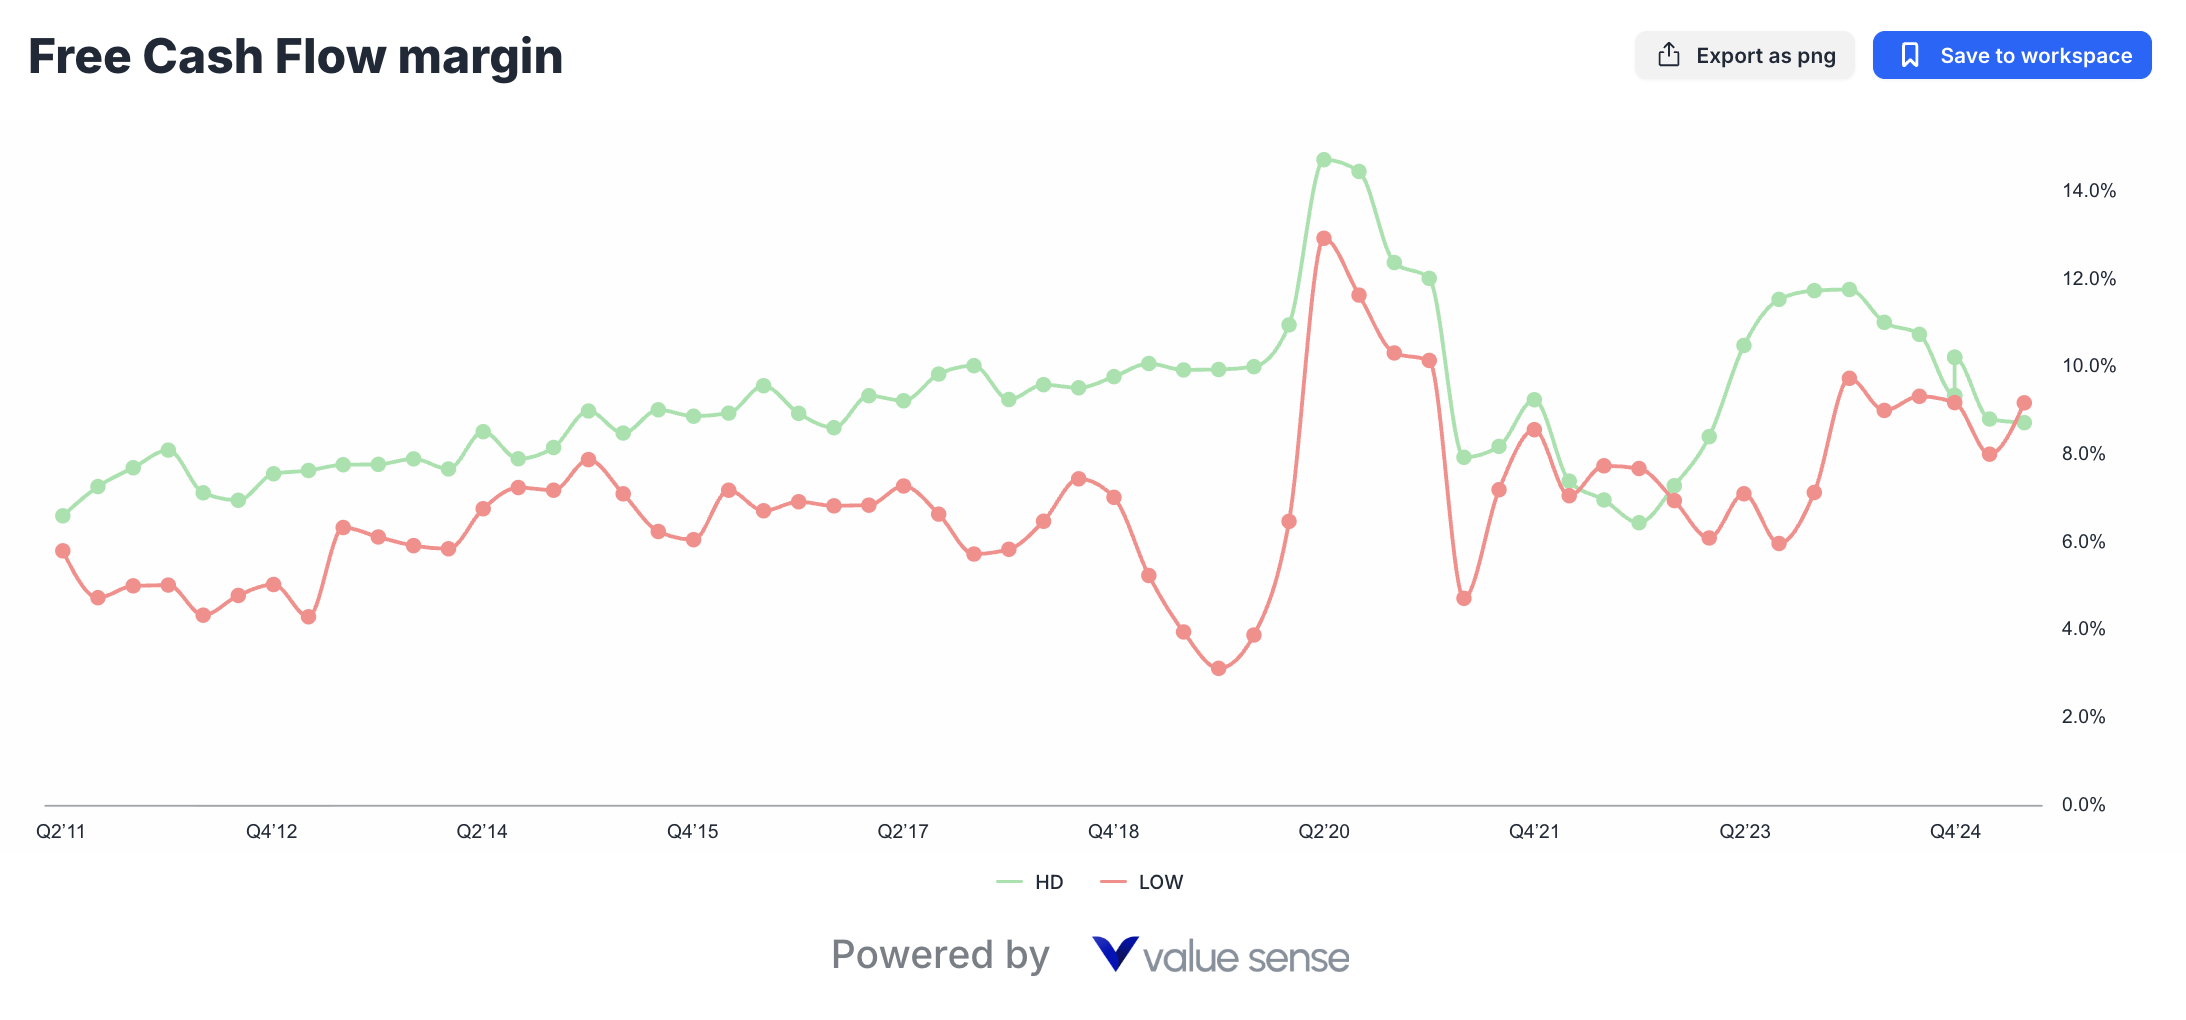
Free cash flow analysis reveals where Lowe's operational improvements create meaningful competitive advantages. LOW's superior 9.2% free cash flow margin compared to HD's 8.7% represents significant cash generation efficiency that directly benefits shareholders.
Working Capital Management: Lowe's improved inventory turnover and accounts receivable management contribute to superior cash conversion cycles.
Capital Allocation Discipline: Management's focused approach to capital expenditures and strategic investments maximizes cash flow generation while maintaining competitive positioning.
Debt Management: Efficient balance sheet management and optimal capital structure decisions enhance free cash flow available for shareholder returns.
This free cash flow advantage becomes particularly valuable during economic uncertainty, providing Lowe's with financial flexibility for strategic investments, debt reduction, or shareholder returns that may not be fully appreciated by current market valuations.
Return on Investment: Capital Efficiency Championship
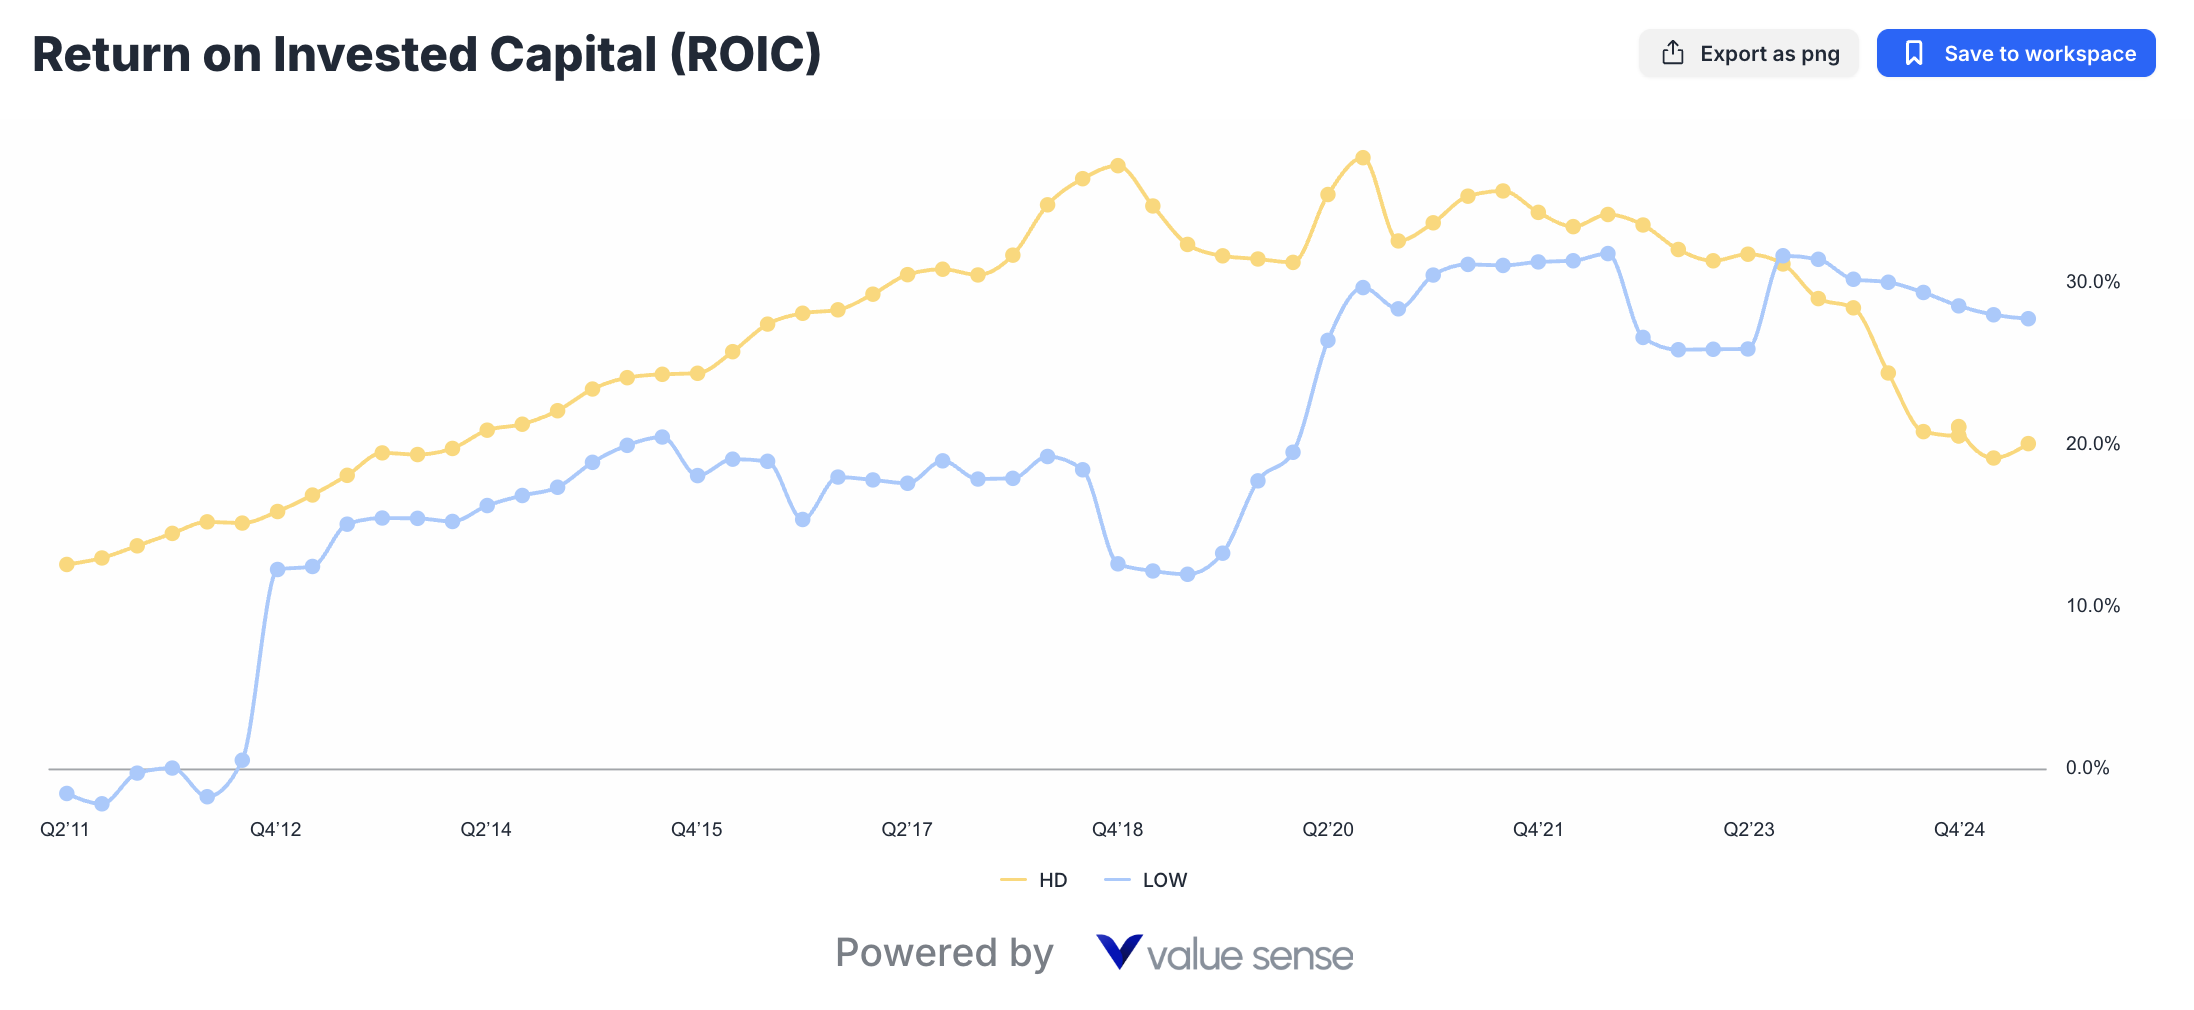
Lowe's ROIC Advantage Explained
Lowe's outstanding 27.8% Return on Invested Capital versus Home Depot's 20.1% represents one of the most compelling arguments for LOW's undervaluation. This 7.7 percentage point advantage reflects fundamental operational and strategic superiority in several key areas:
Asset Utilization: Lowe's store optimization strategy has improved sales per square foot and overall asset productivity, generating higher returns on physical infrastructure investments.
Inventory Management: Enhanced demand forecasting, improved vendor relationships, and strategic category management reduce working capital requirements while maintaining service levels.
Technology Investments: Strategic IT and digital infrastructure investments generate measurable productivity improvements and customer experience enhancements that drive profitable growth.
Strategic Focus: Management's disciplined approach to market selection, store formats, and capital allocation ensures investments generate superior risk-adjusted returns.
The sustainability of this ROIC advantage depends on Lowe's ability to maintain operational excellence while potentially scaling successful initiatives across the broader organization.
Home Depot's Scale-Driven Returns
While Home Depot's 20.1% ROIC remains impressive by absolute standards, the gap with Lowe's suggests potential efficiency opportunities within HD's larger, more complex operation.
Complexity Challenges: Managing 2,300+ locations across diverse markets creates operational complexity that may limit efficiency gains achievable by smaller, more focused competitors.
Legacy Infrastructure: Some of Home Depot's established processes and systems may require modernization to achieve optimal capital efficiency.
Market Maturity: As the dominant market leader, HD may face diminishing returns on incremental investments in mature markets.
However, Home Depot's scale advantages in technology development, logistics infrastructure, and supplier relationships provide sustainable competitive moats that support consistent, if not spectacular, returns on invested capital.
Valuation Framework: Price vs. Value Analysis
P/E Ratio Comparison and Market Expectations
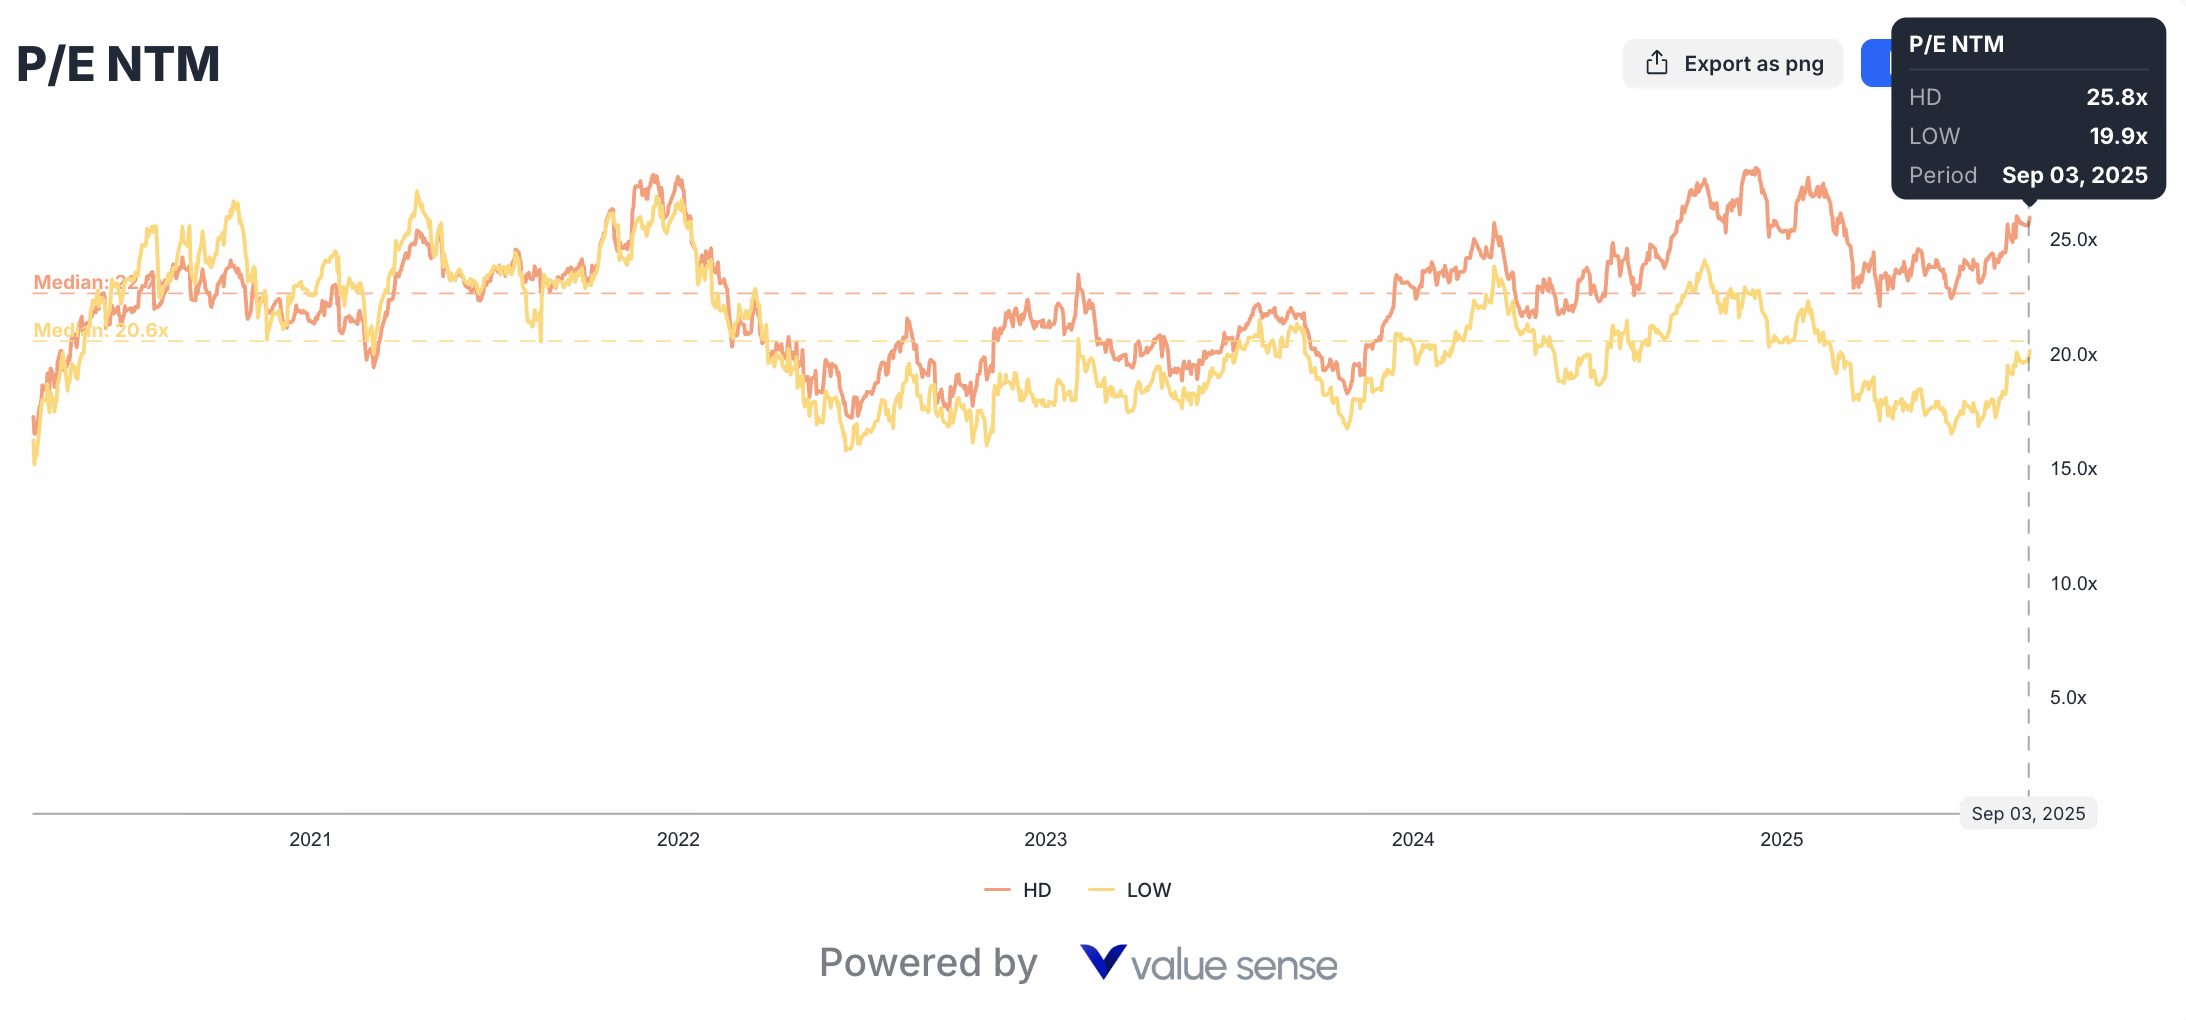
The 22% valuation discount Lowe's trades at (20.2x P/E vs HD's 26.0x) represents either a significant market inefficiency or justified skepticism about LOW's growth prospects relative to Home Depot's established market leadership.
Market Leadership Premium: Home Depot's higher valuation partly reflects investor confidence in the company's market position, competitive moats, and historical execution consistency.
Growth Expectations: HD's premium valuation suggests market expectations for superior growth sustainability, market share gains, and profit expansion capabilities.
Risk Assessment: Lower valuations sometimes reflect higher perceived execution risk, competitive threats, or business model challenges that sophisticated investors have identified.
The key question for value investors: does Lowe's operational improvement trajectory justify closing this valuation gap, potentially providing superior risk-adjusted returns?
Enterprise Value and Total Return Potential
Beyond simple P/E comparisons, comprehensive valuation analysis requires examining enterprise value, debt positions, and total return potential including dividend yields and potential capital appreciation.
Debt-Adjusted Valuations: Both companies maintain reasonable debt levels, though differences in leverage ratios and interest coverage affect enterprise value calculations and financial risk profiles.
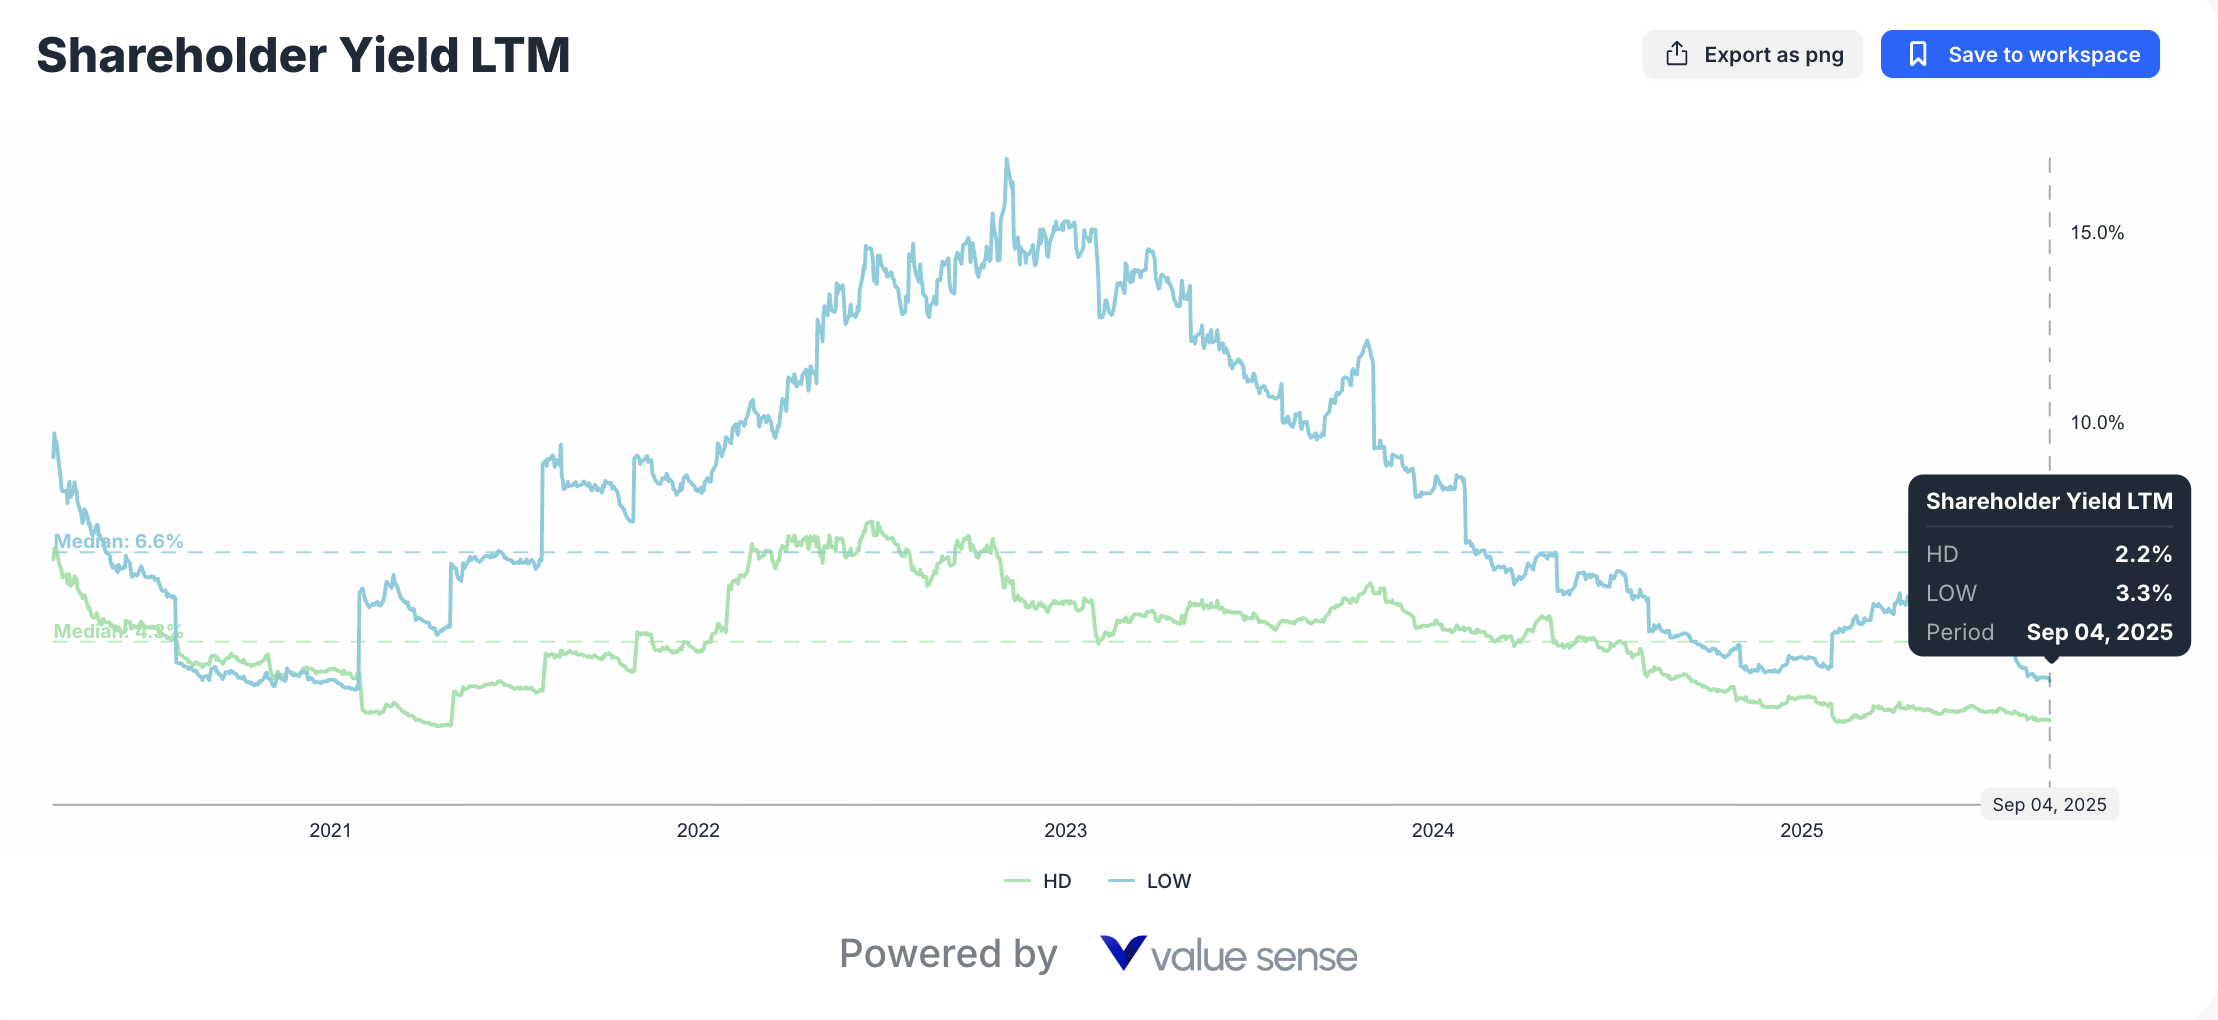
Dividend Sustainability: Lowe's higher 3.3% yield versus HD's 2.2% reflects different capital allocation priorities and payout ratio strategies that impact total return calculations.
Multiple Expansion Potential: Lowe's lower valuation multiple provides greater potential for multiple expansion if operational improvements continue and market perception shifts positively.
Market Position and Competitive Dynamics
Professional vs. DIY Customer Segmentation
Understanding customer segment dynamics proves crucial for evaluating long-term competitive positioning and growth sustainability for both retailers.
Professional Contractor Relationships: Home Depot's superior professional business relationships provide stable, high-volume revenue streams with predictable ordering patterns and higher average transaction values.
DIY Market Evolution: Changing demographics, urbanization trends, and economic pressures affect DIY customer behavior, potentially favoring different retail approaches and service models.
Omnichannel Integration: Both companies invest heavily in digital capabilities, but execution differences and customer adoption rates may create competitive advantages or disadvantages over time.
Category Management and Product Innovation
Exclusive Brands: Private label and exclusive brand strategies affect margins, customer loyalty, and competitive differentiation in ways that may not be immediately apparent in financial metrics.
Technology Integration: Smart home products, IoT integration, and digital tools create new revenue opportunities while potentially disrupting traditional product categories.
Supply Chain Innovation: Automation, AI-driven demand forecasting, and logistics optimization provide sustainable competitive advantages that compound over time.
Financial Strength and Risk Assessment
Balance Sheet Analysis
Liquidity Position: Both companies maintain adequate liquidity for operations and strategic investments, though differences in cash management and credit facility utilization affect financial flexibility.
Debt Management: Interest rate sensitivity analysis reveals how changing borrowing costs impact profitability and investment capacity for each company.
Working Capital Efficiency: Inventory management, supplier payment terms, and customer financing programs affect cash flow timing and capital requirements.
Operational Risk Factors
Economic Sensitivity: Housing market cycles, consumer confidence, and discretionary spending patterns affect both companies differently based on customer mix and product categories.
Supply Chain Vulnerabilities: Global supply chain disruptions, commodity price volatility, and vendor relationship management present ongoing operational challenges.
Regulatory Environment: Building codes, environmental regulations, and safety standards create compliance costs and operational complexity that affect profitability.
Strategic Initiatives and Future Growth Catalysts
Home Depot's Innovation Pipeline
Technology Investments: HD's substantial technology spending focuses on supply chain optimization, customer experience enhancement, and operational efficiency improvements.
Market Expansion: Geographic expansion opportunities, particularly in underserved markets or international locations, provide potential growth catalysts.
Professional Services: Expanding installation and professional services capabilities creates higher-margin revenue streams and stronger customer relationships.
Lowe's Transformation Potential
Operational Excellence: Continued execution of operational improvement initiatives may generate sustained profitability gains and competitive advantage expansion.
Market Share Gains: Strategic focus on specific customer segments and geographic markets could enable share gains from competitors including Home Depot.
Digital Innovation: Investments in e-commerce capabilities, mobile applications, and customer experience technology may differentiate LOW's market positioning.
Comprehensive Financial Metrics Comparison
| Financial Metric | Home Depot (HD) | Lowe's (LOW) | Advantage | Analysis |
|---|---|---|---|---|
| Revenue (Q2'25) | $164.5B | $83.6B | HD | Scale advantage provides purchasing power and market influence |
| Revenue Growth | 6.4% | -0.5% | HD | HD maintains growth momentum while LOW faces temporary contraction |
| Gross Margin | 33.2% | 32.9% | HD (slight) | Comparable profitability indicates competitive parity |
| Free Cash Flow Margin | 8.7% | 9.2% | LOW | Superior cash generation efficiency benefits shareholders |
| ROIC | 20.1% | 27.8% | LOW | Exceptional capital efficiency suggests operational excellence |
| P/E Ratio (NTM) | 26.0x | 20.2x | LOW | 22% valuation discount provides value opportunity |
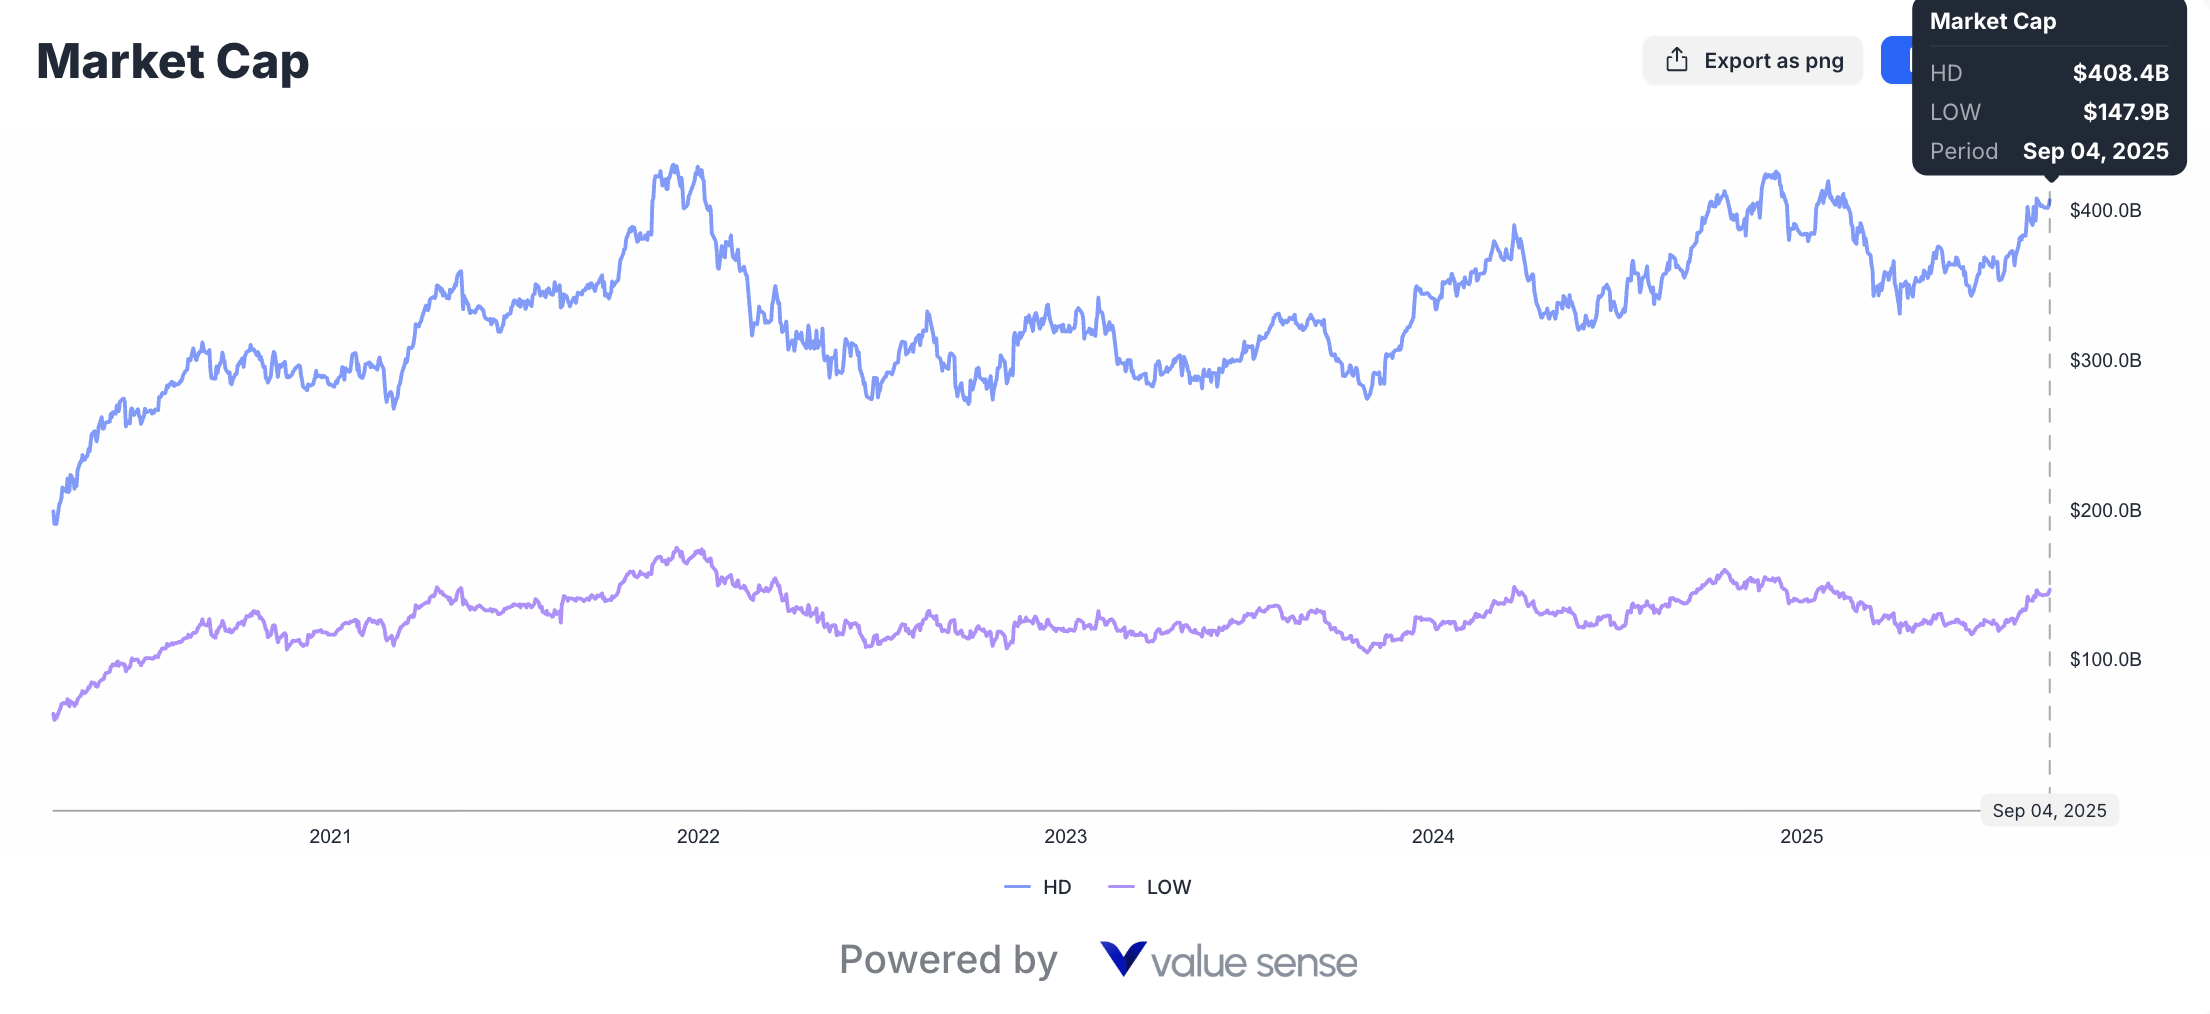
| Market Cap | $404.4B | $145.7B | HD | Market leadership reflected in premium valuation |
| Shareholder Yield | 2.2% | 3.3% | LOW | Higher income generation for dividend-focused investors |
| Debt-to-Equity | Moderate | Moderate | Neutral | Both maintain conservative financial leverage |
| Asset Turnover | Higher | Lower | HD | Scale enables better asset utilization |
| Inventory Turnover | Standard | Improving | LOW | Operational improvements enhance working capital management |
| Operating Margin | Stable | Expanding | LOW | Efficiency gains drive margin improvement |
Investment Thesis Development
The Case for Home Depot
Market Leadership Sustainability: HD's dominant market position, established customer relationships, and scale advantages create sustainable competitive moats that justify premium valuations during uncertain economic periods.
Growth Consistency: Despite cyclical pressures, Home Depot demonstrates superior revenue growth consistency and market share expansion capabilities that support long-term value creation.
Professional Market Dominance: The company's strength in professional contractor relationships provides stability and growth potential that may be underappreciated in current market conditions.
Technology Leadership: Substantial investments in digital capabilities, supply chain technology, and customer experience innovations position HD for continued competitive advantage expansion.
The Case for Lowe's
Valuation Opportunity: The 22% discount to Home Depot's valuation multiple, combined with superior operational metrics, suggests significant undervaluation that may correct as market recognition improves.
Operational Excellence: Management's successful transformation initiatives demonstrate execution capability and strategic focus that generate measurable shareholder value improvements.
Capital Efficiency Leadership: Superior ROIC and free cash flow generation indicate fundamental operational advantages that compound over time and benefit long-term investors.
Income Generation: Higher dividend yield and shareholder return programs provide attractive income characteristics while investors await capital appreciation.
Sector Analysis and Market Dynamics
Home Improvement Industry Outlook
Demographic Trends: Aging housing stock, urbanization patterns, and generational preferences affect long-term demand for home improvement products and services.
Economic Sensitivity: Interest rates, employment levels, and consumer confidence directly impact discretionary home improvement spending and project timing.
Technology Disruption: E-commerce growth, augmented reality tools, and smart home integration create new opportunities while potentially disrupting traditional retail models.
Competitive Landscape Evolution
Regional Players: Local and regional competitors may gain market share in specific categories or geographic markets through specialized focus or competitive pricing.
Online Competition: Amazon and other e-commerce platforms continue expanding home improvement offerings, potentially affecting traditional retail market dynamics.
Professional Services: Installation and professional services represent growing market segments that may favor companies with established contractor relationships and capabilities.
Risk Analysis and Scenario Planning
Economic Downside Scenarios
Recession Impact: Historical analysis of both companies' performance during economic downturns provides insights into relative resilience and recovery patterns.
Housing Market Correction: Declining home values, reduced construction activity, and deferred maintenance spending could disproportionately affect either company.
Consumer Behavior Changes: Shifts toward professional services, rental housing preferences, or urban living could alter demand patterns for traditional home improvement products.
Competitive Threats
Technology Disruption: Advanced manufacturing, 3D printing, and direct-to-consumer models may bypass traditional retail channels for certain product categories.
Supply Chain Innovation: Competitors with superior logistics, inventory management, or vendor relationships could gain sustainable cost advantages.
Market Consolidation: Potential mergers, acquisitions, or strategic partnerships could alter competitive dynamics and market positioning.
ESG Considerations and Sustainability Impact
Environmental Initiatives
Sustainable Products: Both companies invest in environmentally friendly product lines, energy-efficient solutions, and sustainable building materials that appeal to environmentally conscious consumers.
Operations Sustainability: Store energy efficiency, waste reduction programs, and carbon footprint management affect operational costs and brand reputation.
Supply Chain Responsibility: Vendor sustainability requirements and ethical sourcing initiatives may impact supplier relationships and product availability.
Social Responsibility
Community Impact: Local employment, community development programs, and disaster response capabilities create positive social impact while supporting business objectives.
Employee Relations: Workforce development, compensation practices, and workplace safety records affect operational efficiency and public perception.
Customer Accessibility: Store locations, product affordability, and service accessibility ensure broad customer base maintenance and expansion.
Technical Analysis and Market Sentiment
Stock Performance Patterns
Historical Volatility: Both stocks demonstrate cyclical performance patterns correlated with housing market cycles, economic conditions, and seasonal factors.
Relative Strength: Comparative analysis of stock performance versus market indices reveals investor sentiment trends and relative attractiveness.
Institutional Ownership: Professional investor positioning and recent changes in institutional holdings provide insights into sophisticated investor perspectives.
Market Timing Considerations
Seasonal Factors: Home improvement spending follows predictable seasonal patterns that affect quarterly results and stock performance timing.
Economic Cycle Positioning: Both companies' performance relative to economic cycles helps investors optimize entry and exit timing strategies.
Interest Rate Sensitivity: Rising or falling interest rates affect housing markets, consumer financing costs, and ultimately home improvement spending patterns.
Investment Strategy Recommendations
Conservative Value Approach
Lowe's Preference: Risk-averse investors seeking undervalued opportunities with improving fundamentals should consider LOW's attractive valuation metrics, superior capital efficiency, and income generation capabilities.
Dividend Focus: Lowe's higher yield provides steady income while investors await potential multiple expansion as operational improvements gain market recognition.
Downside Protection: Lower valuation multiples provide some downside protection during market volatility while maintaining upside potential from operational improvements.
Growth-Oriented Strategy
Home Depot Selection: Investors prioritizing consistent growth, market leadership, and proven execution capabilities may prefer HD despite premium valuations.
Scale Advantages: Home Depot's superior scale, market position, and professional relationships provide sustainable competitive advantages during economic uncertainty.
Technology Leadership: HD's investments in digital capabilities and omnichannel integration position the company for long-term market share expansion.
Balanced Portfolio Approach
Dual Holding Strategy: Sophisticated investors might consider positions in both companies, weighting allocations based on market conditions, valuation disparities, and personal risk tolerance.
Relative Value Trading: Active investors could exploit valuation gaps and performance divergences through relative positioning adjustments over time.
Sector Diversification: Both stocks provide exposure to home improvement sector growth while offering different risk-return profiles and competitive positioning strategies.
Future Outlook and Catalysts
Short-Term Catalysts (6-12 months)
Earnings Momentum: Quarterly results that demonstrate continued operational improvement for Lowe's or sustained growth for Home Depot could catalyze stock performance.
Economic Indicators: Housing market data, consumer confidence measures, and employment statistics will affect investor sentiment and sector performance.
Strategic Announcements: Management initiatives, technology investments, or strategic partnerships could alter market perceptions and competitive positioning.
Medium-Term Drivers (1-3 years)
Market Share Evolution: Changes in competitive positioning, customer preferences, or operational capabilities could shift market dynamics between the companies.
Technology Integration: Successful implementation of digital initiatives, supply chain innovations, or customer experience improvements may create sustainable competitive advantages.
Economic Recovery: Post-pandemic economic normalization, housing market stability, and consumer spending patterns will determine sector growth trajectory.
Long-Term Considerations (3-5 years)
Industry Evolution: Fundamental changes in home improvement retail, consumer behavior, or competitive landscape could alter investment thesis assumptions.
Demographic Shifts: Generational changes, urbanization trends, and housing preferences may require strategic adaptations that favor different competitive approaches.
Sustainability Integration: Environmental regulations, consumer preferences, and operational sustainability requirements could affect competitive positioning and profitability.
The Final Verdict: Home Depot vs Lowe's Undervalued Analysis
After comprehensive analysis of financial metrics, competitive positioning, market dynamics, and future prospects, Lowe's emerges as the more undervalued investment opportunity for several compelling reasons:
Quantitative Advantages
Valuation Discount: The 22% P/E discount (20.2x vs 26.0x) provides significant margin of safety while operational improvements continue generating results.
Capital Efficiency Superiority: Lowe's exceptional 27.8% ROIC versus Home Depot's 20.1% demonstrates fundamental operational excellence that creates sustainable competitive advantages.
Cash Generation Excellence: Superior 9.2% free cash flow margin provides financial flexibility and shareholder return capacity that supports investment thesis durability.
Income Advantage: The 3.3% shareholder yield versus HD's 2.2% provides attractive income generation while investors await capital appreciation from multiple expansion.
Qualitative Considerations
Transformation Success: Management's successful operational improvement initiatives demonstrate execution capability and strategic focus that generates measurable value creation.
Market Recognition Gap: Current valuations suggest market underappreciation of Lowe's operational improvements and competitive position enhancements.
Upside Potential: Lower valuation multiples combined with improving fundamentals create attractive risk-adjusted return potential compared to Home Depot's premium-priced shares.
Strategic Positioning
Operational Leverage: Continued execution of efficiency initiatives provides multiple paths for profitability improvement and competitive advantage expansion.
Market Share Opportunity: Strategic focus and operational excellence create potential for market share gains from competitors, including Home Depot.
Financial Flexibility: Superior cash generation and conservative balance sheet management provide strategic options for growth investments, acquisitions, or enhanced shareholder returns.
However, Home Depot remains an excellent choice for investors prioritizing:
- Proven market leadership and scale advantages
- Consistent growth momentum and execution track record
- Professional market dominance and customer relationship strength
- Technology leadership and innovation capabilities
The choice ultimately depends on individual investment philosophy, risk tolerance, and portfolio objectives. Value investors seeking undervalued opportunities with operational improvement catalysts should favor Lowe's, while growth-oriented investors prioritizing market leadership and proven execution may prefer Home Depot.
Both companies represent quality investments in the resilient home improvement sector, but Lowe's current valuation discount combined with superior operational metrics makes it the more attractive home improvement value opportunity in 2025's investment landscape.
Explore More Investment Opportunities

For investors seeking undervalued companies with high fundamental quality, our analytics team provides curated stock lists:
📌 50 Undervalued Stocks (Best overall value plays for 2025)
📌 50 Undervalued Dividend Stocks (For income-focused investors)
📌 50 Undervalued Growth Stocks (High-growth potential with strong fundamentals)
🔍 Check out these stocks on the Value Sense platform for free!
More Articles You Might Like
📖 Intel Stock Turnaround: Undervalued Chip Giant
📖 Undervalued Cloud Computing Stocks September 2025
FAQ - Home Depot vs Lowe's
Q: Which stock is cheaper based on fundamental valuation metrics - Home Depot or Lowe's?
A: Lowe's is significantly cheaper across multiple valuation metrics. LOW trades at 20.2x forward P/E compared to HD's 26.0x, representing a substantial 22% valuation discount. Additionally, Lowe's offers superior shareholder yield at 3.3% versus Home Depot's 2.2%, providing 50% higher income returns. The enterprise value-to-EBITDA ratios also favor Lowe's, making it the clear winner from a pure valuation perspective.
Q: Why does Lowe's generate better return on invested capital than Home Depot?
A: Lowe's exceptional 27.8% ROIC versus Home Depot's 20.1% results from several strategic and operational factors. Management's store optimization program has improved sales per square foot and asset utilization. Enhanced inventory management and demand forecasting reduce working capital requirements while maintaining service levels. Strategic technology investments generate measurable productivity improvements. Finally, disciplined capital allocation ensures investments generate superior risk-adjusted returns. This ROIC advantage reflects fundamental operational excellence rather than temporary factors.
Q: Does Home Depot's larger size provide sustainable competitive advantages over Lowe's?
A: Yes, Home Depot's superior scale ($404.4B market cap vs $145.7B) creates several meaningful competitive advantages. HD's massive purchasing power enables better vendor negotiations, exclusive product arrangements, and favorable payment terms. The extensive store network provides geographic coverage that reduces logistics costs while improving customer accessibility. Scale also enables more efficient marketing spend and technology development investments. However, Lowe's demonstrates that operational efficiency can compete effectively against pure scale advantages.
Q: Which company offers better dividend income for retirement investors?
A: Lowe's provides significantly better dividend income with 3.3% shareholder yield compared to Home Depot's 2.2%. This 50% higher yield makes LOW more attractive for income-focused investors and retirees seeking steady cash flow. Both companies maintain sustainable payout ratios and have histories of dividend growth, but Lowe's current yield advantage combined with improving cash flow generation provides superior income characteristics. The higher yield also offers some downside protection during market volatility.
Q: Should growth investors choose Home Depot over Lowe's in 2025?
A: Growth investors face a nuanced decision between these companies. Home Depot currently demonstrates superior revenue growth (6.4% vs -0.5% for LOW) and maintains market leadership position with proven execution capabilities. HD's scale advantages and professional market dominance support sustained growth potential. However, Lowe's operational improvements and efficiency gains may generate superior earnings growth despite revenue challenges. The key consideration is whether investors prefer proven growth consistency (HD) or operational leverage potential (LOW). Growth investors should also consider that Lowe's lower valuation provides better risk-adjusted growth potential if operational improvements continue delivering results.