
How Big Tech Makes Money: Analyzing Revenue Streams and Profit Margins of Tech Giants

Welcome to Value Sense Blog
At Value Sense, we provide insights on the stock market, intrinsic value tools, and stock ideas with undervalued companies. You can explore our research products at valuesense.io and learn more about our approach on our site.
Ever wonder how tech bros afford those $19 smoothies and ergonomic standing desks? Turns out, it's because their companies are absolutely raking it in. We're talking hundreds of billions in revenue and profit margins that would make your financial advisor weep tears of joy.
Today, we're diving into the money machines of Silicon Valley's elite – NVIDIA, Apple, Microsoft, Meta, Amazon, Google, and Tesla – to see exactly how they're turning your screen time into shareholder champagne time. Spoiler alert: those targeted ads and cloud subscription fees add up faster than your weekend Uber Eats tab.
NVIDIA: The Data Center Powerhouse
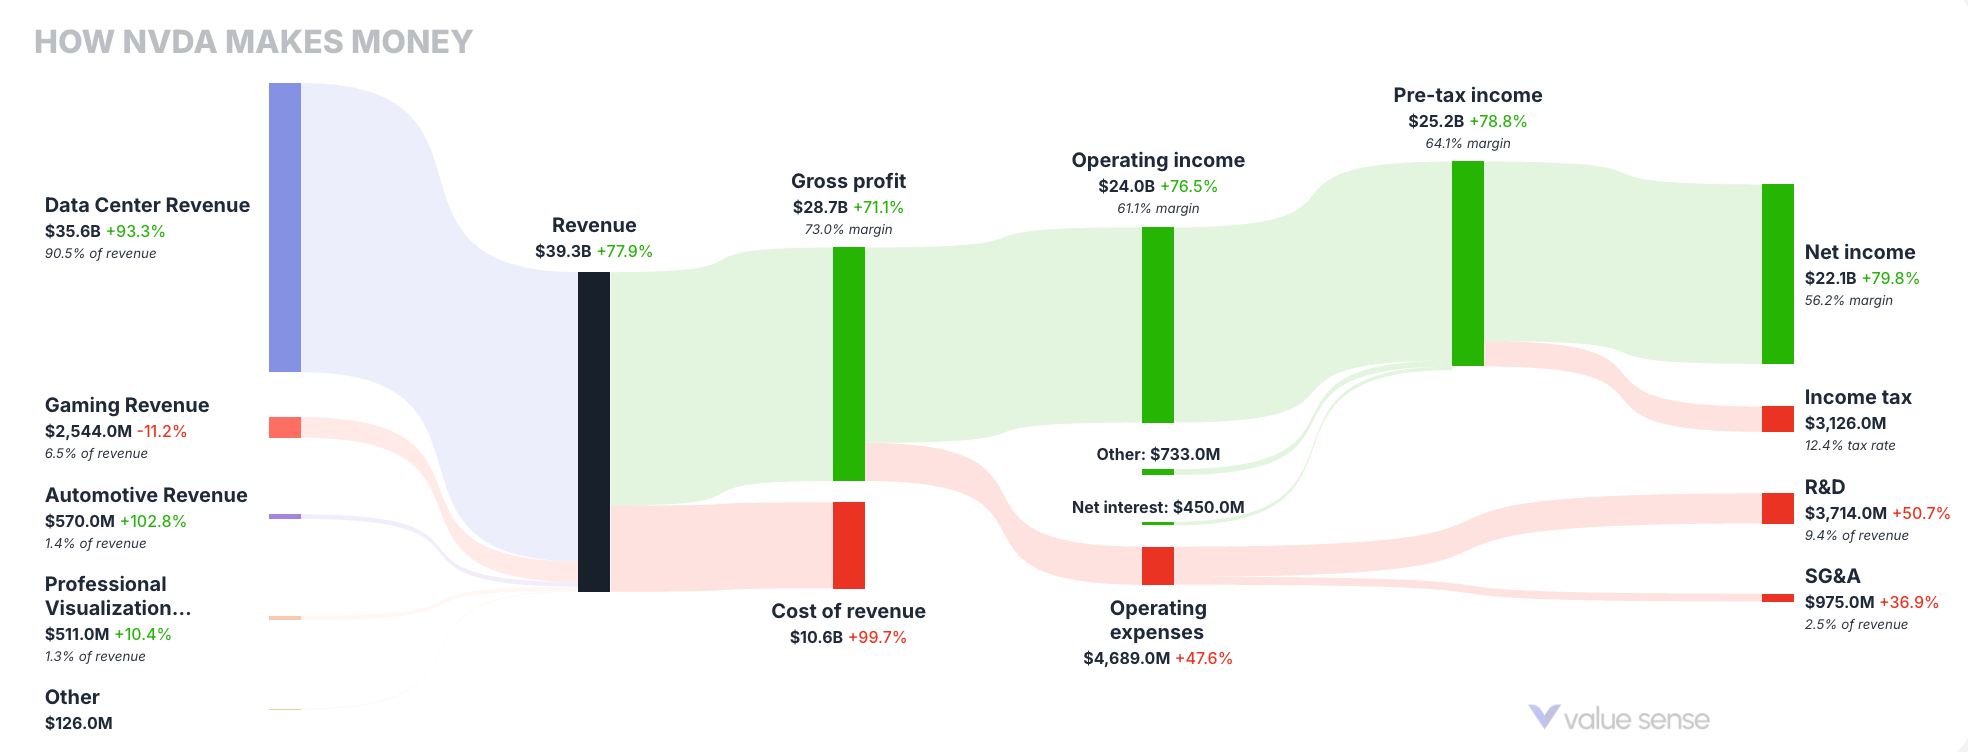
NVIDIA has transformed from a gaming-focused graphics card manufacturer to a dominant force in AI and data processing. Their financial breakdown reveals:
- Total Revenue: $39.3B (+77.4% growth)
- Data Center Revenue: $35.6B (+83.3%) – making up 90.6% of total revenue
- Gaming Revenue: $2.54B (+1.2%) – representing only 6.5% of revenue
- Net Income: $27.1B (+291.2%) with an impressive 68.7% margin
NVIDIA's remarkable pivot to data center technology has paid off enormously, with their AI chips now powering everything from cloud computing to machine learning applications, resulting in nearly 300% net income growth.
Apple: Services Growth Complementing Hardware
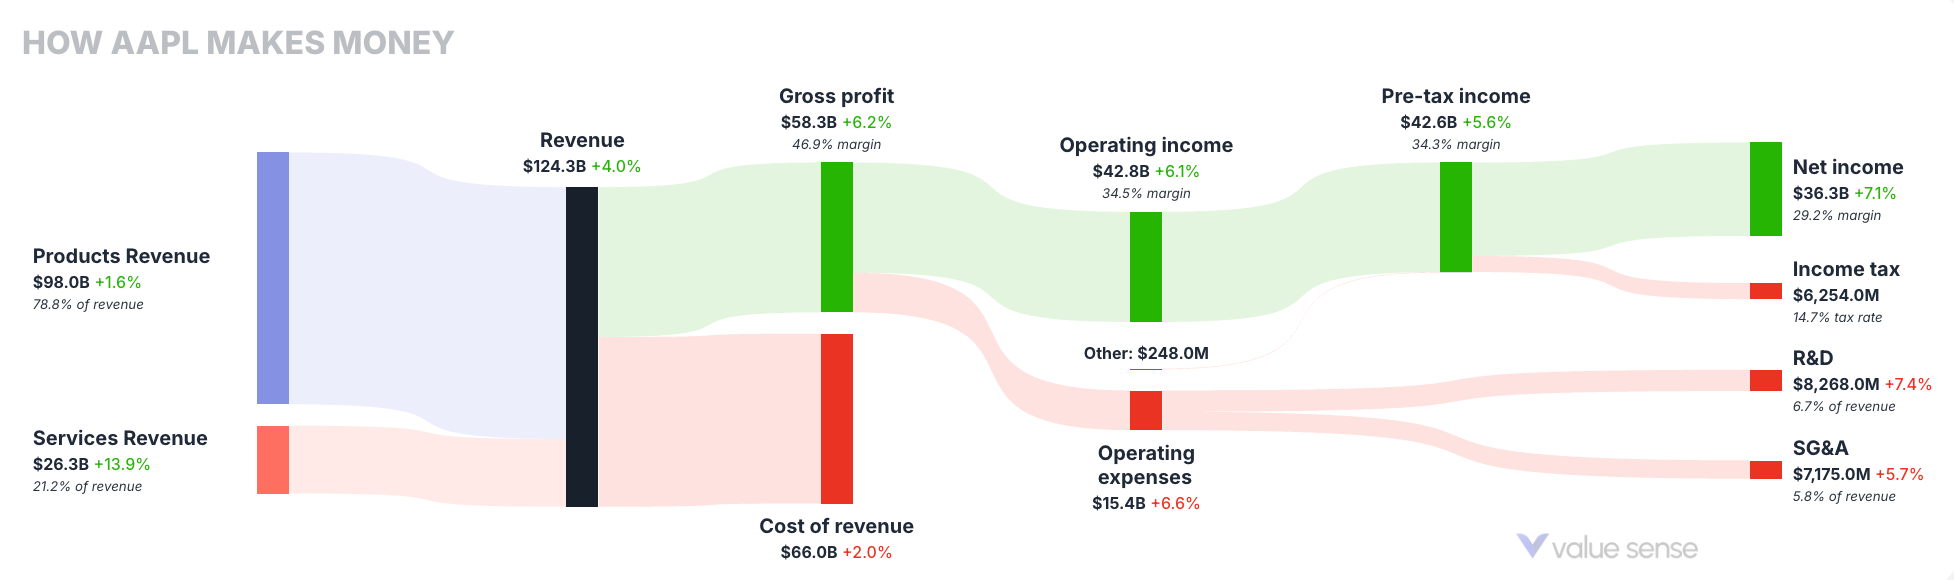
Apple continues to leverage its ecosystem with a strong push into services:
- Total Revenue: $124.3B (+10.0%)
- Products Revenue: $98.0B (+6.8%) – 78.8% of total revenue
- Services Revenue: $26.3B (+15.9%) – 21.2% of revenue and growing faster
- Net Income: $36.3B (+11.1%) with a 29.2% margin
While Apple's hardware remains its primary revenue source, the services segment (including App Store, Apple Music, iCloud, etc.) is growing at more than double the rate, highlighting Apple's successful diversification strategy.
Microsoft: Cloud Leadership Driving Growth
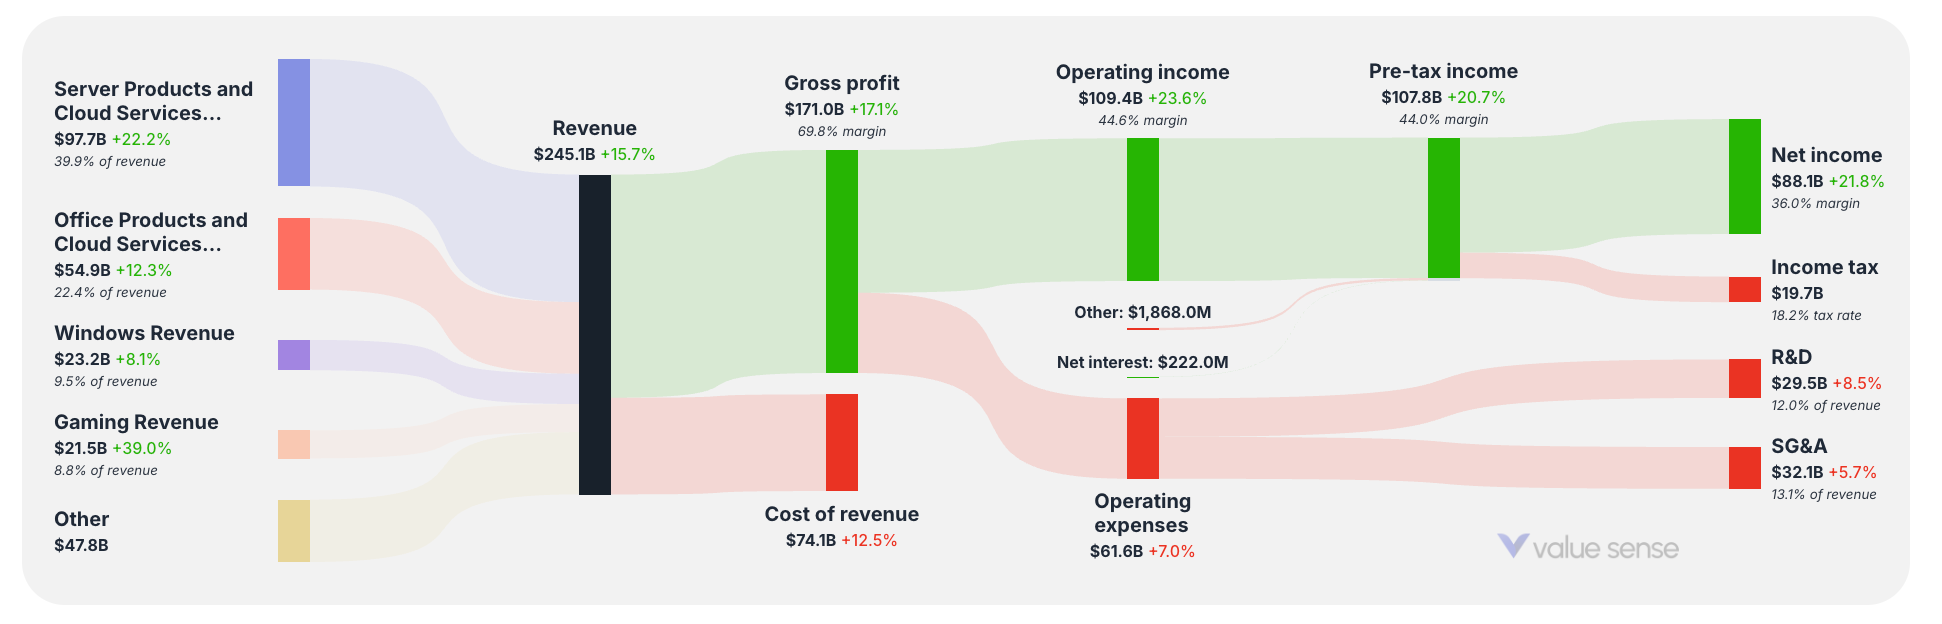
Satya Nadella's cloud revolution is looking more like cloud domination these days:
- Total Revenue: $245.1B (+15.7%)
- Server Products and Cloud Services: $97.7B (+22.2%) – 39.9% of total revenue
- Office Products and Cloud Services: $54.9B (+12.3%) – 22.4% of revenue
- Windows Revenue: $23.2B (+8.1%) – 9.5% of revenue
- Gaming Revenue: $21.5B (+39.0%) – 8.8% of revenue and fastest-growing segment
- Net Income: $88.1B (+21.8%) with a 36.0% margin
- R&D Investment: $29.5B (+8.5%) representing 12.0% of revenue
Microsoft's balanced business model shows impressive growth across all segments, with gaming (likely boosted by the Activision Blizzard acquisition) growing at a blistering 39%. Their cloud empire continues to be the bedrock of their success, contributing nearly 40% of total revenue with over 22% growth. With a 36% profit margin on a $245B revenue base, Microsoft's money printer is operating at full capacity.
Meta: Advertising Giant Achieving Remarkable Growth
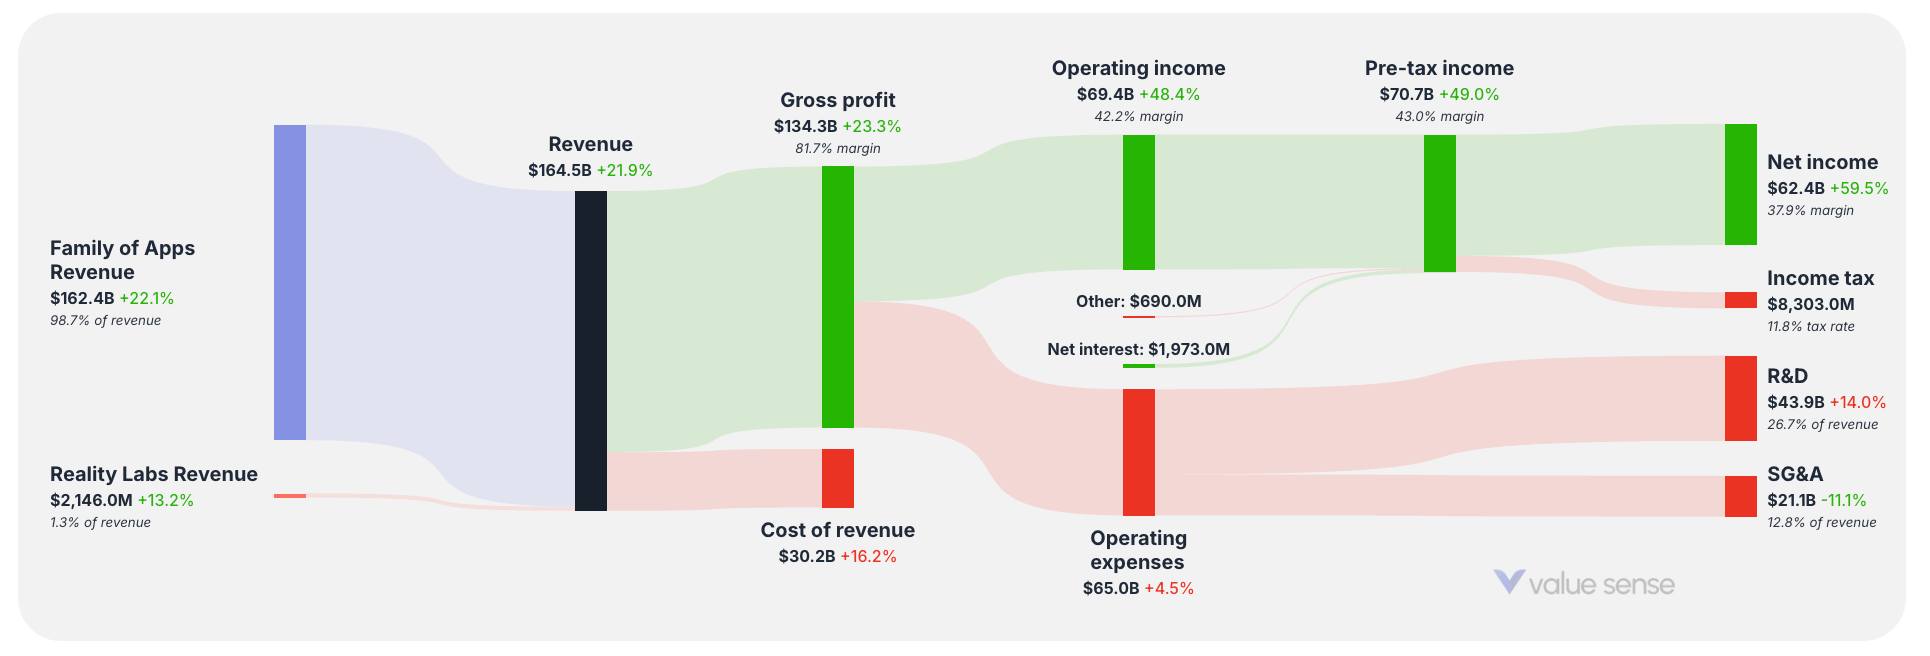
Meta has demonstrated exceptional financial performance in its most recent quarter:
- Total Revenue: $164.5B (+21.9%)
- Family of Apps Revenue: $162.4B (+22.1%) – making up 98.7% of total revenue
- Reality Labs Revenue: $2.15B (+13.2%) – representing just 1.3% of revenue
- Gross Profit: $134.3B (+23.3%) with an 81.7% margin
- Net Income: $62.4B (+59.5%) with a 37.9% margin
- R&D Investment: $43.9B (+14.0%) representing 26.7% of revenue
Meta's dramatic revenue growth is primarily driven by its Family of Apps (Facebook, Instagram, WhatsApp, Messenger), which generate almost 99% of the company's revenue. Despite Reality Labs showing 13.2% growth, it remains a tiny fraction of Meta's business. The company continues to invest heavily in R&D at $43.9B, demonstrating its commitment to future technologies while maintaining impressive profitability from its core advertising business.
Amazon: Diversified Revenue Beyond E-commerce
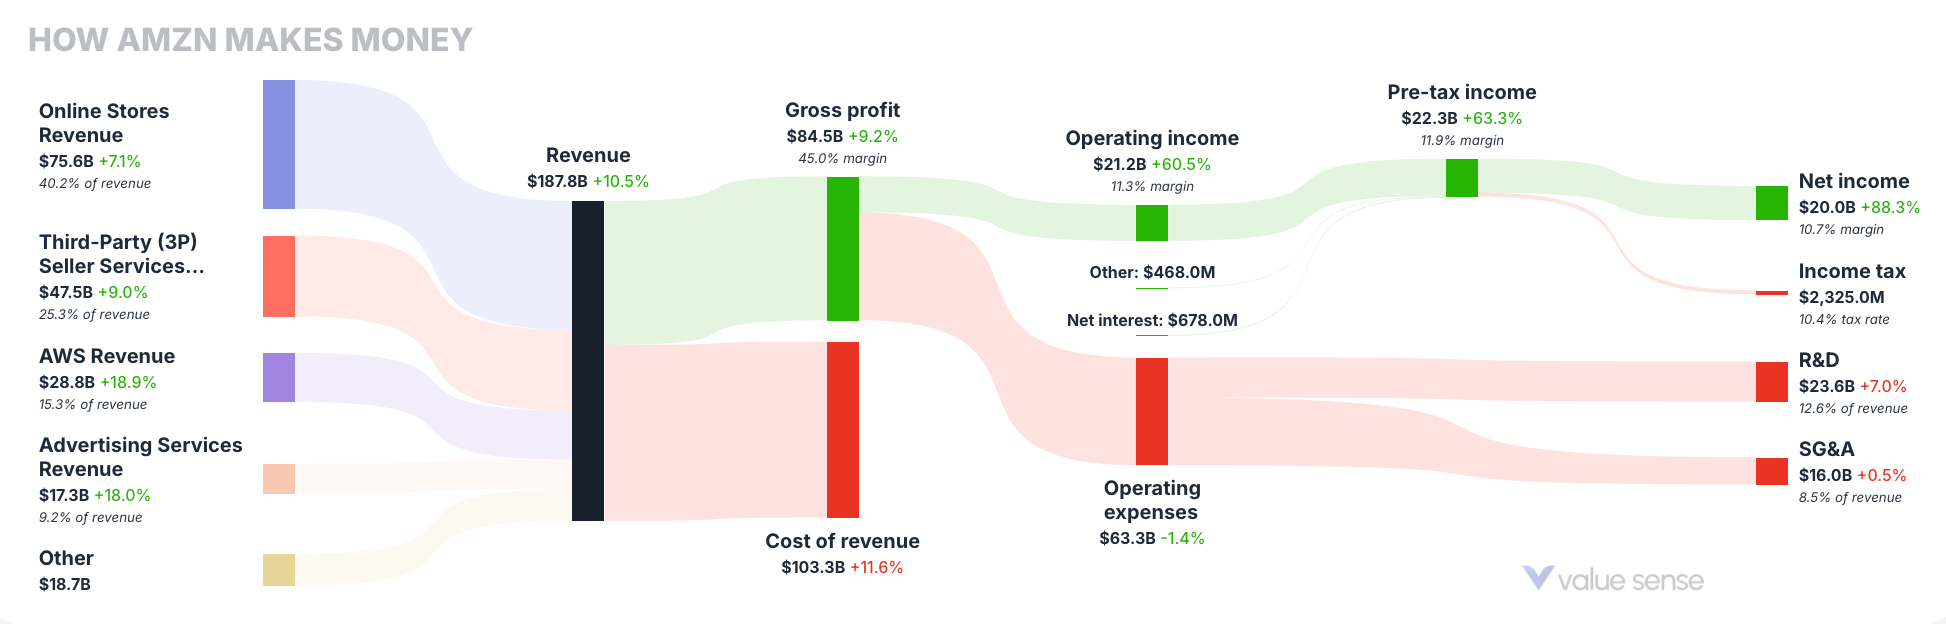
Amazon's multi-faceted business model shows remarkable diversification:
- Total Revenue: $157.8B (+9.3%)
- Online Stores: $75.6B (+2.1%) – 47.9% of revenue
- Third-Party Seller Services: $44.9B (+9.1%) – 28.5% of revenue
- AWS: $28.8B (+19.9%) – 18.3% of revenue and highest growth segment
- Net Income: $14.0B (+34.5%) with an 8.9% margin
While Amazon's e-commerce remains its largest business, AWS (cloud services) continues to be the fastest-growing and highest-margin segment, contributing significantly to overall profitability.
Google: Search and Advertising Dominance
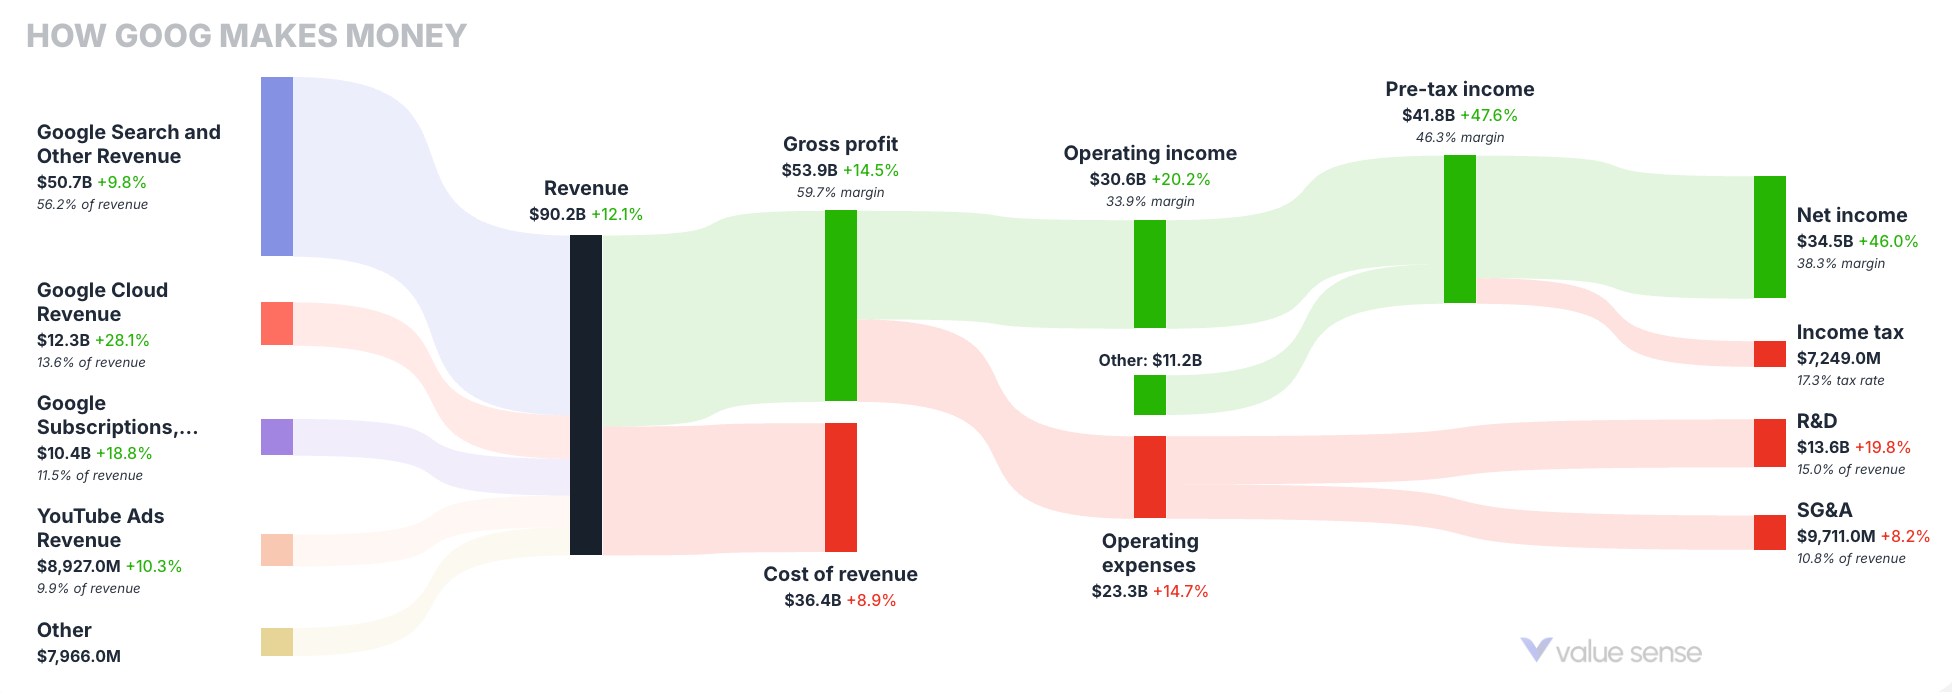
Google's core search business continues to drive impressive results:
- Total Revenue: $90.2B (+12.1%)
- Search and Other Revenue: $50.7B (+8.8%) – 56.2% of total revenue
- Google Cloud: $12.3B (+28.1%) – fast-growing at 13.6% of revenue
- YouTube Ads: $8.9B (+10.3%) – 9.8% of revenue
- Net Income: $34.5B (+10.0%) with a 38.3% margin
Despite diversification efforts, Google's search advertising remains its profit engine with cloud services showing the strongest growth potential.
Tesla: More Than Just Cars
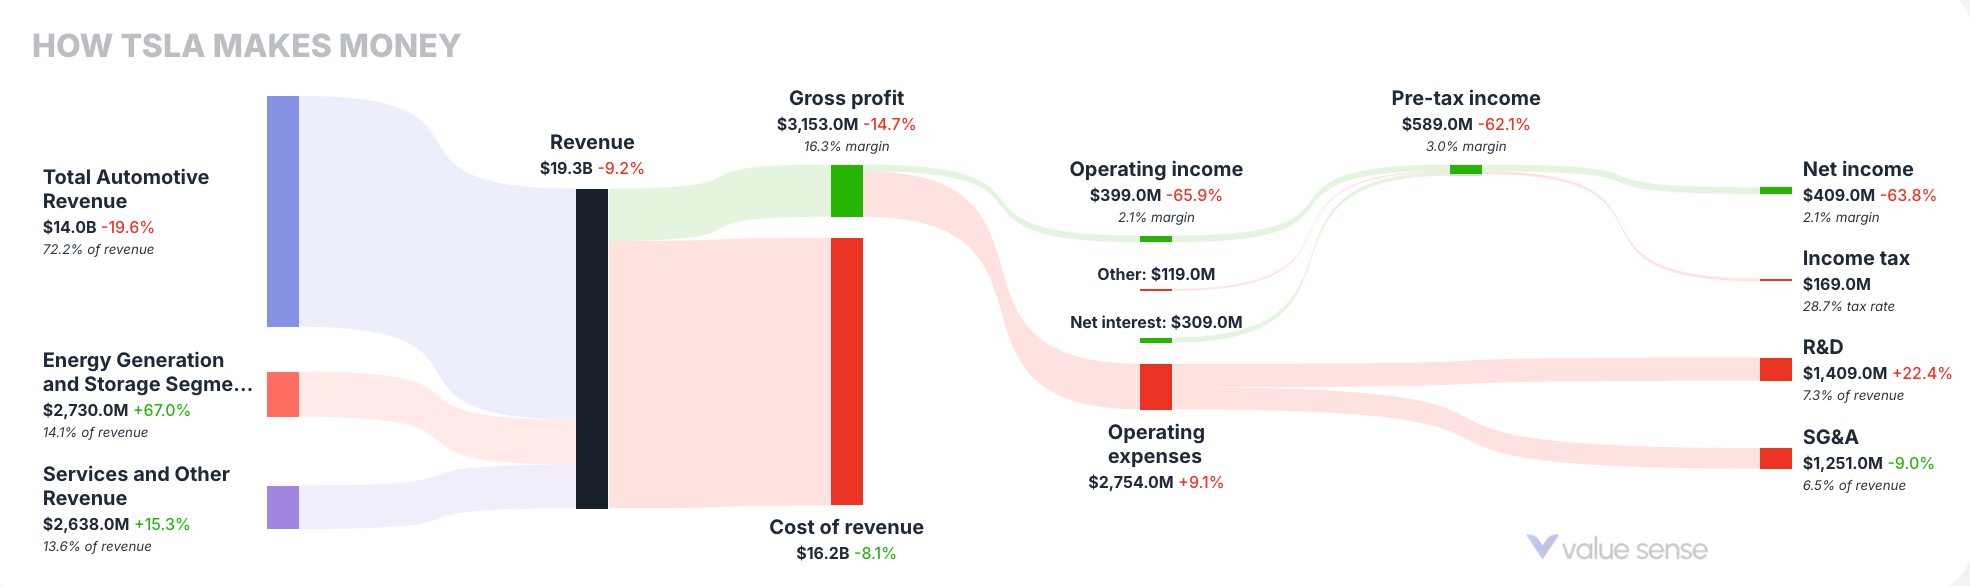
Tesla's financial story shows its evolution beyond automotive:
- Total Revenue: $19.3B (+5.2%)
- Automotive Revenue: $14.0B (+0.7%) – 72.5% of total revenue
- Energy Generation and Storage: $2.7B (+67.0%) – fastest-growing segment
- Services and Other Revenue: $2.6B (+5.3%) – 13.6% of revenue
- R&D Investment: $1.4B (+22.4%) – 7.5% of revenue
While automotive sales remain Tesla's core business, their energy segment is growing at nearly 10x the rate of their car business, highlighting the company's diversification strategy.
Comparative Analysis: R&D Spending vs. Growth
Tech companies throwing cash at R&D like it's confetti at a parade? Let's see who's getting bang for their buck:
- NVIDIA: 9.6% of revenue on R&D → 77.4% revenue growth (efficiency champion)
- Meta: 26.7% of revenue on R&D → 21.9% revenue growth (finally seeing returns)
- Microsoft: 12.0% of revenue on R&D → 15.7% revenue growth (steady Eddie)
- Google: 15.2% of revenue on R&D → 12.1% revenue growth (diminishing returns?)
- Amazon: 12.6% of revenue on R&D → 9.3% revenue growth (complexity tax)
- Apple: 6.7% of revenue on R&D → 10.0% revenue growth (lean machine)
- Tesla: 7.5% of revenue on R&D → 5.2% revenue growth (distracted driver?)
The takeaway? NVIDIA's focused AI chip strategy is crushing it while using less R&D than everyone except Apple and Tesla. Meanwhile, Meta's dumping over a quarter of its revenue into R&D and finally seeing some decent returns. It's not how much you spend—it's where you point it.
Profit Margin Leaders
Net income margins reveal which companies extract the most profit from their revenues:
- NVIDIA: 68.7% net income margin
- Microsoft: 36.8% net income margin
- Google: 38.3% net income margin
- Meta: 37.9% net income margin
- Apple: 29.2% net income margin
- Tesla: 21.3% net income margin
- Amazon: 8.9% net income margin
NVIDIA's extraordinary margin reflects its near-monopoly in AI chips, while Amazon's lower margin demonstrates the thin-margin reality of retail, even at massive scale. Meta maintains an impressive 37.9% net income margin despite its significant R&D investments, showcasing the incredible profitability of its advertising business model.
Conclusion: Diverse Paths to Tech Dominance
This analysis reveals several key insights about big tech's financial success:
- Specialized dominance pays: NVIDIA's focus on AI chips has delivered unparalleled growth and profitability.
- Services and subscriptions matter: All seven companies are investing in recurring revenue streams, with Apple, Microsoft, and Google showing strong results.
- Cloud is the common denominator: Every company except Tesla has significant cloud investments, with Microsoft, Amazon, and Google leading the way.
- Diversification vs. focus: Companies are balancing between specialization (NVIDIA, Meta) and diversification (Amazon, Google) with varying results.
- R&D efficiency matters more than volume: NVIDIA's targeted R&D delivers significantly better returns than Meta's broader investments.
As these tech giants continue evolving, their revenue models will likely become even more sophisticated, blending hardware, software, services, and data-driven insights to maintain their market dominance.
Explore More Investment Opportunities
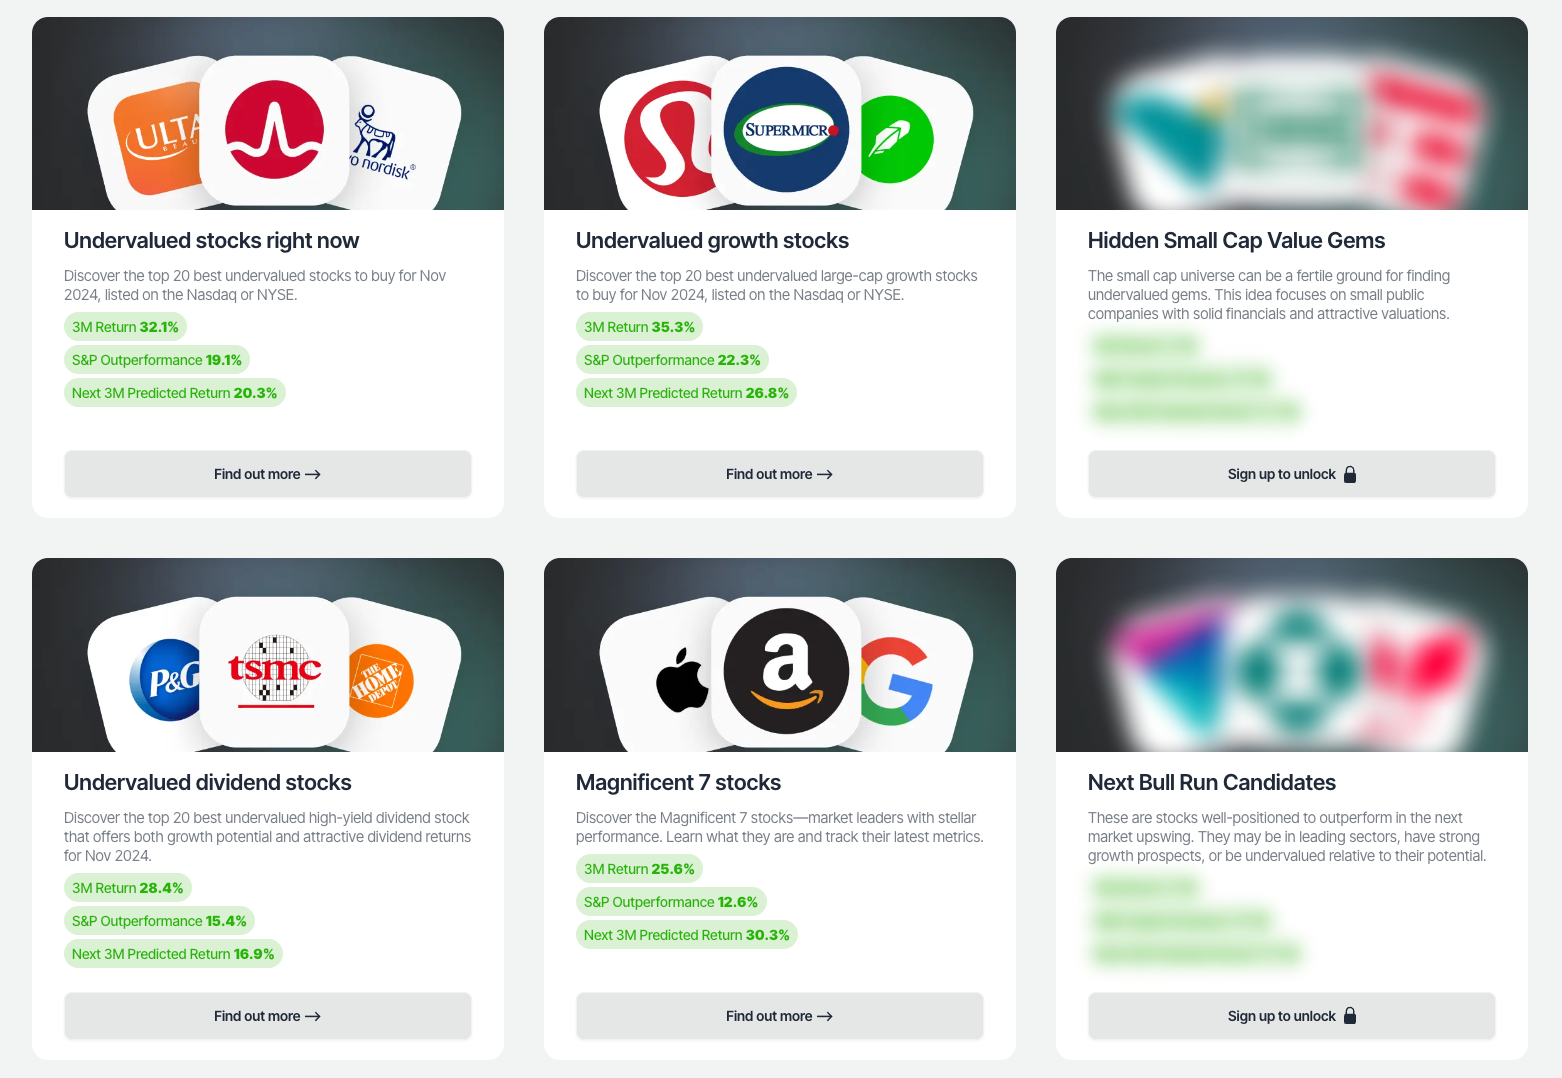
For investors seeking undervalued companies with high fundamental quality, our analytics team provides curated stock lists:
📌 50 Undervalued Stocks (Best overall value plays for 2025)
📌 50 Undervalued Dividend Stocks (For income-focused investors)
📌 50 Undervalued Growth Stocks (High-growth potential with strong fundamentals)
🔍 Check out these stocks on the Value Sense platform for free!
More Articles You Might Like
📖 The Definitive Guide to Finding Operational Metrics & KPIs for Stock Analysis
📖 Google and Intel Q4 2024 Earnings: A Tale of Two Tech Giants
📖 Cloud Wars: Google vs Amazon - A Deep Dive into Margins and Value (Q4 2024)
Q&A About Tech Giants' Money-Making Machines
1. Why is NVIDIA crushing it so hard right now?
Q: Everyone's talking about NVIDIA's insane growth. What's their secret sauce?
A: NVIDIA has pulled off the tech equivalent of selling pickaxes during a gold rush. While everybody else is fighting over who has the coolest AI chatbot, NVIDIA is quietly collecting checks from everyone building AI, period. Their data center revenue shot up 83.3% to $35.6B, making up over 90% of their total revenue. With a 68.7% profit margin (yes, you read that correctly), they're keeping more of every dollar than any other tech giant. The company pivoted hard from just being "the gaming graphics card people" to "the company powering literally all of AI," and that bet is paying off with 291.2% net income growth. Their R&D efficiency is off the charts too—they spend just 9.6% of revenue on R&D but generate 77.4% growth. Talk about ROI!
2. Which tech giant gets the least bang for their R&D buck?
Q: These companies burn through billions on R&D. Who's wasting the most cash?
A: If we're talking pure efficiency, Meta has historically been the poster child for questionable R&D spending. They've been dumping 26.7% of their revenue into R&D (that's $43.9B, more than the GDP of many countries), mostly chasing the metaverse dream through Reality Labs. The good news? Their latest numbers show they're finally getting some decent returns with 21.9% revenue growth. Reality Labs revenue is up 13.2%, but still only accounts for a tiny 1.3% of Meta's total revenue. The real money? Still coming from ads on Facebook and Instagram (98.7% of revenue). Zuck's metaverse vision might eventually pay off, but right now, the Family of Apps is carrying the entire company while Reality Labs burns cash faster than a Tesla in Ludicrous Mode.
3. Which company has the most diverse revenue streams?
Q: Which tech giant isn't keeping all its eggs in one basket?
A: Microsoft is running the most diversified business among the tech giants, with healthy revenue streams across multiple segments. Their recent numbers show $245.1B in total revenue with impressive balance: Server Products and Cloud Services at $97.7B (39.9%), Office Products at $54.9B (22.4%), Windows at $23.2B (9.5%), and Gaming at $21.5B (8.8%). Even better, all segments are growing—with gaming exploding at 39% growth thanks to the Activision Blizzard acquisition. Unlike Google (56.2% from Search) or Meta (98.7% from apps), Microsoft doesn't have a single segment that would sink the company if disrupted. Nadella's cloud-first strategy has transformed the once Windows-dependent giant into a multi-headed revenue beast with a healthy 36% profit margin on a massive revenue base.
4. Is Apple still a hardware company or has services taken over?
Q: Everyone says Apple is becoming a services company. Is that actually true?
A: Despite all the hype about Apple's pivot to services, they're still very much in the hardware game. Products make up 78.8% of their $124.3B revenue, though services are growing faster (15.9% vs. 6.8% for hardware). The services segment (App Store, Apple Music, iCloud, etc.) now accounts for 21.2% of revenue, which is nothing to sneeze at, but not exactly taking over. Apple's smart move has been using their massive hardware install base as a launchpad for high-margin subscription services. It's like selling someone a printer and then making bank on the ink cartridges forever. With a 29.2% overall profit margin, they're converting their revenue to profits better than most retailers could dream of, while spending just 6.7% of revenue on R&D. The iPhone-maker remains primarily a hardware company, just one that's gotten very good at monetizing its ecosystem.
5. Which big tech company has the worst profit margins?
Q: These tech companies are printing money, but which one keeps the least of what it makes?
A: Amazon is the clear bottom-dweller in the profit margin Olympics, keeping a relatively meager 8.9% of its revenue as net income. While their $157.8B in revenue looks impressive, most of it goes right back out the door because... running a massive retail operation is expensive! Their e-commerce business (47.9% of revenue) operates on razor-thin margins—all those warehouses, delivery trucks, and cardboard boxes don't pay for themselves. The real profit engine is AWS, their cloud service division, which makes up just 18.3% of revenue but is growing at 19.9% and carries much higher margins. In fact, for many quarters, AWS has generated more profit than the entire rest of Amazon combined. Jeff Bezos famously said, "Your margin is my opportunity," but Amazon shareholders might occasionally wish he'd kept a little more margin for himself.