
How NVDA Income Statement Overview Makes Money in 2025: A Deep-Dive With Income Statement

Welcome to the Value Sense Blog, your resource for insights on the stock market! At Value Sense, we focus on intrinsic value tools and offer stock ideas with undervalued companies. Dive into our research products and learn more about our unique approach at valuesense.io
Explore diverse stock ideas covering technology, healthcare, and commodities sectors. Our insights are crafted to help investors spot opportunities in undervalued growth stocks, enhancing potential returns. Visit us to see evaluations and in-depth market research.
Understanding how a semiconductor and AI leader like NVIDIA makes money is essential for investors and anyone interested in the business of advanced computing. In this post, we break down NVIDIA's annual income statement 2025 using a Sankey chart to visualize the financial flows — what comes in, where it goes, and what's left as profit.
Quick NVIDIA Overview
NVIDIA operates as a global leader in graphics processing units (GPUs), AI hardware, and software platforms. Revenue comes primarily from selling data center solutions, gaming GPUs, and specialized chips for professional visualization and automotive applications. The company’s business segments include Data Center, Gaming, Professional Visualization, Automotive, and Other, each targeting distinct markets within the broader technology and AI ecosystem.
Revenue Breakdown
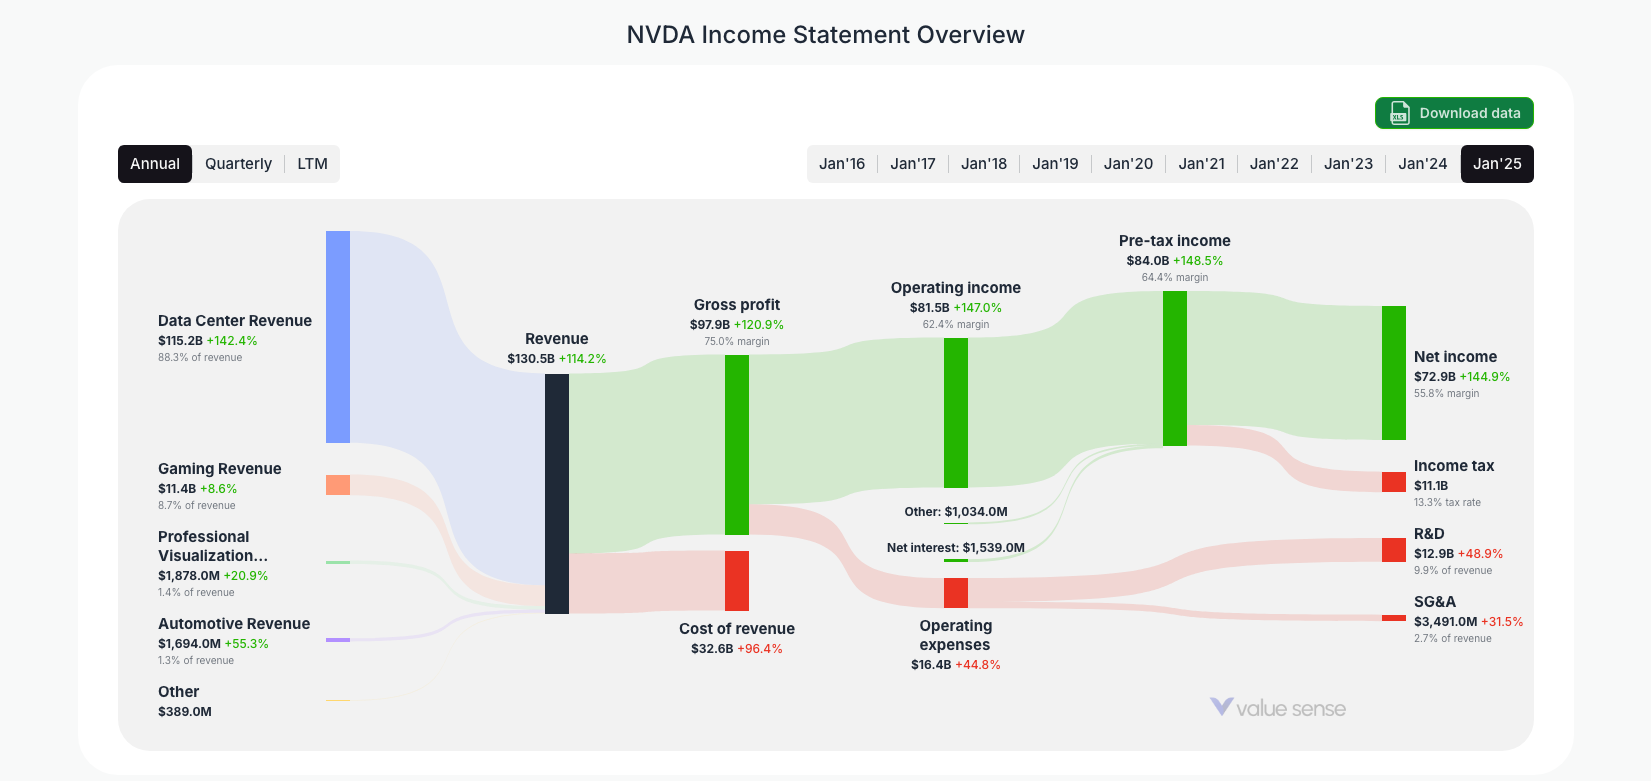
- Total Revenue 2025: $130.5B (+14.2% YoY)
- Data Center Revenue: $115.2B (88.3% of total, +142.4% YoY)
- Gaming Revenue: $11.4B (8.7% of total, +8.6% YoY)
- Professional Visualization: $1.88B (1.4% of total, +20.9% YoY)
- Automotive Revenue: $1.69B (1.3% of total, +55.3% YoY)
- Other: $389M (<1% of total)
- Growth is powered by surging demand for AI infrastructure, hyperscale data center deployments, and continued strength in gaming and automotive AI platforms.
Gross Profit and Margins
- Gross Profit: $97.9B (75.0% gross margin)
- Cost of Revenue: $32.6B (+96.4% YoY)
- NVIDIA maintains robust margins due to its scalable digital business model, premium pricing power in AI chips, and operational efficiencies in manufacturing and supply chain.
- Most costs come from hardware production, silicon procurement, and cloud infrastructure partnerships.
Operating Income and Expenses
- Operating Income: $81.5B (+147.0% YoY, 62.4% margin)
- Operating Expenses: $16.4B (+44.8% YoY)
- R&D: $12.9B (+48.9% YoY, 9.9% of revenue) — Focused on AI model development, next-gen GPU architectures, and software ecosystem expansion.
- SG&A: $3.49B (+31.5% YoY, 2.7% of revenue) — Includes sales, marketing, and administrative functions to support global growth.
- NVIDIA continues to prioritize innovation and invest in growth while maintaining efficiency in operating costs.
Net Income
- Pre-Tax Income: $84.0B (+148.5% YoY, 64.4% margin)
- Income Tax: $11.1B (13.3% effective tax rate)
- Net Income: $72.9B (+144.9% YoY, 55.8% net margin)
- NVIDIA converts a significant portion of sales into profit due to its scalable AI platform, high-margin product mix, and strong pricing power.
What Drives NVIDIA's Money Machine?
- Data Center AI Solutions: 88%+ of revenue, driven by explosive demand for AI training and inference hardware in cloud and enterprise markets.
- Hyperscale Deployments: Record shipments to leading cloud providers and enterprise customers, fueling triple-digit growth.
- R&D Investment: $12.9B invested in AI research, next-gen chips, and software platforms to sustain technology leadership.
- Future Growth Areas: Automotive AI, edge computing, and professional visualization—while still small, these segments are growing rapidly and position NVIDIA for new markets.
Visualizing NVIDIA's Financial Flows
The Sankey chart below visualizes how each dollar flows from gross revenue, through costs and expenses, down to net income. This helps investors spot where value is created, what areas weigh on profits, and how efficiently the company operates.
- Most revenue flows into gross profit, with operating expenses (especially R&D) taking the largest chunk.
- Even after heavy investments in innovation, 55.8% of revenue drops to the bottom line.
Key Takeaways
- NVIDIA's money comes overwhelmingly from data center AI solutions, reflecting its dominance in the AI hardware market.
- High gross and net margins illustrate the power of NVIDIA's scalable, high-value business model.
- Heavy investment in R&D, balanced by efficiency in operating costs, sustains technology leadership.
- Ongoing growth is driven by AI adoption, hyperscale cloud demand, and expansion into automotive and edge computing.
Explore More Investment Opportunities

For investors seeking undervalued companies with high fundamental quality, our analytics team provides curated stock lists:
📌 50 Undervalued Stocks (Best) overall value plays for 2025
📌 50 Undervalued Dividend Stocks (For income-focused investors)
📌 50 Undervalued Growth Stocks (High-growth potential with strong fundamentals)
🔍 Check out these stocks on the Value Sense platform for free!
FAQ About NVIDIA's Income Statement
1. What is the main source of NVIDIA's revenue in 2025?
NVIDIA generates over 88% of its revenue from Data Center AI solutions, serving cloud providers, enterprises, and AI developers. Additional revenue comes from gaming GPUs, professional visualization, and automotive AI platforms.
2. How profitable is NVIDIA in 2025?
NVIDIA reported net income of $72.9B in 2025, with a net margin of approximately 55.8%, reflecting strong profitability driven by high-margin AI hardware and software sales, and operational efficiency.
3. What are the largest expense categories for NVIDIA?
The biggest expenses on NVIDIA's income statement are operating expenses, particularly Research & Development (R&D) at $12.9B in 2025, as NVIDIA prioritizes AI research, chip design, and software ecosystem development. SG&A costs totaled $3.49B.
4. Why does Automotive operate at a loss?
Automotive, despite generating $1.69B in revenue, posted an operating loss in 2025. This is because NVIDIA aggressively invests in autonomous driving platforms and automotive AI, believing these will drive long-term growth—even if the division is unprofitable today.
5. How does NVIDIA's effective tax rate compare to previous years?
NVIDIA's effective tax rate in 2025 was 13.3%, consistent with previous years. This moderate rate is primarily due to international structuring and tax benefits from share-based compensation.