ValueSense Intrinsic Value Tools - Intrinsic Value Calculator
ValueSense's Intrinsic Value Calculator is a comprehensive valuation tool that combines multiple proven methodologies to help you determine whether a stock is fairly valued, undervalued, or overvalued. Using automated calculations and proprietary models, it provides professional-grade valuation analysis without requiring complex manual calculations.
Accessing the Intrinsic Value Calculator
Method 1: Via Tools Hub
- Hover over "More tools" in the main navigation bar
- Click "Intrinsic value tools" from the dropdown menu
- This takes you to the comprehensive valuation tools hub
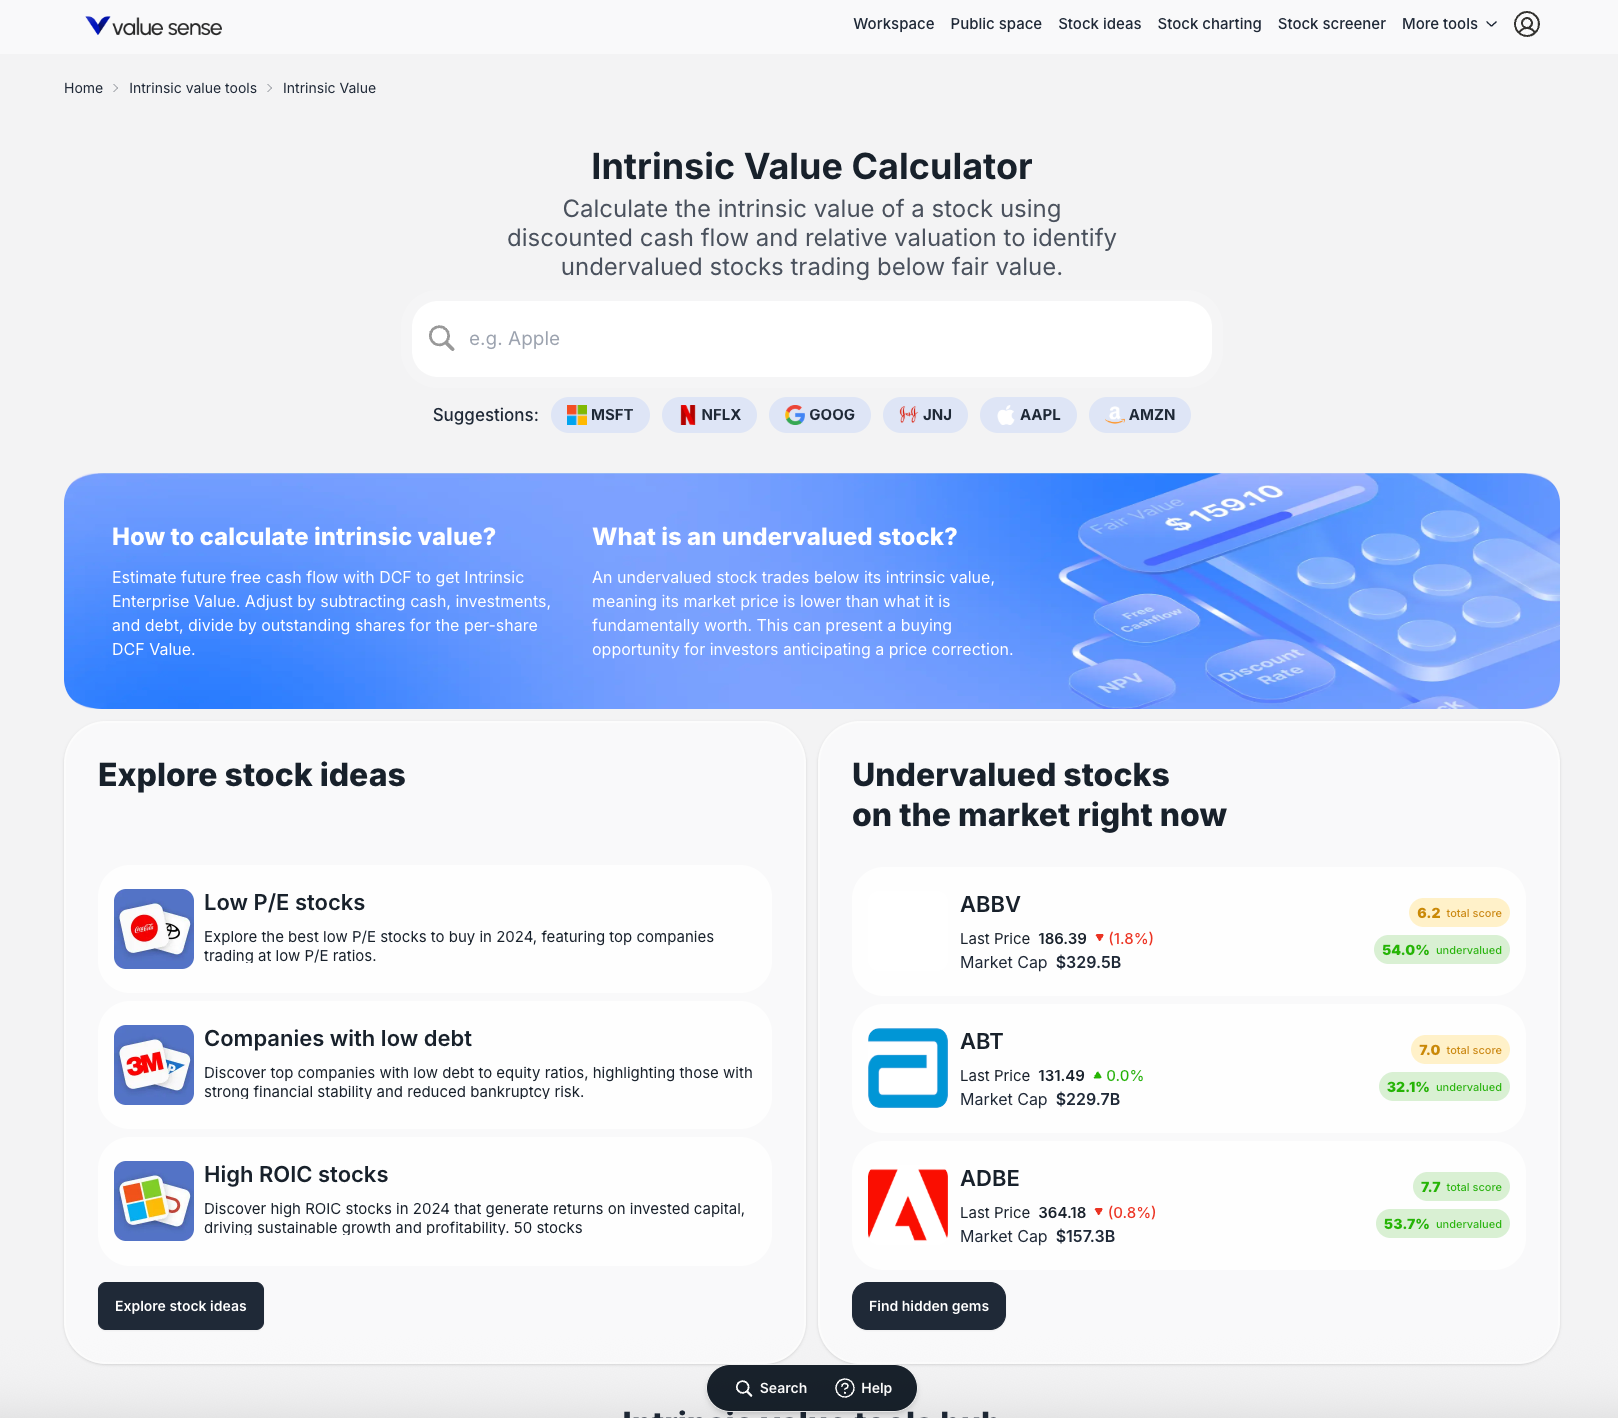
- Click "Find out more" on the "Intrinsic Value" card
- Access the main calculator page with search functionality
Method 2: Direct Stock Analysis
Free Intrinsic Value tools - Value of stocks
A free website for calculating the intrinsic value of stocks and the fair market value of a stock.

- From the calculator page, search for any company by name or ticker
- Click on suggested tickers below the search bar
- Or type directly into the search bar (e.g., "Apple" or "MSFT")
- This loads the detailed intrinsic value analysis instantly
Understanding the Results
Top-Level Summary Cards
When you analyze a stock (e.g., Microsoft - MSFT), you get immediate insights:
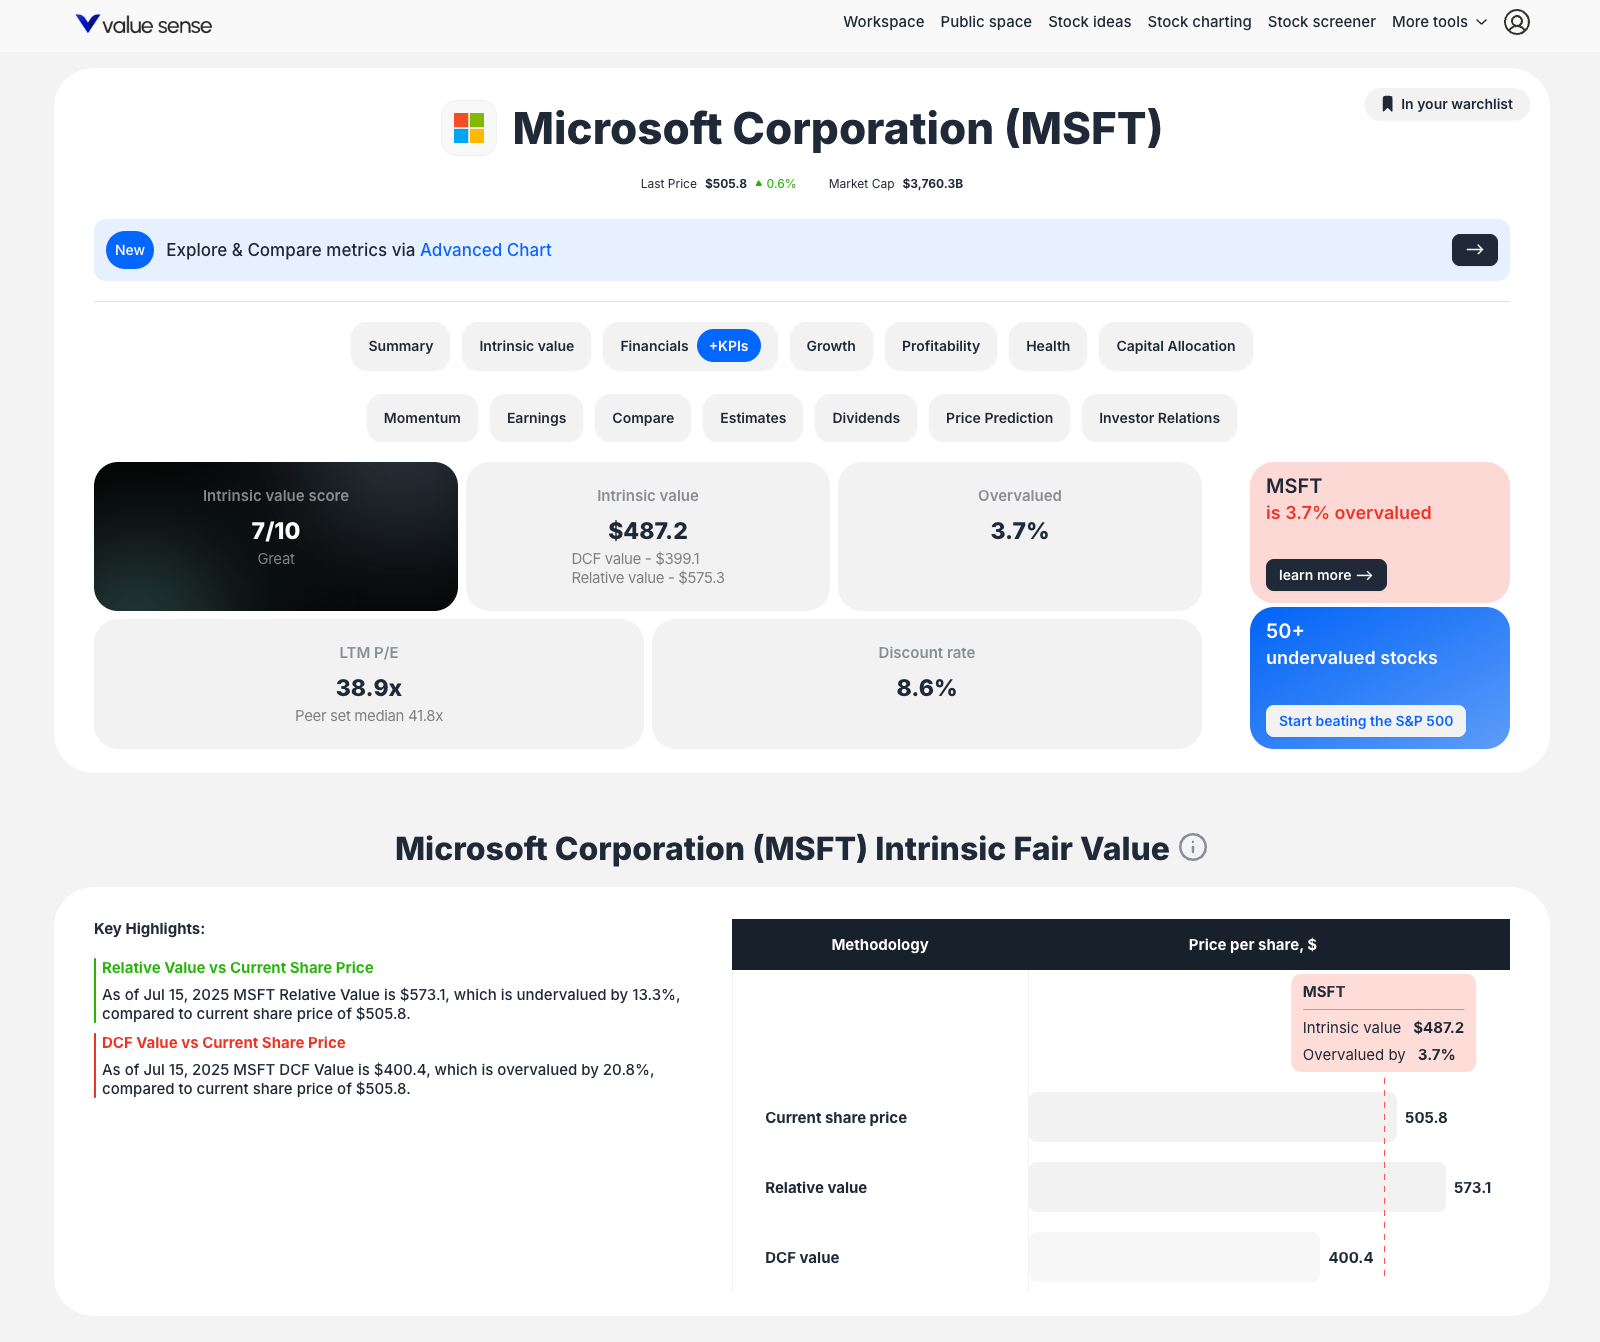
- Intrinsic Value Score: Proprietary rating (e.g., "7/10 Great")
- Intrinsic Value: Final calculated fair value per share (e.g., $487.2)
- Component Breakdown:
- DCF Value: Discounted cash flow result (e.g., $399.1)
- Relative Value: Peer comparison value (e.g., $575.1)
- Valuation Status: Clear indicator (e.g., "3.7% overvalued")
- Key Metrics: LTM P/E ratio and discount rate used
Visual Analysis Tools
Fair Value Comparison Chart
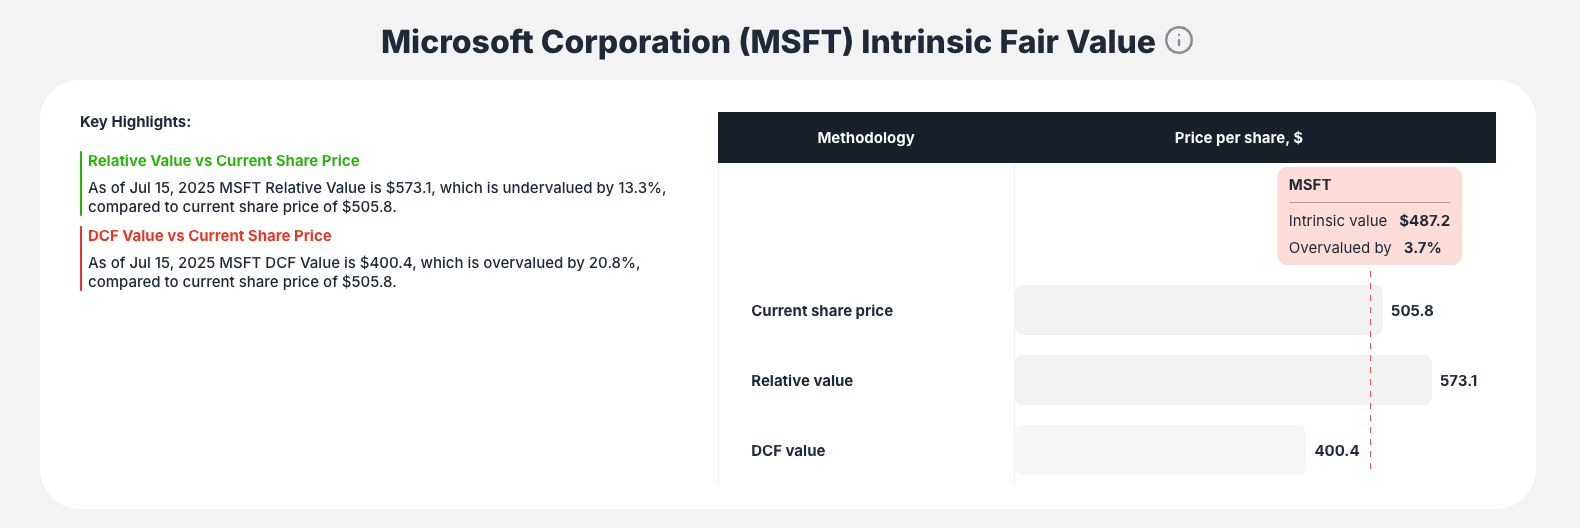
- Bar chart comparing current share price to calculated intrinsic, relative, and DCF values
- Instant visual understanding of valuation relationships
Historical Intrinsic Value Chart
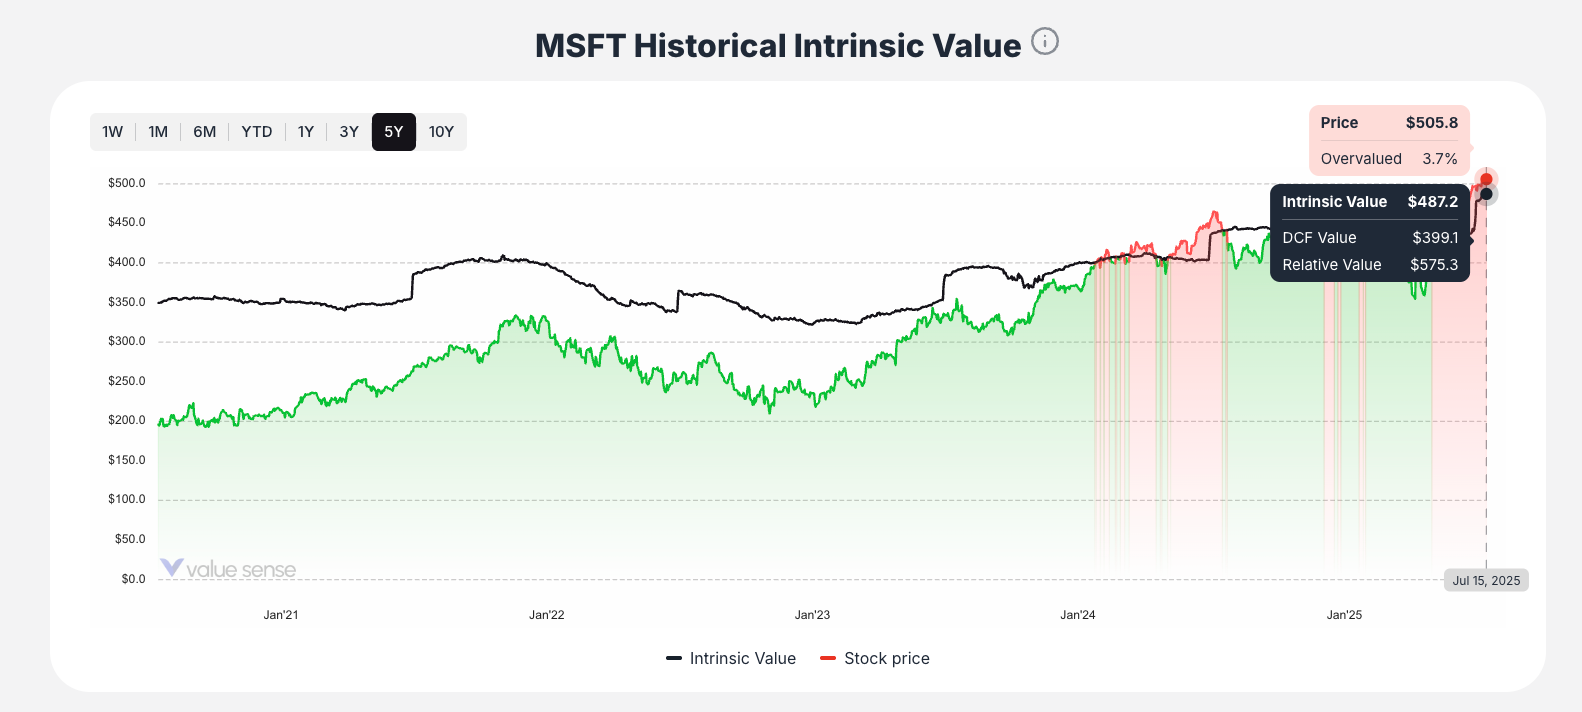
- Line chart plotting stock price against calculated intrinsic value over time
- Choose timeframes from 1 week to 5 years
- Interactive hover feature reveals detailed data for any historical point
- Identify valuation trends and timing opportunities
Peer Comparison Table
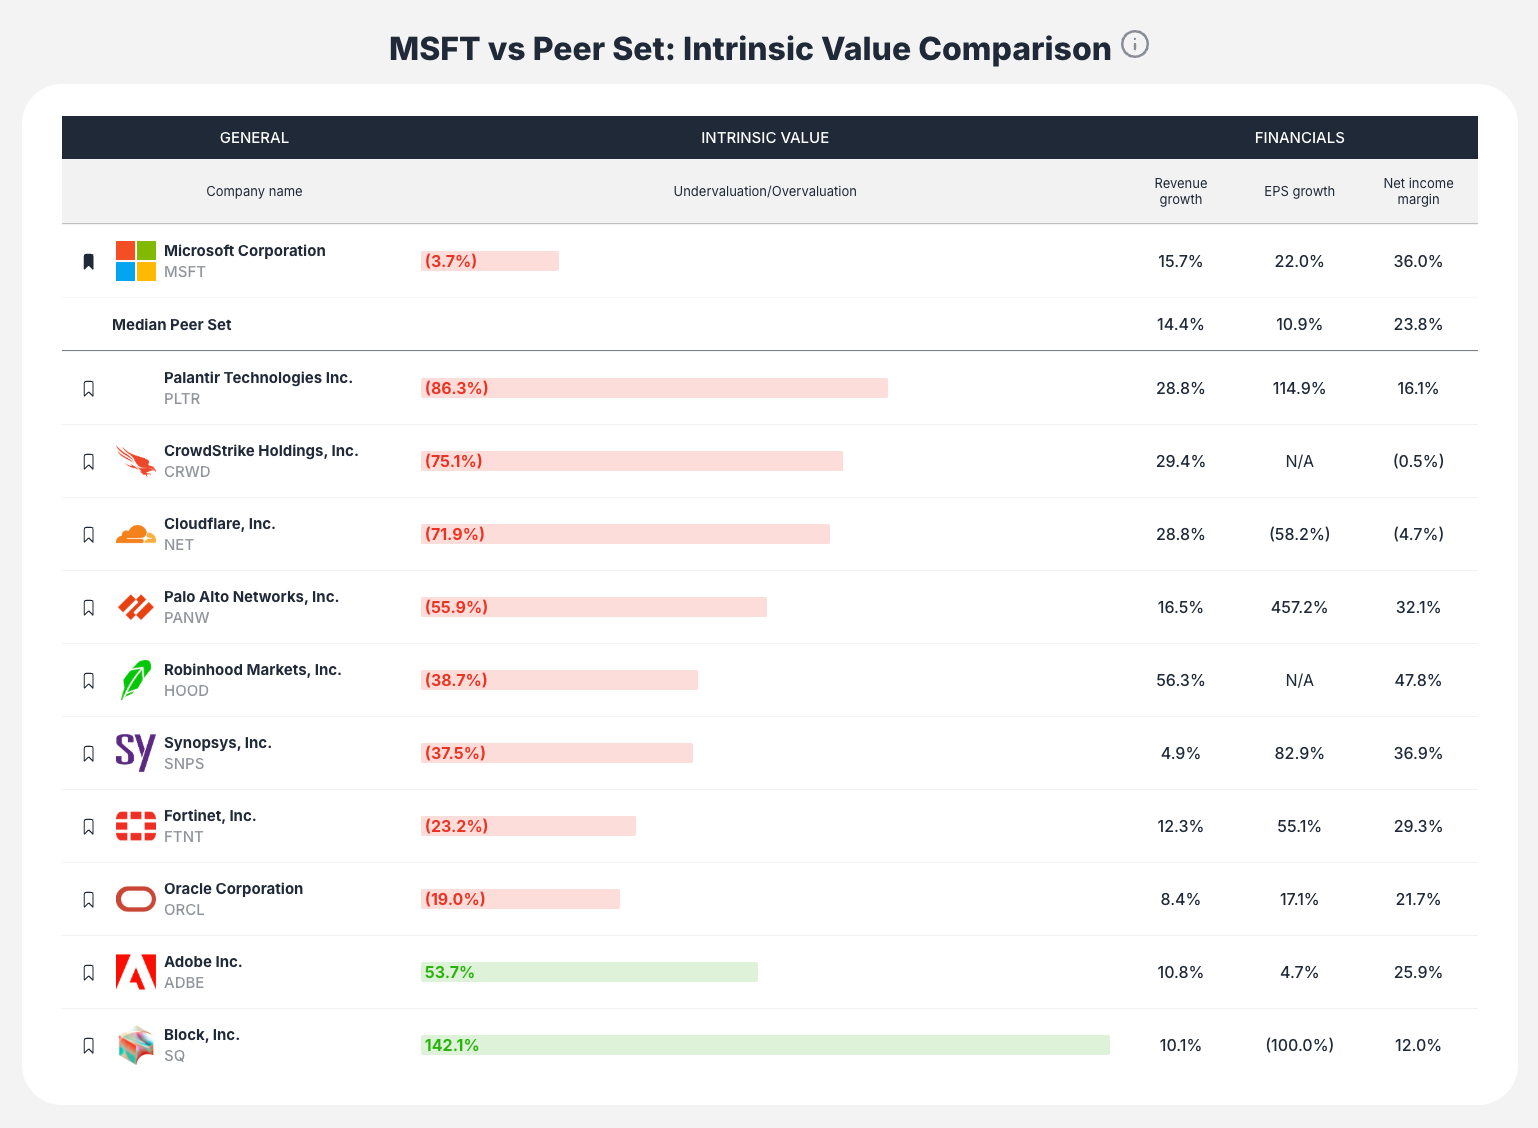
- Compare the analyzed company to industry peers
- Metrics include under/overvaluation percentages, revenue growth, EPS growth, and net income margins
- Understand if valuation is company-specific or industry-wide
Methodologies and Calculations
Blended Model Approach
The primary "Intrinsic Value" combines multiple proven methodologies:
Discounted Cash Flow (DCF)
- Estimates future free cash flows
- Discounts them at appropriate rates
- Adjusts for cash, investments, and debt
- Divides by outstanding shares for per-share value
Relative Valuation
- Determines market price relative to fundamental worth
- Based on assets, earnings, and cash flows
- Compares multiples to peers and historical averages
Automated Calculations
- No manual input required beyond selecting the stock
- Proprietary models use current financial data
- Professional-grade analysis without complex calculations
How to Interpret Results
Quick Investment Decision
- Overvaluation Percentage: If positive, stock may be expensive
- Undervaluation Percentage: If negative, stock may be a bargain
- Intrinsic Value Score: Higher scores indicate better valuation attractiveness
Advanced Analysis
- DCF vs. Relative Value Gap: Large differences indicate market sentiment vs. fundamental value disconnect
- Historical Trends: Use the chart to see if current valuation is temporary or persistent
- Peer Context: Compare to industry peers to understand relative attractiveness
Key Workflow for Using the Calculator
Step 1: Stock Selection
- Search for any company using ticker or name
- Or click on suggested popular stocks
Step 2: Summary Assessment
- Review the intrinsic value score and over/undervaluation percentage
- Get immediate investment direction
Step 3: Component Analysis
- Examine DCF and Relative value breakdown
- Understand what's driving the valuation
Step 4: Historical Context
- Use the interactive chart to see valuation trends
- Identify if current levels are typical or unusual
Step 5: Peer Comparison
- Compare to industry competitors
- Understand relative valuation attractiveness
Step 6: Additional Analysis
- Explore other valuation models for the same stock
- Use integrated links to find similar investment opportunities
Best Practices for Using the Calculator
Initial Screening
- Use the intrinsic value score as a quick quality filter
- Focus on significantly undervalued opportunities
- Consider the magnitude of under/overvaluation
Comprehensive Analysis
- Always review both DCF and Relative value components
- Check historical valuation trends for context
- Compare to peer group for industry perspective
Timing Decisions
- Use historical charts to identify valuation cycles
- Look for stocks approaching historical support levels
- Consider market conditions when interpreting results
Key Features to Remember
Automated Professional Analysis
- No complex calculations required
- Proprietary models handle all technical aspects
- Instant results for any publicly traded stock
Multiple Valuation Perspectives
- Blended approach combines best of different methodologies
- See both fundamental (DCF) and market-based (Relative) values
- Comprehensive view reduces single-model bias
Interactive Historical Analysis
- Hover over any point on historical charts for detailed data
- Understand valuation trends and cycles
- Identify optimal entry and exit points
Peer and Industry Context
- Never analyze stocks in isolation
- Compare to relevant peer groups
- Understand industry-wide valuation trends
The Intrinsic Value Calculator transforms complex financial modeling into an accessible, powerful tool that helps you make informed investment decisions based on rigorous valuation analysis.