
Ken Fisher - Fisher Asset Management, Llc Portfolio Q3'2025: Top Holdings & Recent Changes
Welcome to the Value Sense Blog, your resource for insights on the stock market! At Value Sense, we focus on intrinsic value tools and offer stock ideas with undervalued companies. Dive into our research products and learn more about our unique approach at [valuesense.io]
Explore diverse stock ideas covering technology, healthcare, and commodities sectors. Our insights are crafted to help investors spot opportunities in undervalued growth stocks, enhancing potential returns. Visit us to see evaluations and in-depth market research.
Ken Fisher - Fisher Asset Management, Llc continues to scale a globally diversified, research-driven equity strategy. His Q3’2025 portfolio shows $276.3B deployed across more than a thousand positions, with increasingly bold allocations to mega-cap technology leaders like NVIDIA, Apple, and Microsoft, while simultaneously ramping exposure to intermediate-term bond ETFs to manage interest-rate and macro risk.
Portfolio Overview: Scale, Breadth, and a Tilt to Quality Growth
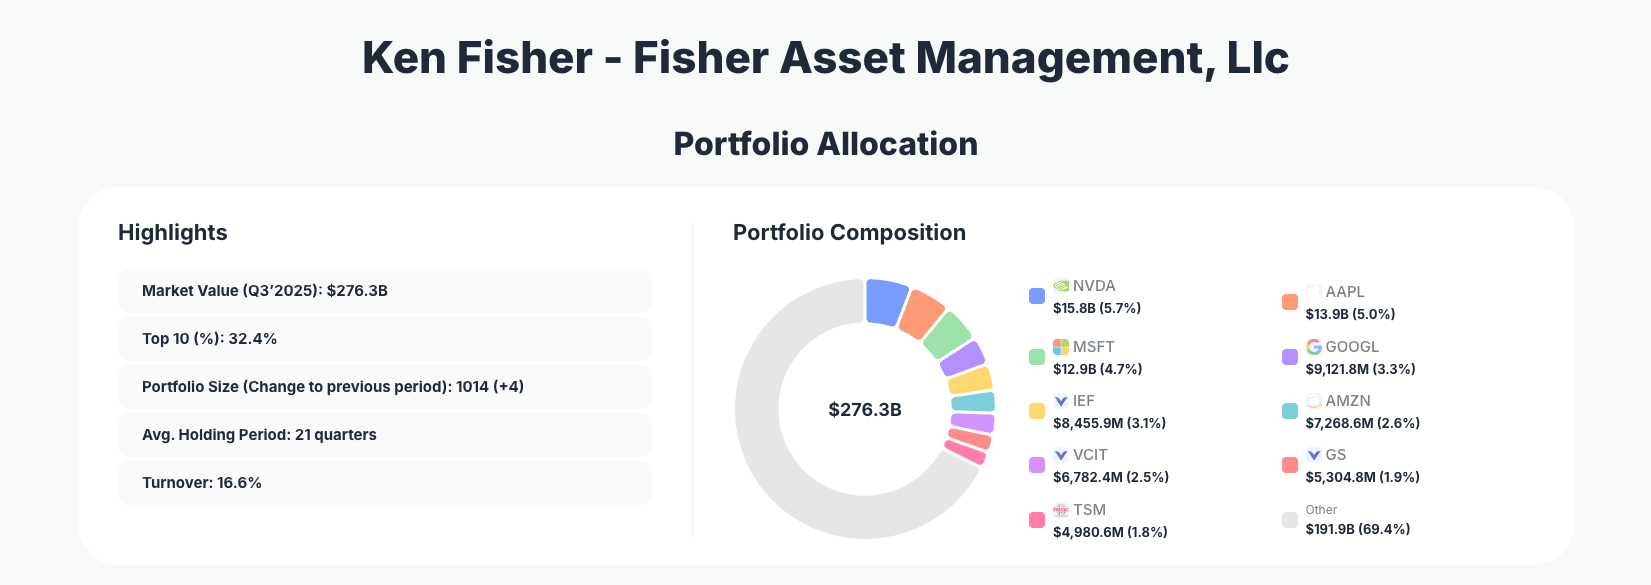
Portfolio Highlights (Q3’2025): - Market Value: $276.3B
- Top 10 Holdings: 32.4%
- Portfolio Size: 1014 +4
- Average Holding Period: 21 quarters
- Turnover: 16.6%
The latest 13F shows that Fisher Asset’s portfolio remains highly diversified by name count, yet meaningfully concentrated in its top positions. With 32.4% of capital in the top 10 and more than 1,000 positions overall, Ken Fisher blends institutional-scale diversification with clear conviction in a select group of mega-cap compounders and core ETFs.
A 21-quarter average holding period underscores a genuinely long-term orientation inside this vast book, suggesting that most positions in the Fisher Asset portfolio are not short-term trades but multi-year investments aligned with structural growth themes. At the same time, 16.6% turnover indicates Fisher is far from static—he actively fine-tunes position sizes, rotates around sector opportunities, and manages risk without abandoning his core franchises.
The Q3’2025 adjustments—especially the sizable increase in intermediate-term bond exposure and incremental adds to leading technology platforms—highlight a barbell approach in Fisher’s portfolio: growth-oriented equities on one side, and defensive, rate-sensitive bond ETFs on the other, providing ballast if equity volatility rises.
Top Holdings: Tech Powerhouses and Strategic Bond Exposure
The Q3’2025 filing shows ten key positions with notable changes, which anchor the discussion of the broader book.
The largest disclosed tech allocation is NVIDIA Corporation, with NVIDIA (NVDA) at 5.7% of the portfolio $15.8B after an Add 2.49% move. This reinforces Fisher’s conviction in AI infrastructure, GPUs, and data-center growth. Close behind, Apple (AAPL) stands at 5.0% $13.9B with an Add 1.66% in the quarter, signaling continued confidence in Apple’s ecosystem and recurring-revenue services model.
Microsoft (MSFT) represents 4.7% of the portfolio $12.9B, with an Add 2.24% increase. This keeps Microsoft firmly in Fisher’s top tier of holdings, reflecting its central role in cloud computing, enterprise software, and AI. Alphabet (GOOGL), at 3.3% $9,121.8M following an Add 2.28%, provides diversified exposure to digital advertising, YouTube, and cloud, rounding out an exceptionally strong mega-cap tech core.
On the defensive side, Fisher ramped his bond allocation aggressively. The ISHARES TR 7 10YR TR BD ETF—a U.S. Treasury 7–10 year bond vehicle—now accounts for 3.1% of the portfolio $8,455.9M after a striking Add 52.06%. Similarly, VANGUARD FDS INTTERM CORP, an intermediate-term corporate bond fund, represents 2.5% $6,782.4M and was marked as a Buy this quarter. Together, these positions indicate a deliberate push into intermediate-duration fixed income, likely to stabilize returns and hedge against equity drawdowns or rate changes.
Within consumer and e-commerce, Amazon.com (AMZN) holds 2.6% of the portfolio $7,268.6M after an Add 1.91%, maintaining Fisher’s commitment to cloud (AWS), logistics, and e-commerce dominance. In financials, The Goldman Sachs Group (GS) stands at 1.9% $5,304.8M with an Add 1.86%, underscoring confidence in global capital markets and investment banking.
Semiconductors remain a clear theme: Taiwan Semiconductor Manufacturing Company (TSM) is 1.8% of the book $4,980.6M after an Add 0.95%, complementing the NVIDIA stake with exposure to leading-edge foundry capacity. Rounding out the list of discussed changes, JPMorgan Chase (JPM) sits at 1.8% $4,959.3M but was Reduce 14.41%, suggesting some profit-taking or risk trimming in large U.S. banks, even as Fisher adds to Goldman Sachs.
Collectively, these 10–11 highlighted positions show how Fisher blends high-conviction growth in platforms like NVDA, AAPL, MSFT, GOOGL, and AMZN with sizable, risk-moderating allocations to bond ETFs and selectively managed financial exposures like GS, TSM, and JPM.
What the Portfolio Reveals About Fisher’s Current Strategy
Several themes stand out from the Q3’2025 configuration of Fisher Asset’s portfolio:
- Mega-cap tech as structural core
Incremental additions to NVDA, AAPL, MSFT, and GOOGL confirm a conviction that these platforms remain long-duration compounders, not over-owned cyclicals. Their combined weight sits at a double-digit share of total assets. - Barbell of growth equities and intermediate bonds
The massive Add 52.06% to the ISHARES 7–10 Year Treasury ETF and the Buy of VANGUARD intermediate corporates show Fisher is deliberately bolstering fixed-income ballast alongside growth stocks, likely to smooth volatility and benefit if yields normalize. - Selective financials exposure
While increasing GS, Fisher trimmed JPM by Reduce 14.41%, suggesting a nuanced view within financials—favoring certain investment-banking and trading franchises while managing idiosyncratic bank risk. - Global, but U.S.-centric quality tilt
Positions like TSM confirm global reach, yet the portfolio remains anchored in U.S.-listed mega caps and U.S. fixed-income ETFs, aligning with Fisher’s long-standing emphasis on large, liquid, and well-followed businesses.
Portfolio Concentration Analysis
| Position | Value | % of Portfolio | Recent Change |
|---|---|---|---|
| NVIDIA Corporation | $15.8B | 5.7% | Add 2.49% |
| Apple Inc. | $13.9B | 5.0% | Add 1.66% |
| Microsoft Corporation | $12.9B | 4.7% | Add 2.24% |
| Alphabet Inc. | $9,121.8M | 3.3% | Add 2.28% |
| ISHARES TR 7 10YR TR BD ETF | $8,455.9M | 3.1% | Add 52.06% |
| Amazon.com, Inc. | $7,268.6M | 2.6% | Add 1.91% |
| VANGUARD FDS INTTERM CORP | $6,782.4M | 2.5% | Buy |
| The Goldman Sachs Group, Inc. | $5,304.8M | 1.9% | Add 1.86% |
| Taiwan Semiconductor Manufacturing Company Limited | $4,980.6M | 1.8% | Add 0.95% |
These nine disclosed top positions (within the top-10 list provided) together account for a substantial portion of the 32.4% top-10 concentration figure. The first three names—NVDA, AAPL, and MSFT—alone represent more than 15% of the total portfolio value, giving outsized influence to the performance of U.S. mega-cap tech.
The presence of two large bond ETFs among the top holdings is notable; together, the ISHARES 7–10 Year Treasury ETF and VANGUARD intermediate corporates comprise 5.6% of the portfolio. This level of fixed-income concentration inside an equity-dominated 13F filing underscores Fisher’s willingness to deploy size when he sees asymmetric risk–reward in non-equity assets, not just in stocks.
Investment Lessons from Ken Fisher’s Approach
Retail investors studying Ken Fisher’s portfolio can extract several practical principles:
- Scale conviction in proven compounders
Fisher is not afraid to allocate 5%+ of a massive portfolio to a single name like NVIDIA or Apple when the business quality, balance sheet, and growth runway justify it. - Hold for the long term, adjust at the margin
A 21-quarter average holding period shows that most capital is committed for years, but modest “Add” or “Reduce” moves fine-tune risk and valuation without constant turnover. - Use diversification intelligently, not blindly
Over 1,000 positions provide breadth, yet 32.4% in the top 10 means performance is driven by a focused subset of high-confidence ideas and core ETFs. - Bonds can be a proactive tool, not an afterthought
Large, deliberate allocations to intermediate-term Treasury and corporate bond ETFs demonstrate how fixed income can be used tactically to manage macro uncertainty and volatility. - Position sizing is a risk-control lever
The decision to Reduce 14.41% in JPM while adding to GS highlights how relative sizing can express nuanced sector views rather than simple “in or out” decisions.
Looking Ahead: What Comes Next for Fisher Asset?
Based on the current positioning of Fisher Asset’s Q3’2025 portfolio, several forward-looking implications emerge:
- If AI, cloud, and digital platforms continue to compound, the oversized stakes in NVDA, AAPL, MSFT, GOOGL, AMZN, and TSM position the fund well to capture upside from ongoing digital transformation.
- The expanded allocations to intermediate-term Treasuries and corporates provide a cushion if equity markets enter a choppier or rate-sensitive regime, giving Fisher optionality to redeploy into equities on weakness.
- Trimmed exposure to JPM alongside increased GS suggests continued selectivity within financials; future quarters may reveal whether this becomes a broader rotation across banks, insurers, or asset managers.
- With 16.6% turnover, investors should expect ongoing incremental shifts by sector and region rather than wholesale strategy changes; the core philosophy of diversified, quality-tilted growth appears firmly intact.
If you want to monitor how these themes evolve in upcoming quarters, you can follow all updates on Ken Fisher’s Fisher Asset portfolio on ValueSense.
FAQ about Ken Fisher’s Fisher Asset Portfolio
Q: What were the biggest changes in Ken Fisher’s Q3’2025 portfolio?
The most striking change was the Add 52.06% to the ISHARES TR 7–10 Year Treasury Bond ETF, significantly boosting intermediate-duration bond exposure. Fisher also made incremental adds to mega-cap tech names like NVIDIA, Apple, Microsoft, and Alphabet, while reducing JPMorgan by Reduce 14.41%.
Q: How concentrated is Fisher Asset’s portfolio?
While the portfolio includes 1014 positions (+4 from last quarter), the top 10 holdings account for 32.4% of total market value. This means Fisher combines broad diversification with meaningful conviction in a relatively small group of large positions and ETFs.
Q: How active is Ken Fisher in managing this portfolio?
The reported turnover of 16.6% suggests moderate activity—enough to rebalance and express evolving macro and company-specific views, but low enough to be consistent with the 21-quarter average holding period. In practice, this means upgrades, trims, and tactical bond moves rather than constant trading.
Q: Which sectors and themes does Fisher seem to favor right now?
Q3’2025 data shows strong emphasis on mega-cap technology and digital platforms (NVDA, AAPL, MSFT, GOOGL, AMZN, TSM), complemented by financials (GS, JPM) and substantial intermediate-term bond ETF exposure for risk management.
Q: How can I track Ken Fisher’s holdings and 13F filing updates?
Ken Fisher’s U.S. long equity positions are disclosed quarterly via 13F filings, which are typically published up to 45 days after each quarter ends. You can track changes, visualize allocations, and review historical moves using ValueSense’s superinvestor tracker on the Fisher Asset portfolio page, keeping in mind that the 13F data always reflects positions with a reporting lag.
Explore More Investment Opportunities
For investors seeking undervalued companies with high fundamental quality, our analytics team provides curated stock lists:
📌 50 Undervalued Stocks (Best overall value plays for 2025)
📌 50 Undervalued Dividend Stocks (For income-focused investors)
📌 50 Undervalued Growth Stocks (High-growth potential with strong fundamentals)
🔍 Check out these stocks on the Value Sense platform for free!