
The Definitive Guide to Finding Operational Metrics & KPIs for Stock Analysis
Welcome to Value Sense Blog
At Value Sense, we provide insights on the stock market, intrinsic value tools, and stock ideas with undervalued companies. You can explore our research products at valuesense.io and learn more about our approach on our site.
Value Sense: The Evolution of Investment Intelligence
The architecture of sophisticated investment analysis has traditionally been bifurcated between institutional capabilities and retail limitations. This asymmetry has now been fundamentally recalibrated with Value Sense's release of comprehensive operational metrics and KPIs.
Why Operational KPIs Transform Investment Analysis
Traditional financial statements deliberately aggregate performance metrics, potentially obscuring the nuanced operational dynamics that drive business momentum. Consider the analytical limitations:
Conventional Metrics Limitations:
- Revenue figures without product-level segmentation
- Geographic performance consolidated into regional categories
- Margin evolution presented without business unit context
- Operational efficiency metrics aggregated across diverse segments
Analytical Evolution: Value Sense's KPI dataset illuminates these architectural underpinnings, revealing the subtle interplay between business components that explain valuation premiums and discounts beyond simplified P/E ratios.
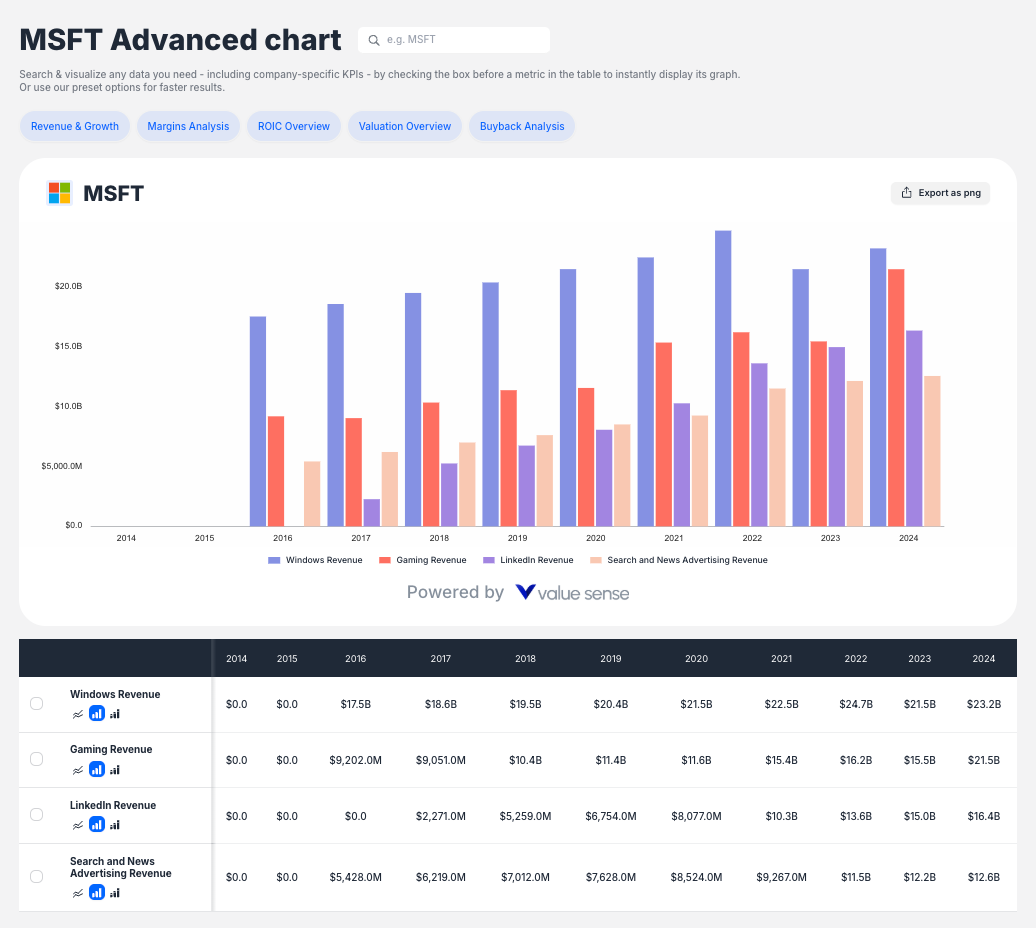
The Definitive Method: Value Sense's Advanced Chart System
The most effective pathway to operational KPI discovery leverages Value Sense's recently released Advanced Chart system—a sophisticated visualization framework that transforms raw metrics into actionable intelligence.
Implementation Methodology:
- Dataset Selection Framework
- Navigate to the Value Sense platform
- Access the KPI Data section under Stock Metrics
- Select target company for operational analysis
- Multi-Dimensional Metric Exploration
- Product-level revenue segmentation patterns
- Geographic distribution trajectories
- Business unit margin evolution
- Segment profitability progression
- Advanced Chart Visualization
- Select specific operational metrics from the dataset
- Apply visualization frameworks (bar, line, comparative)
- Layer multiple metrics to identify correlation patterns
- Toggle between quarterly, annual, and trailing views
Critical Implementation Insight: The Advanced Chart functionality transforms complex numerical datasets into intuitive visual narratives, enabling pattern recognition that transcends tabular analysis.
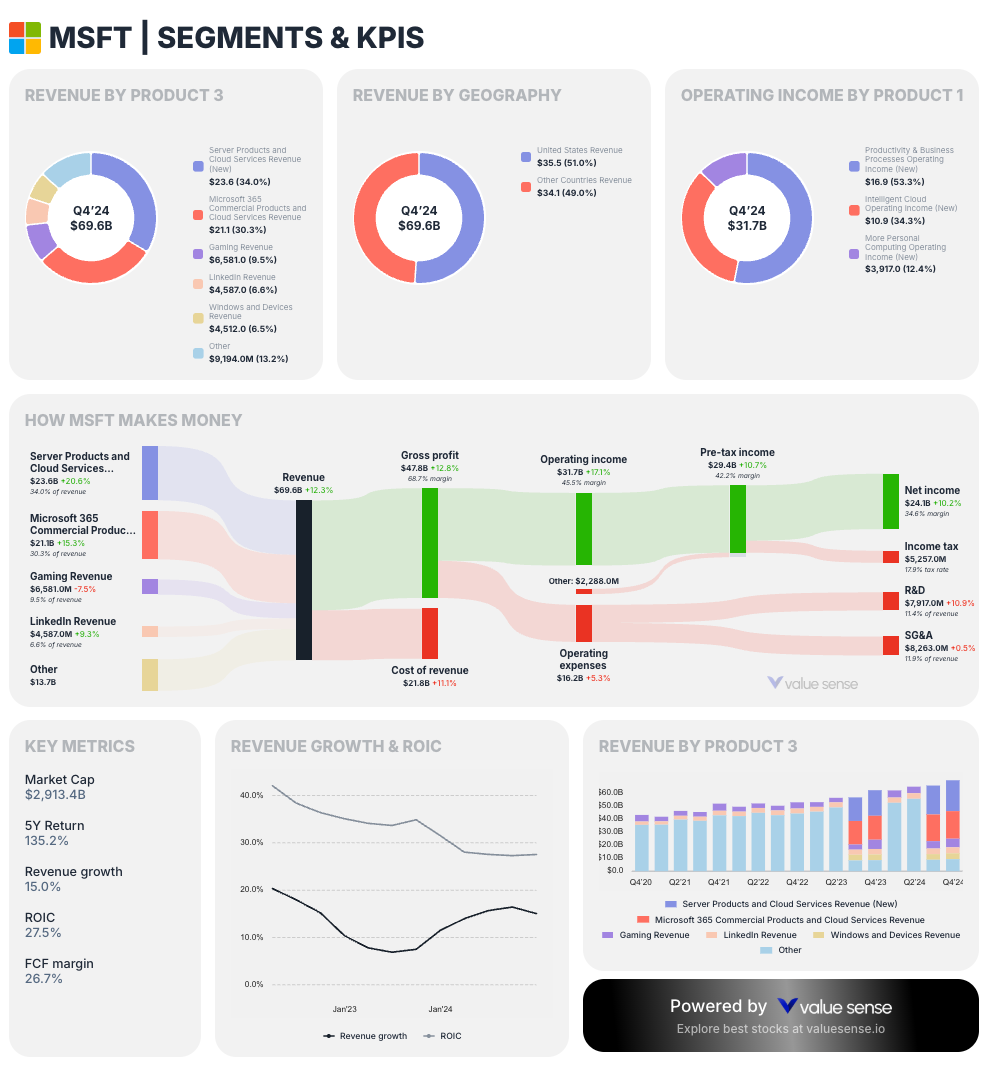
Case Study: Microsoft Operational Analysis
Applying this methodology to Microsoft reveals nuanced operational patterns previously obscured:
Cloud Services Evolution:
- Azure revenue trajectory: 413% growth (2016-2024)
- Geographic penetration metrics revealing adoption acceleration
- Margin evolution indicating scale economics emergence
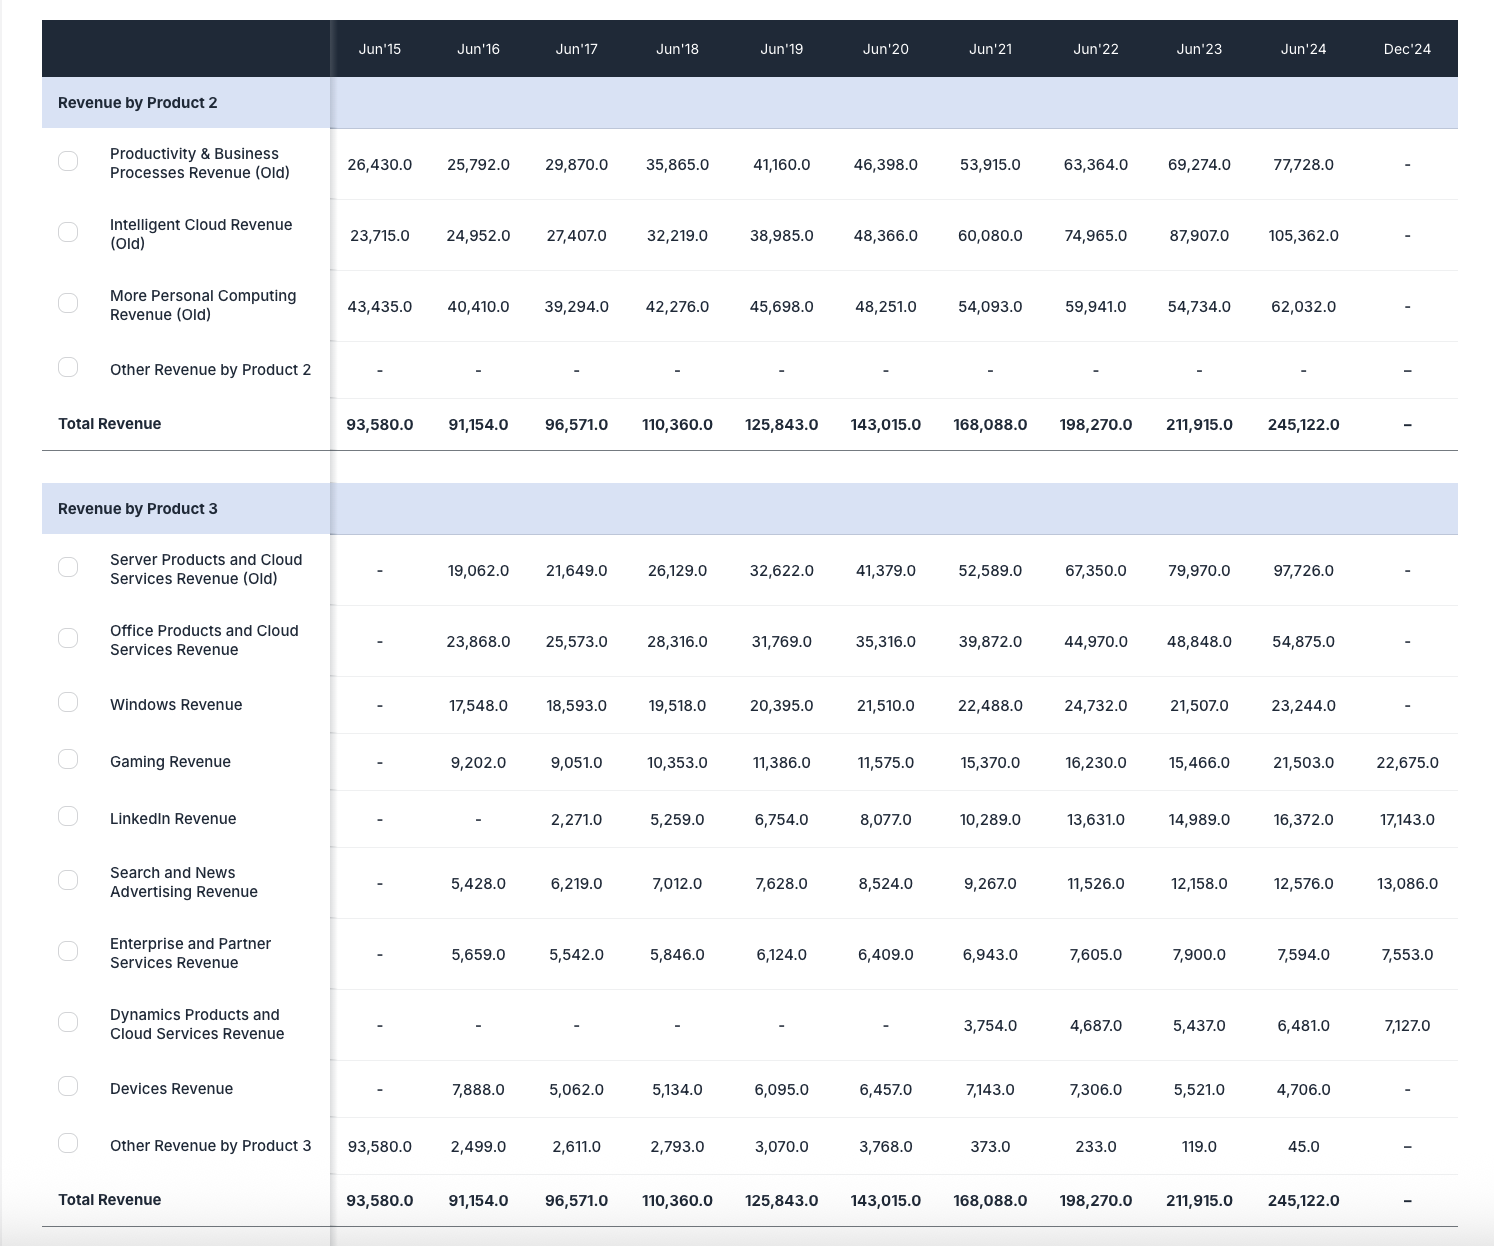
Product Segment Analysis:
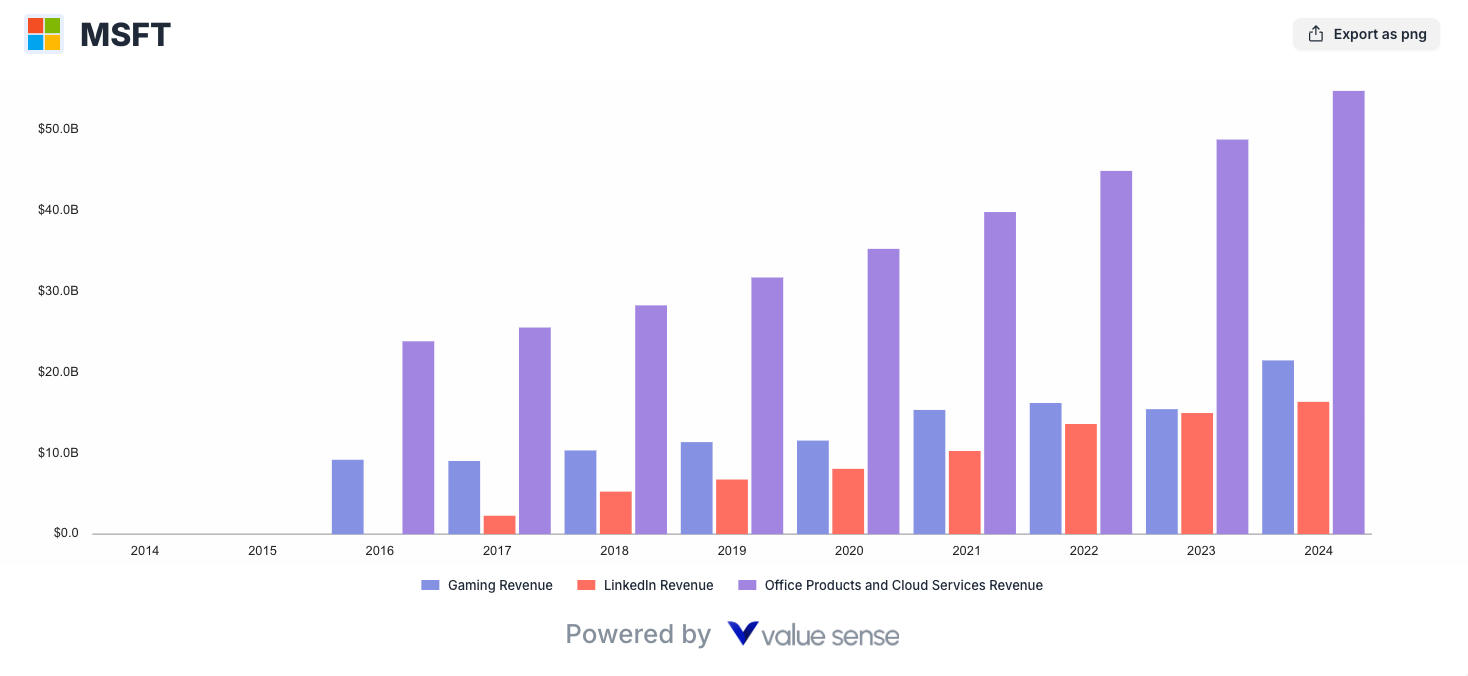
- LinkedIn revenue expansion: 614% growth (2017-2024)
- Gaming segment fluctuations revealing strategic pivots
- Office Products reflecting transition to subscription models
Competitive Positioning:
- Server Products and Cloud Services growth differential against category peers
- Operating income by segment revealing profitability engines
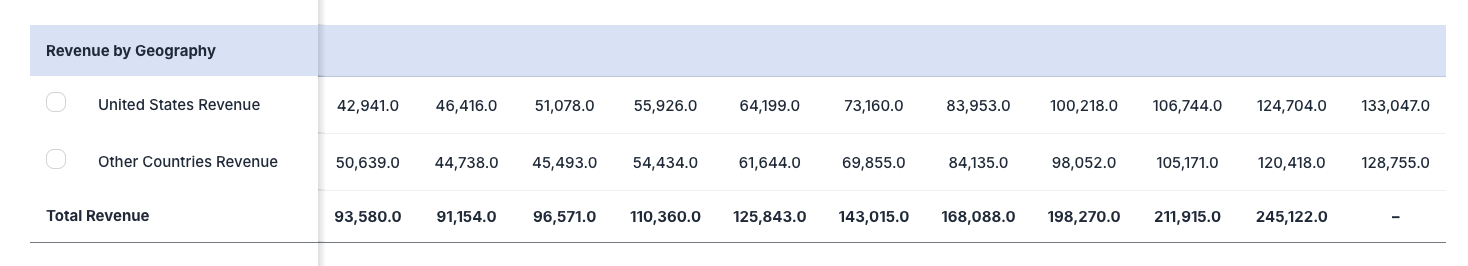
- Geographic revenue distribution illustrating market penetration dynamics
Analytical Revelation: These operational metrics provide crucial context for Microsoft's valuation evolution, explaining premium multiples through operational momentum rather than simplified growth narratives.
Beyond Value Sense: Secondary KPI Sources
While Value Sense provides the most comprehensive operational dataset, supplementary sources include:
SEC Filings Examination
- 10-K and 10-Q segment reporting sections
- Management Discussion & Analysis (MD&A) sections
- Year-over-year comparative analysis
Earnings Call Transcript Analysis
- Management commentary on operational metrics
- Analyst questions revealing critical KPIs
- Forward guidance containing operational benchmarks
Investor Relations Materials
- Quarterly presentation decks
- Investor day transcripts and materials
- Supplementary financial information
Integration Framework: Synthesize these secondary sources with Value Sense's primary dataset to construct comprehensive operational perspectives.
The Value Sense Advanced Chart and KPI dataset introduce a fundamentally new analytical architecture for investment research. This evolution from simplified metrics to operational intelligence represents not merely incremental improvement but a potential structural shift in investment analysis sophistication.
The platform makes these institutional-grade insights available without corresponding costs, with the Advanced Chart functionality transforming complex numerical datasets into intuitive visual narratives.
This intelligence democratization may ultimately enhance market efficiency through more sophisticated price discovery mechanisms, as investment theses increasingly incorporate the operational nuances that drive sustainable business performance.
Explore More Investment Opportunities
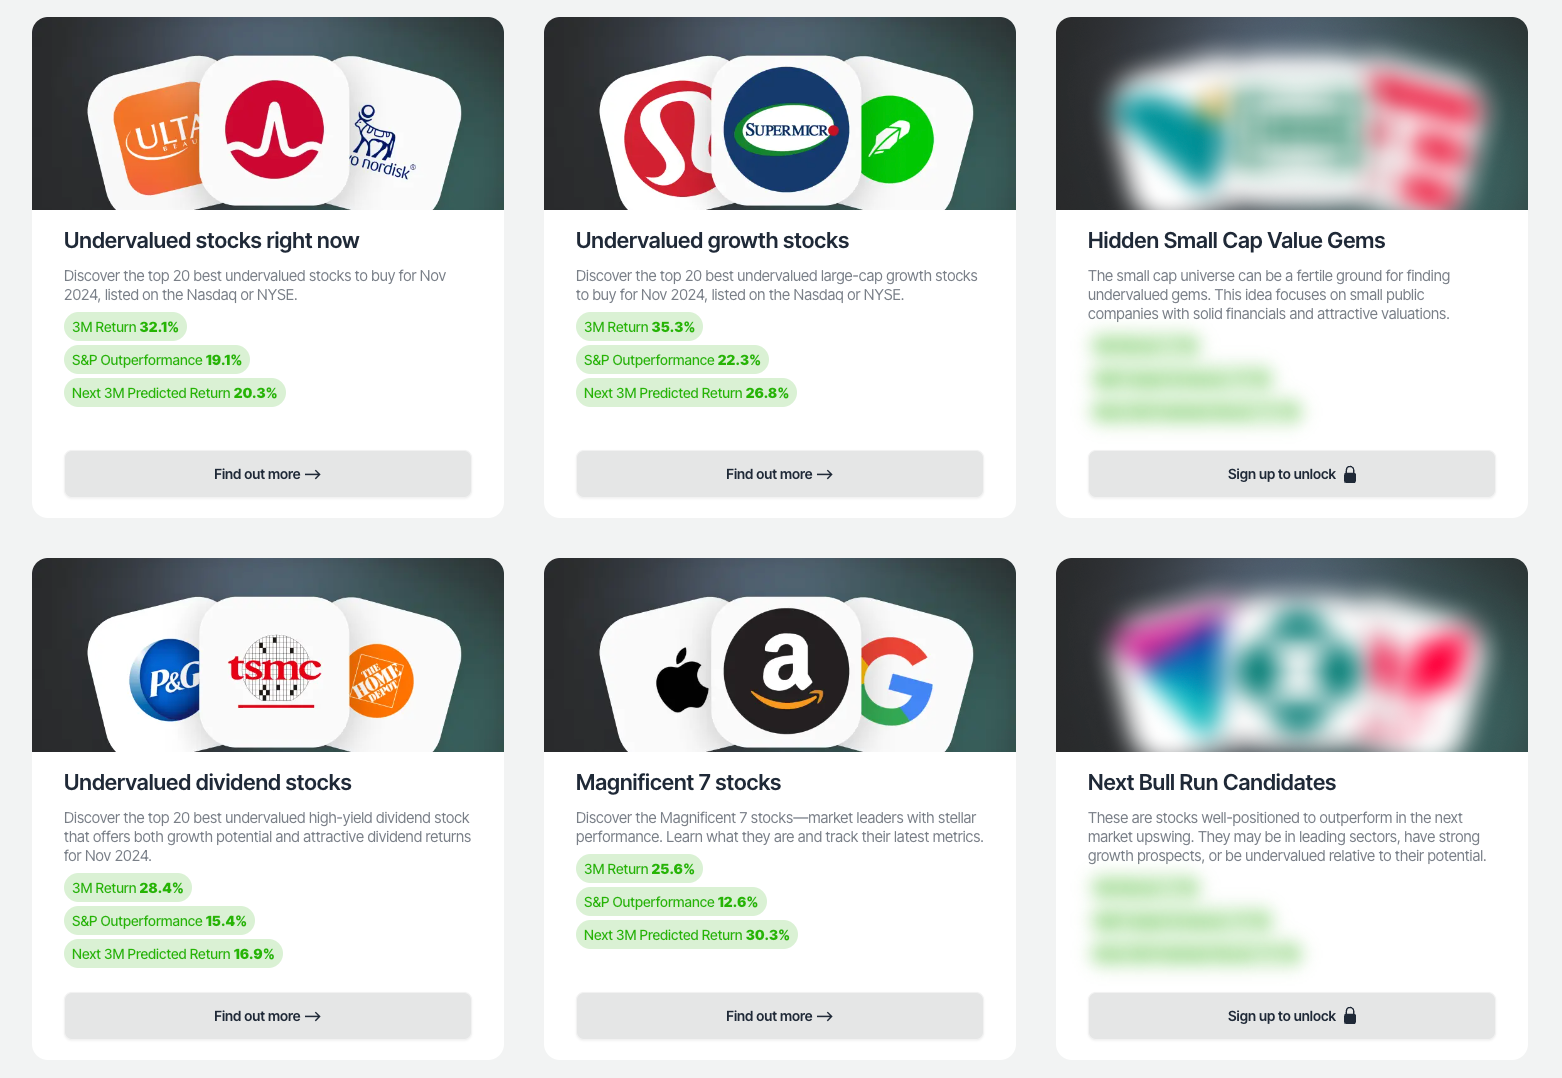
For investors seeking undervalued companies with high fundamental quality, our analytics team provides curated stock lists:
📌 50 Undervalued Stocks (Best overall value plays for 2025)
📌 50 Undervalued Dividend Stocks (For income-focused investors)
📌 50 Undervalued Growth Stocks (High-growth potential with strong fundamentals)
🔍 Check out these stocks on the Value Sense platform for free!
More Articles You Might Like
📖 Rule of 40 Analysis: High-Performance Tech Stocks
📖 S&P 500 Fair Value Heatmap
📖 9 Undervalued Low Debt Stocks to Buy - 2025
FAQ: Operational Metrics & KPIs for Investment Analysis
Q: What distinguishes operational KPIs from standard financial metrics?
Operational KPIs illuminate the architectural components of business performance rather than aggregated outcomes. While traditional metrics (revenue, earnings, margins) provide surface-level understanding, operational KPIs reveal the underlying mechanisms driving these results—product-level performance, geographic distribution patterns, segment-specific profitability dynamics. This granularity transforms analytical frameworks from simplified growth narratives to nuanced operational evaluations.
Q: How does Value Sense's KPI dataset transform investment analysis capabilities?
Value Sense's platform represents a fundamental recalibration in analytical capability distribution. The dataset provides institutional-grade operational metrics—previously guarded behind prohibitive paywalls—without corresponding costs. This intelligence democratization enables multi-dimensional analysis frameworks incorporating product segmentation, geographic distribution, and segment profitability previously accessible only to sophisticated institutional investors, potentially enhancing market efficiency through broader analytical capability distribution.
Q: What specific implementation steps maximize Advanced Chart utility for operational KPI analysis?
Optimal implementation follows structured methodology: select foundational metrics from the KPI dataset, configure appropriate timeframes (quarterly/annual/trailing), apply comparative overlays to identify correlation patterns, and optimize visualization formats based on analytical objectives. This transforms the Advanced Chart from visualization tool to analytical engine, enabling pattern recognition across operational dimensions that frequently precede shifts in consolidated financial metrics.
Q: How might operational KPIs have identified significant investment opportunities historically?
Historical analysis demonstrates predictive capacity: Microsoft's Azure revenue trajectory (413% growth 2016-2024) provided early signals of business model evolution before consolidated metrics reflected the transformation. Similarly, LinkedIn's 614% expansion (2017-2024) revealed a growth vector obscured in consolidated reporting. These patterns illustrate how operational metrics can identify inflection points before they manifest in traditional financial statements.
Q: What analytical frameworks maximize value extraction from operational KPIs?
Sophisticated frameworks incorporate longitudinal analysis tracking metrics across multiple reporting periods, cross-metric correlation examination between operational KPIs and financial outcomes, competitive benchmarking against sector peers, and narrative validation testing management guidance against operational progression patterns. The Advanced Chart facilitates these approaches through visualization tools that transform complex numerical relationships into recognizable patterns.
Q: How might the democratization of operational metrics influence market valuation mechanisms?
The structural implications extend beyond individual investment capabilities, potentially enhancing price discovery through reduced information asymmetry. As market participants increasingly incorporate operational nuances into investment theses, valuation frameworks may evolve toward more explicit integration of these metrics. This represents a potential structural shift in market information distribution rather than merely expanded data accessibility, potentially recalibrating institutional advantages through broader analytical capability distribution.