ValueSense features - KPI & Segments Data for stocks
The KPI & Segments Data feature provides comprehensive access to detailed operational metrics and business segment performance data. This feature enables deep analysis of company performance beyond traditional financial statements, offering granular insights into revenue streams, operational efficiency, and strategic business units.
Accessing KPI & Segments Data
Navigation Path:
Search Company: Navigate to specific company's main page (e.g., Microsoft)
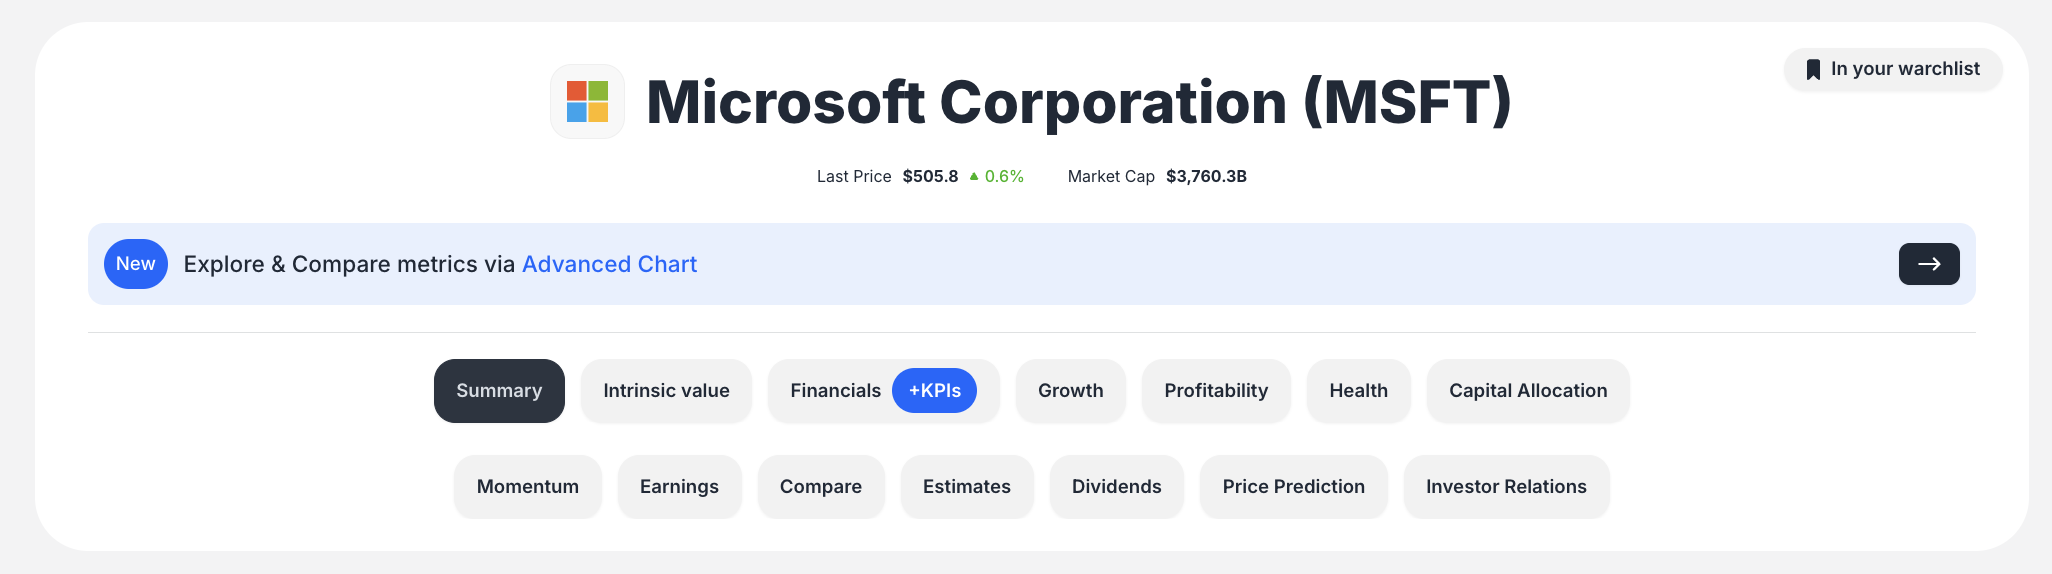
Select Financial Tab: Click the "Financials / KPIs" tab located under the company name
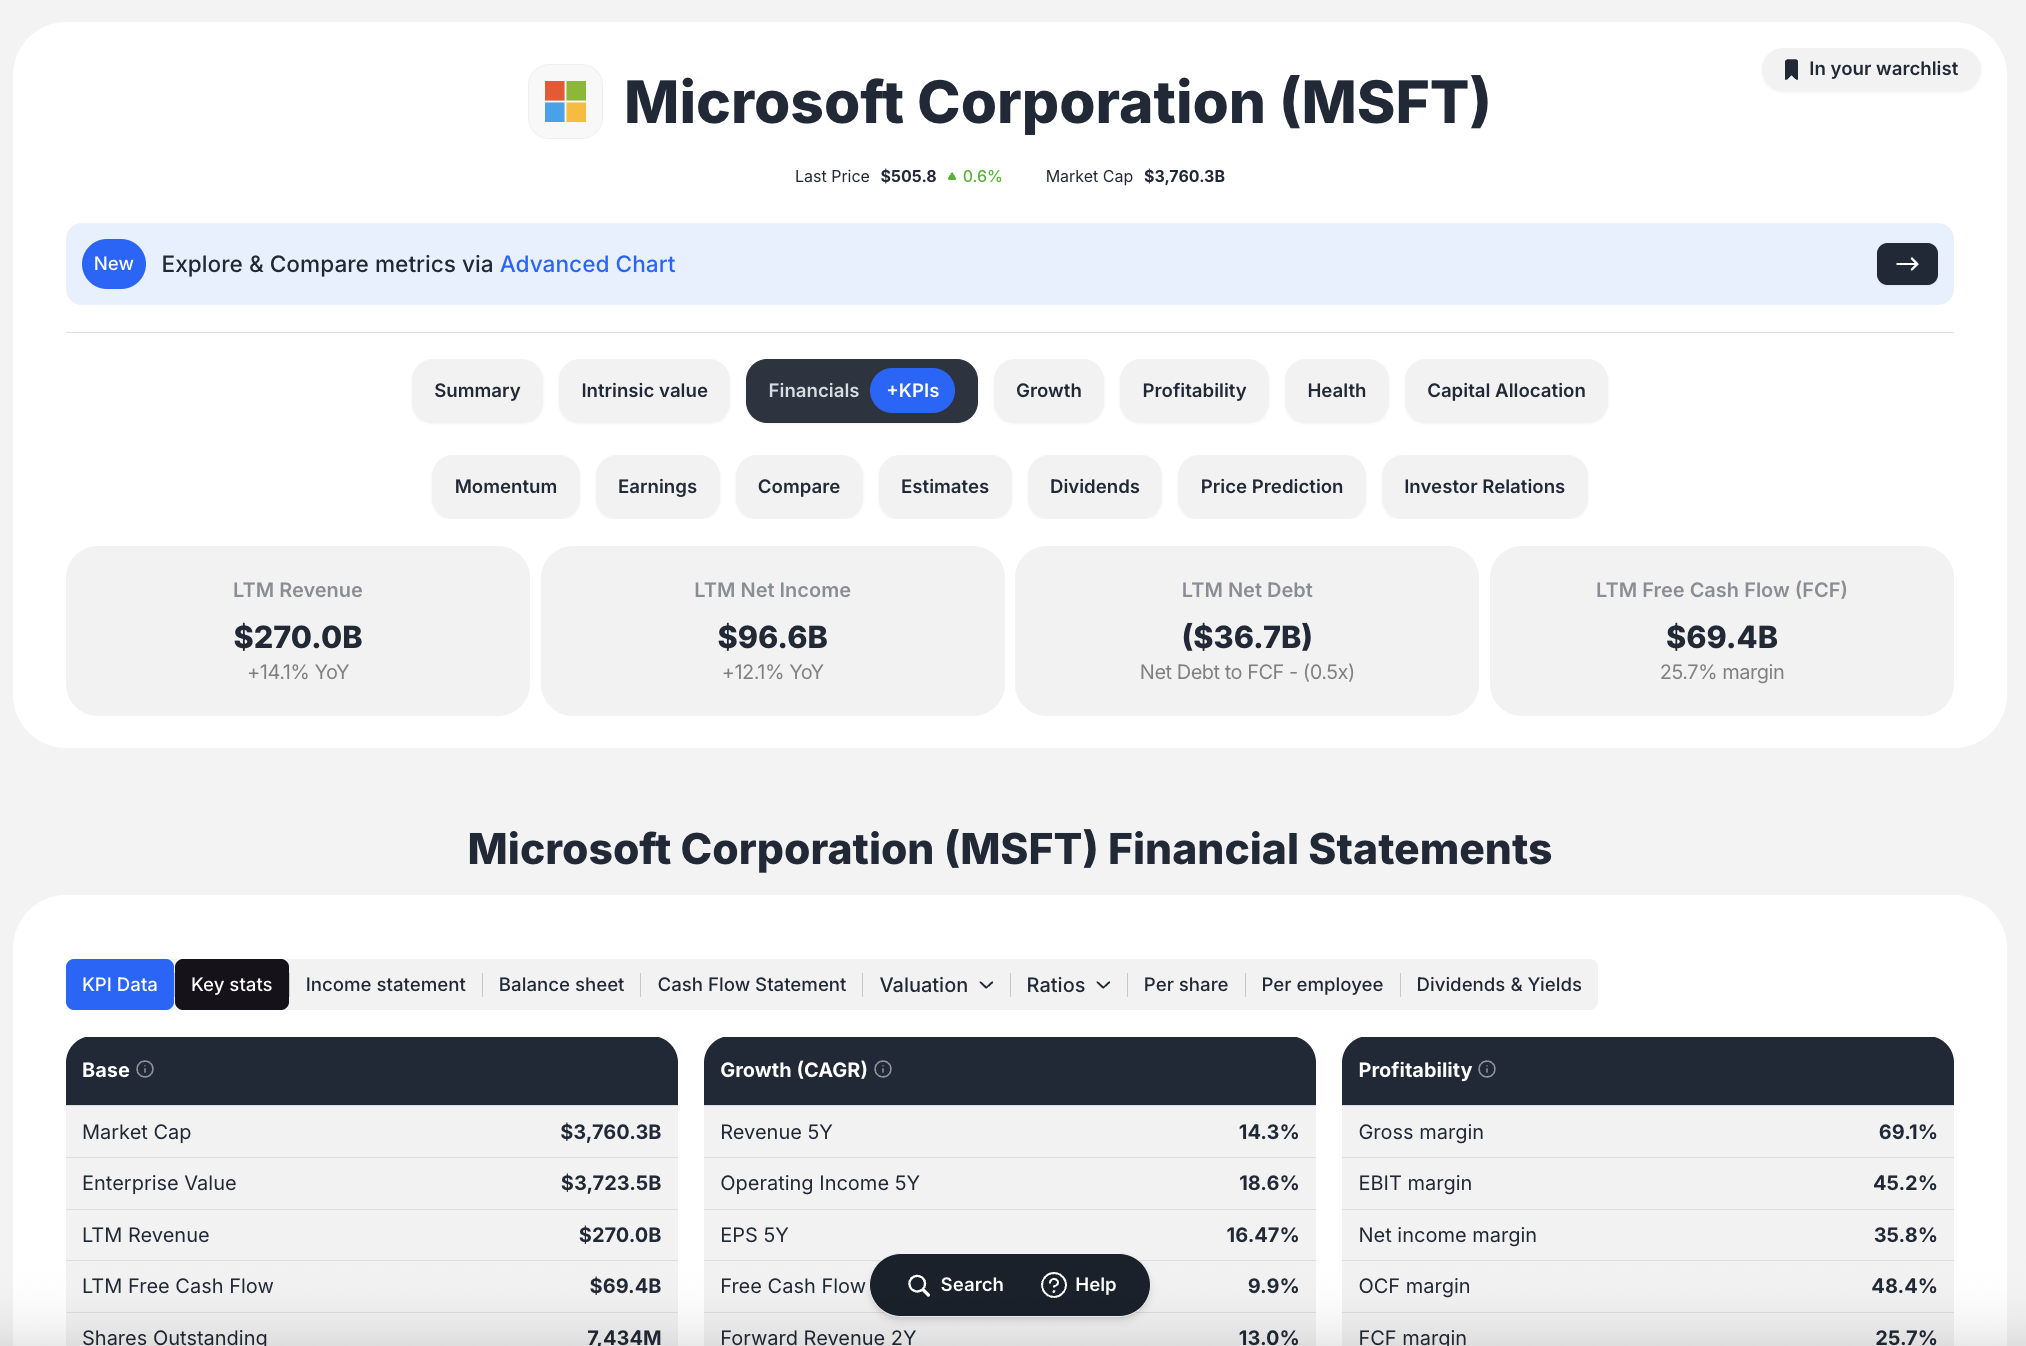
Access KPI Data: The "KPI Data" tab loads as the default view in the Financial Statements section
Navigate Content: Scroll vertically through the comprehensive data table
Types of KPIs and Segment Data Available
Revenue Segmentation:
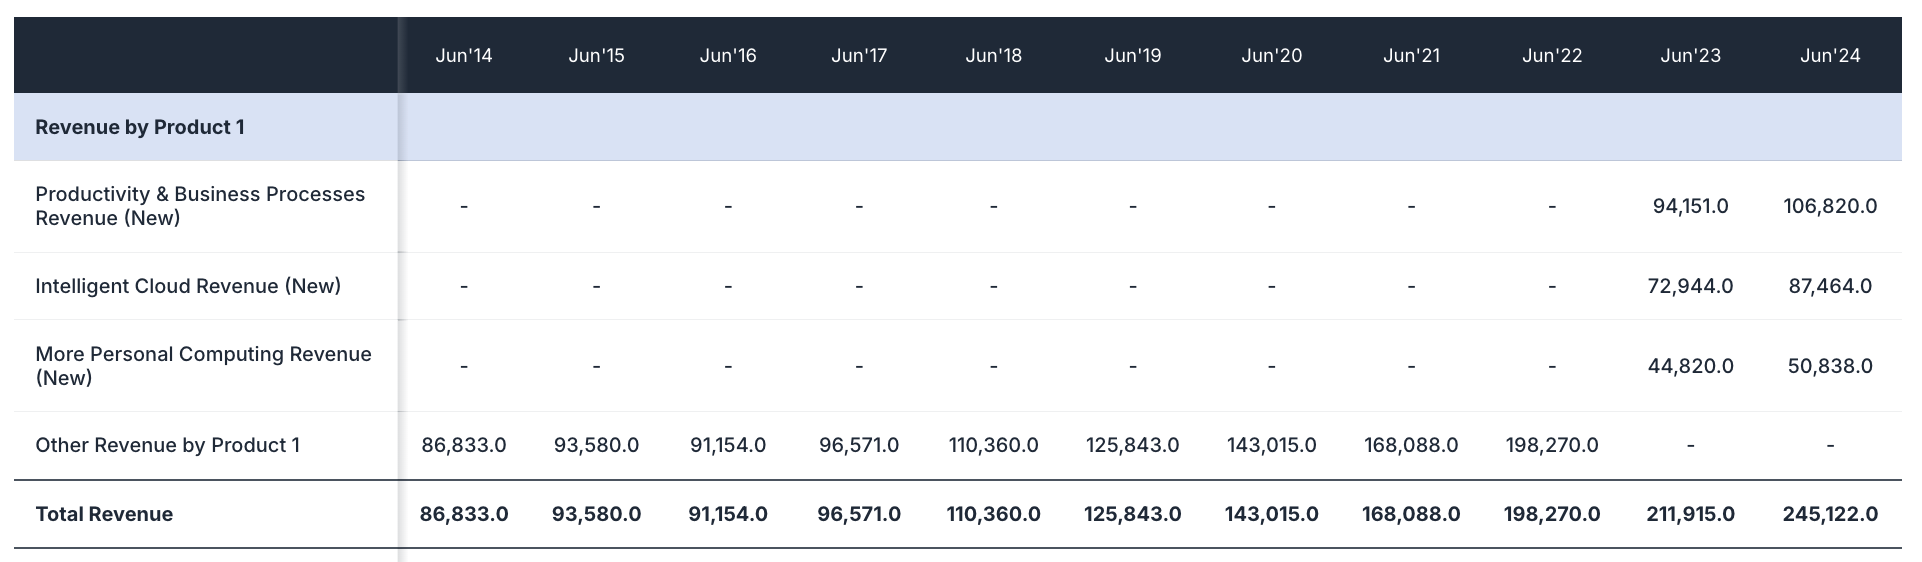
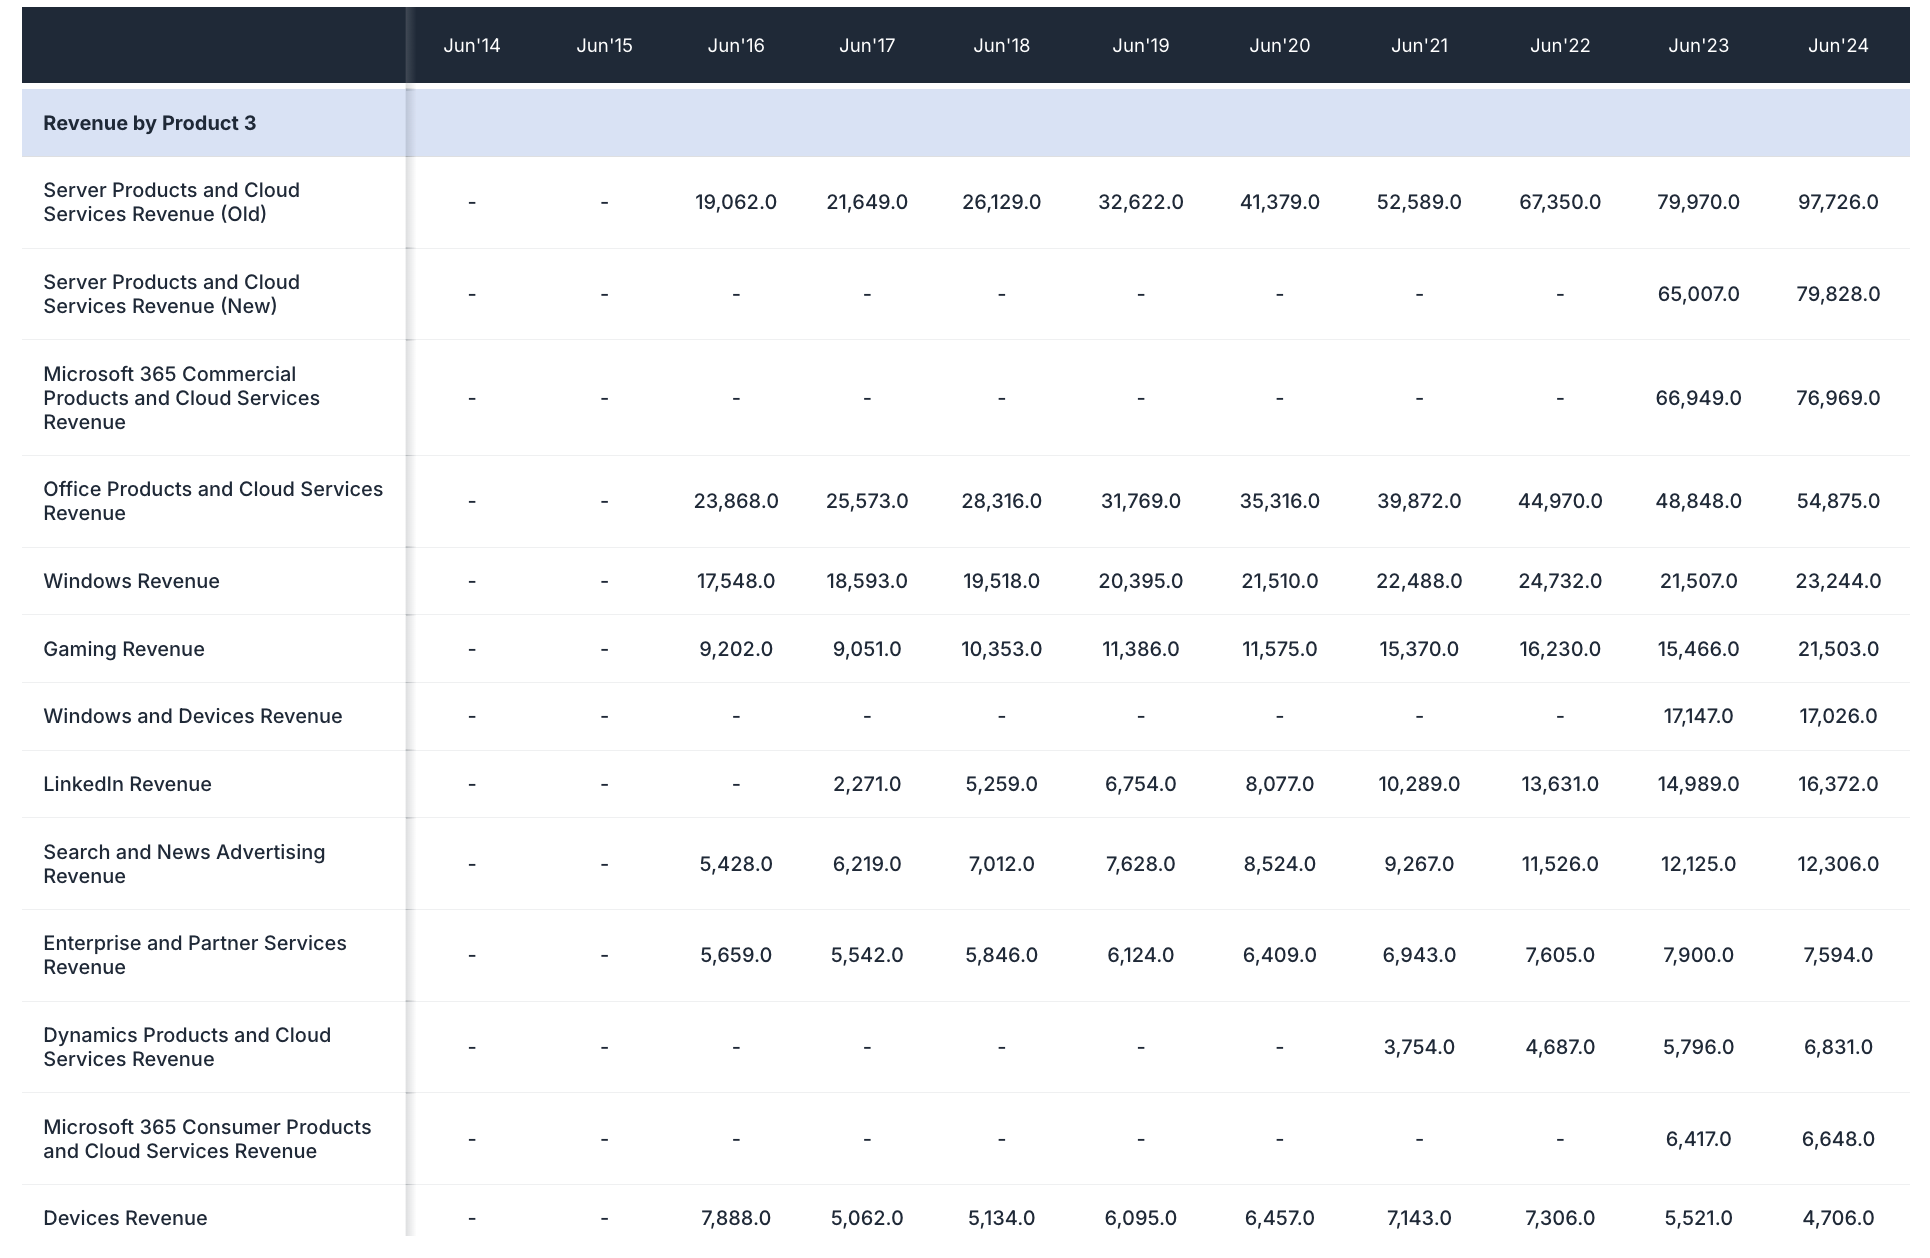
- Business Segments: Breakdown by company reporting structures (e.g., "Productivity & Business Processes", "Intelligent Cloud", "More Personal Computing")
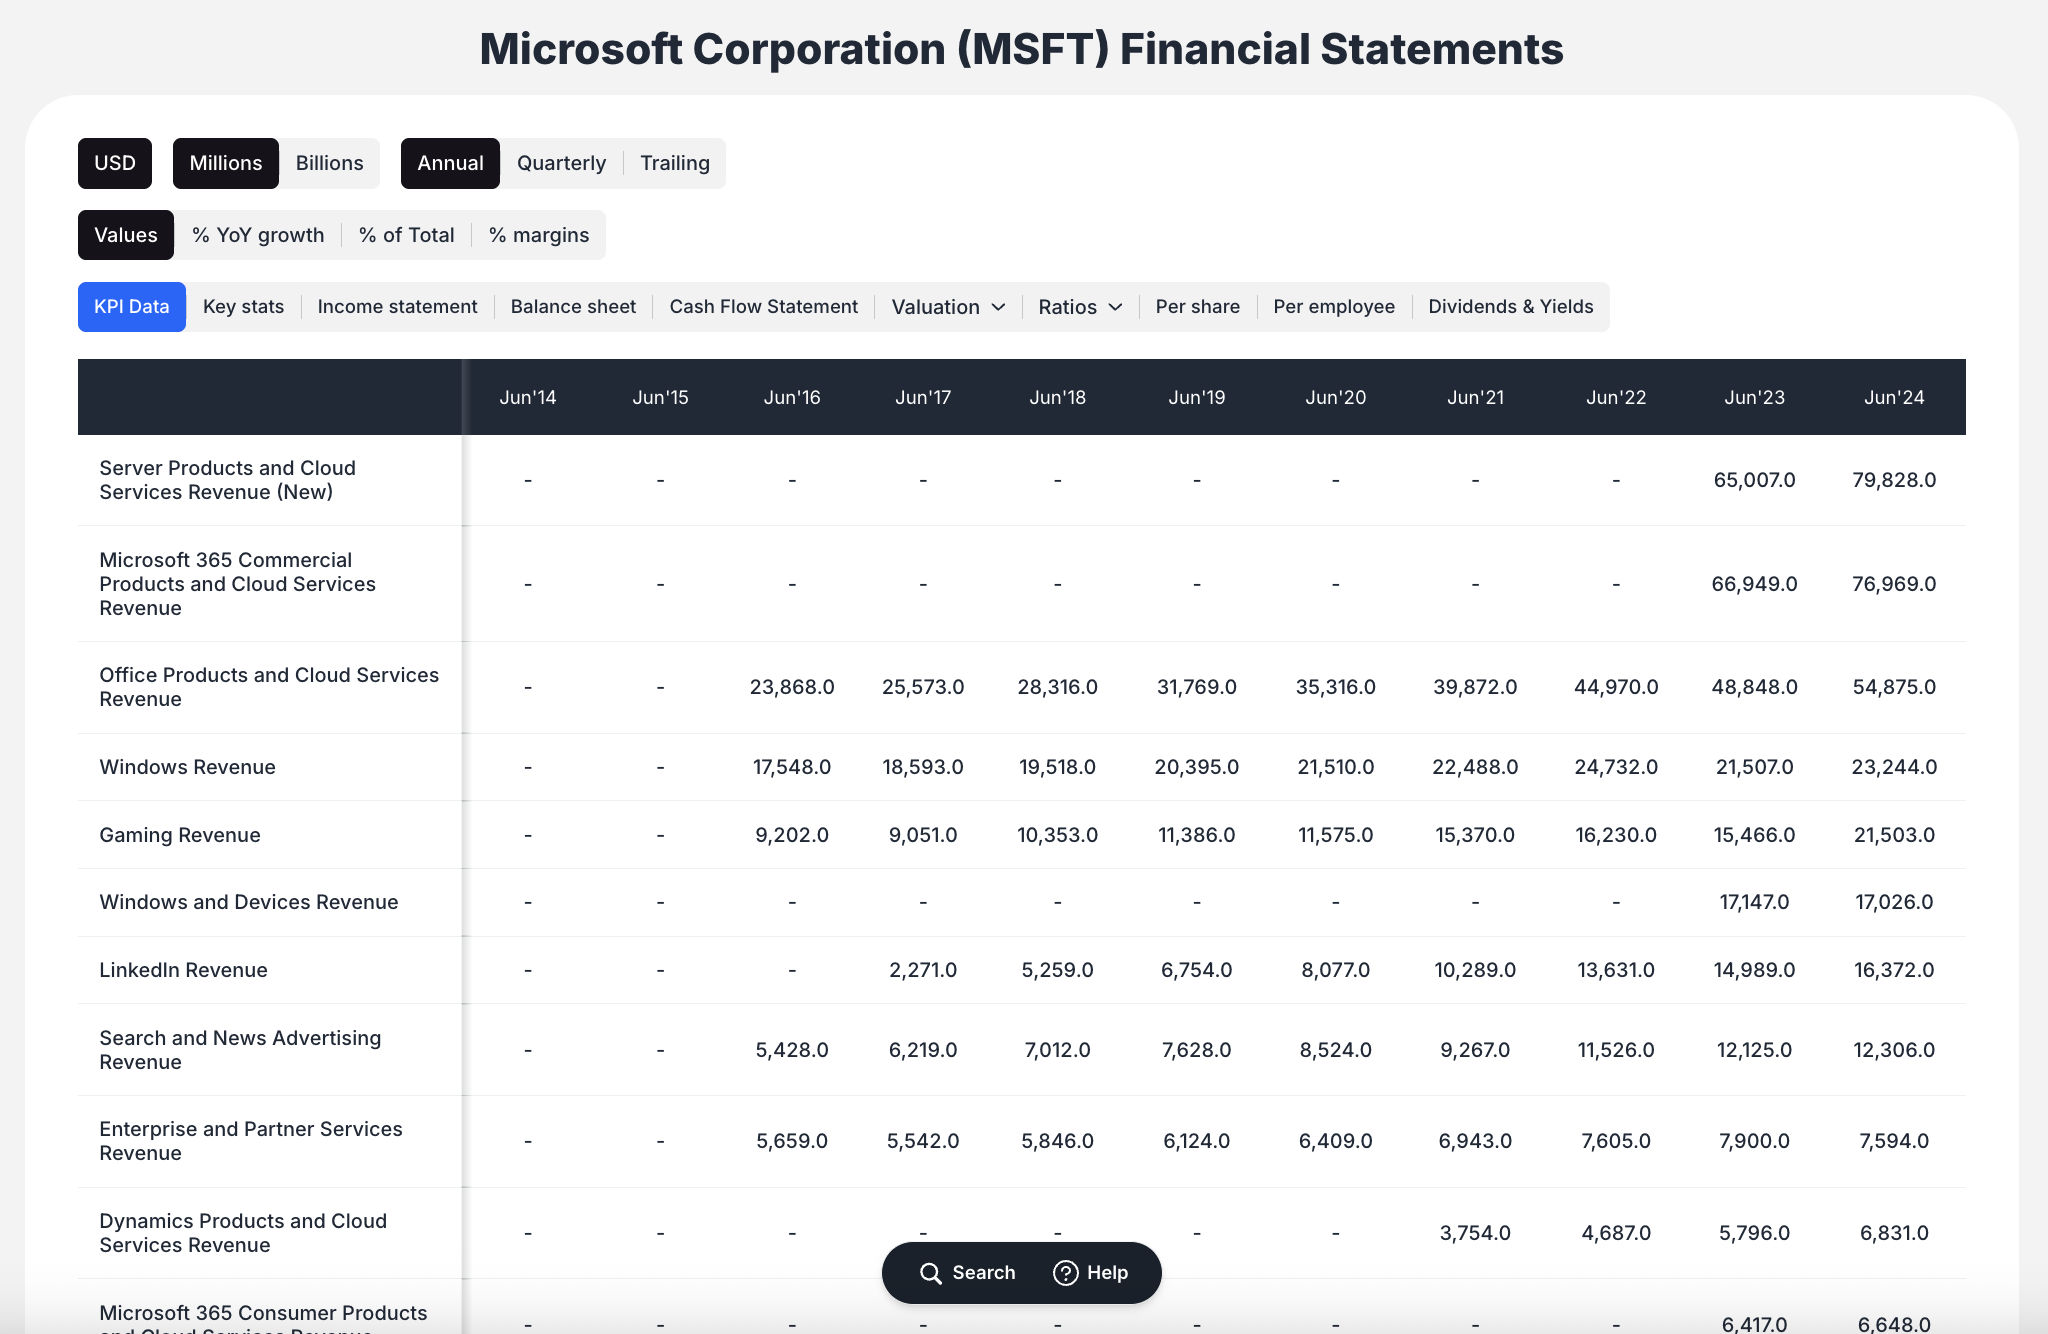
- Product Lines: Granular data for specific products (Windows Revenue, Gaming Revenue, LinkedIn Revenue)
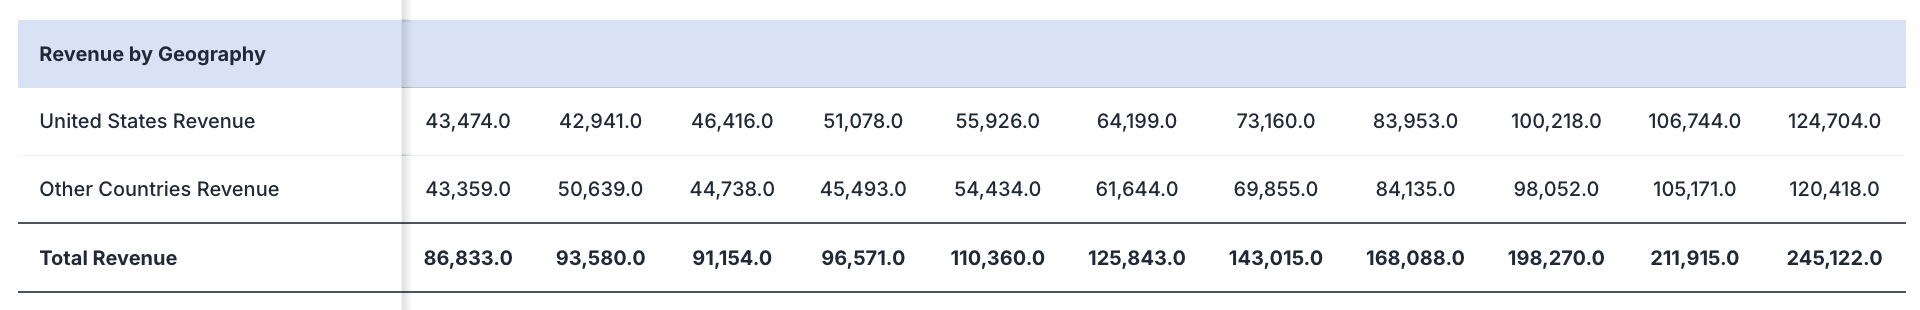
- Geographic Breakdown: Revenue by regions (United States, Other Countries, specific country breakdowns)
Operational Metrics:
- Key Performance Indicators:
- Bookings metrics (Microsoft Cloud Revenue, Commercial Bookings Growth)
- Subscriber counts (Microsoft 365 Commercial Seat Growth, Consumer Subscribers)
- Growth metrics (Azure & Other Cloud Services Growth)
- Performance obligations (Remaining Performance Obligations - RPO)
Profitability Analysis:
- Operating Income by Segment: Aligned with current reporting structures
- Segment Profitability: Performance analysis for each business unit
- Margin Analysis: Profitability metrics across different segments
Filtering and Data Control Options
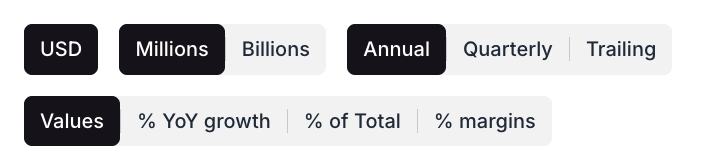
Display Units:
- Financial Units: Toggle between "Millions" and "Billions" for appropriate scale
- Default Currency: USD formatting maintained across all metrics
Time Period Selection:
- Annual View: Year-over-year analysis with fiscal year data
- Quarterly View: Detailed quarterly performance tracking
- Trailing View: Trailing twelve months (TTM) calculations
Data Customization:
- Flexible Viewing: Adjust display preferences for optimal analysis
- Consistent Formatting: Maintain formatting preferences across sessions
Segment Analysis and Breakdown Features
Multi-Level Analysis:
- Business Segments: Top-level business unit performance
- Product Lines: Granular product-specific metrics
- Geographic Regions: Location-based performance analysis
- Historical Mapping: Connection between old and new reporting structures
Comprehensive Breakdowns:
- Revenue Analysis: Complete revenue stream identification
- Profitability Metrics: Operating income by segment
- Growth Tracking: Performance evolution across segments
- Strategic Insights: Understanding business unit contributions
Historical Data Tracking and Trends
Long-Term Data Access:
- Extensive History: Over 10 years of historical data available
- Trend Analysis: Easy identification of long-term patterns
- Evolution Tracking: Monitor business transformation over time
Trend Identification:
- Growth Patterns: Identify expanding and contracting business areas
- Seasonal Variations: Understand cyclical business patterns
- Strategic Shifts: Track corporate strategy evolution through data
Data Sources and Methodology
Data Sources:
- Official Filings: Sourced from 10-K, 10-Q, and earnings reports
- Company Reports: Direct from official company communications
- Regulatory Filings: SEC and other regulatory submissions
Data Processing:
- Standardization: Consistent formatting across different companies
- Historical Mapping: Connection between old and new reporting structures
- Quality Assurance: Verification and validation of data accuracy
Data Accuracy and Updates
Update Frequency:
- Regular Updates: Data refreshed following company earnings releases
- Current Information: Includes most recently reported fiscal periods
- Forward-Looking: May include consensus estimates for future periods
Quality Assurance:
- Professional Standards: High accuracy standards maintained
- Source Verification: Data validated against official company reports
- Consistency Checks: Regular verification of data integrity
Step-by-Step Usage Guide
Viewing KPI and Segment Data:
- Navigate to company's main page (e.g., MSFT)
- Click "Financials / KPIs" tab in top navigation
- Review default "KPI Data" tab display
- Use filter buttons to adjust view (Units: Millions/Billions, Period: Annual/Quarterly/Trailing)
- Scroll through detailed breakdown of revenue, income, and KPIs
Comparing Between Companies:
- Start on company's KPI Data page (e.g., MSFT)
- Click main search bar at top of page
- Select different company from dropdown (e.g., "NVDA NVIDIA Corporation")
- Platform loads new company while retaining "Financials / KPIs" tab view
- Apply same filters for consistent comparison format
Best Practices for KPI Analysis
Effective Analysis Strategies:
- Start with Segments: Understand business unit structure first
- Historical Context: Review trends over multiple years
- Cross-Reference: Compare KPIs with financial statement data
- Industry Context: Consider sector-specific performance metrics
Strategic Insights:
- Growth Drivers: Identify fastest-growing segments
- Profitability Analysis: Understand which segments drive margins
- Strategic Shifts: Track resource allocation and focus changes
- Market Position: Assess competitive positioning through metrics
Data Interpretation:
- Seasonal Patterns: Consider cyclical business variations
- Reporting Changes: Understand impact of new reporting structures
- Strategic Context: Connect KPI trends to corporate strategy
- Forward Indicators: Use KPIs to predict future performance
This comprehensive KPI & Segments Data feature provides ValueSense users with granular operational insights essential for thorough company analysis, enabling deeper understanding of business performance beyond traditional financial metrics.