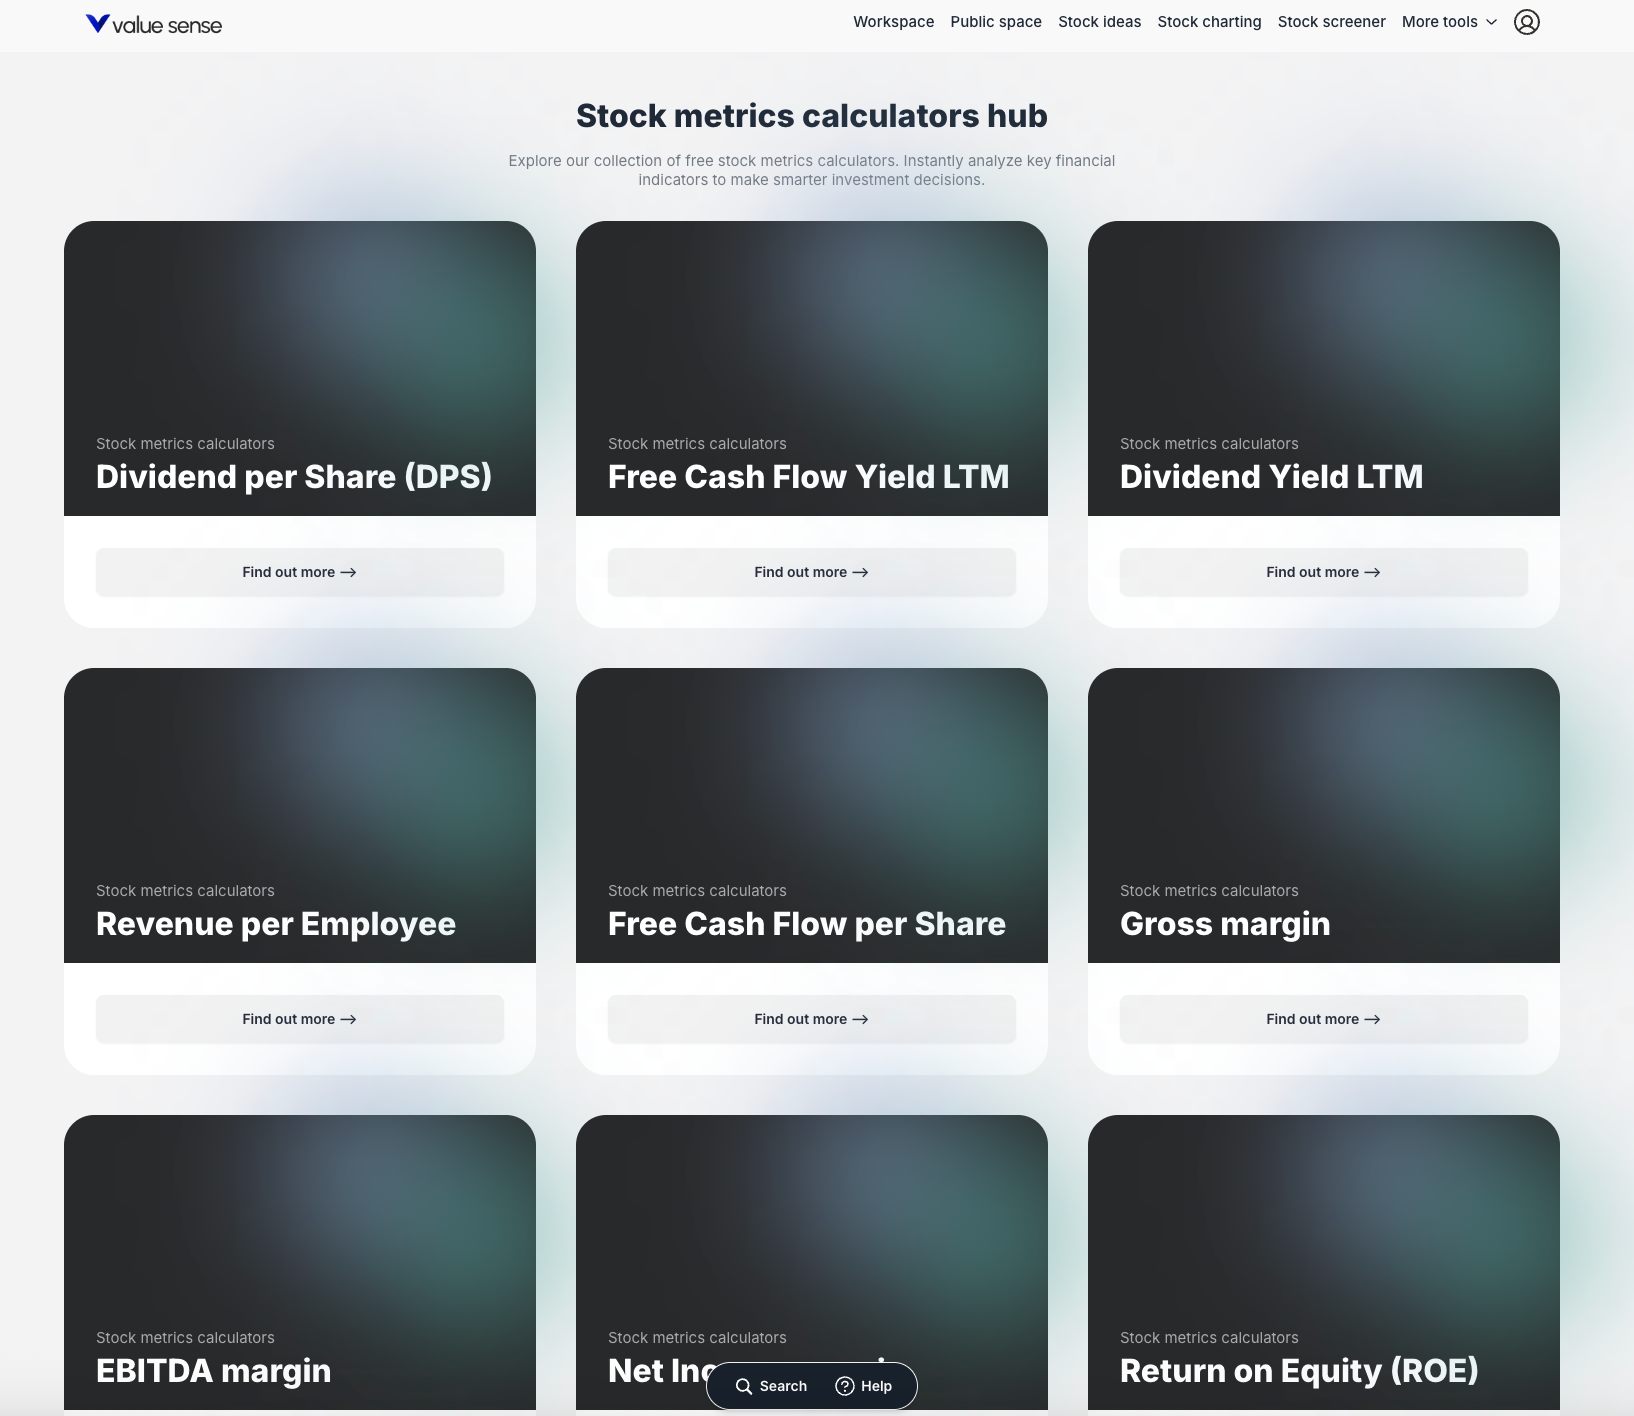
ValueSense features - Metric calculators
Metric Calculators are analytical tools that provide instant, in-depth analyses for specific financial metrics for any publicly traded company. Instead of manual calculations, these tools generate comprehensive reports that help you analyze key financial indicators to make smarter investment decisions by providing automated data gathering, historical context, and peer comparisons.
Accessing Metric Calculators
From the Website Footer
- Navigate to any ValueSense
- Scroll down to the website footer
- Under the "Tools" column, click on "Metric Calculators"
- Access the main "Stock metrics calculators hub" page

What Metric Calculators Do
Core Purpose
Metric Calculators transform complex financial analysis into accessible, automated reports that provide:
- Instant Metric Analysis: Pre-calculated values for specific financial indicators
- Historical Context: Multi-year trends and patterns
- Peer Comparisons: Benchmarking against industry competitors
- Industry Context: Comparison to sector averages
Key Benefits
- Time-Saving: Eliminates manual data gathering and calculation
- Comprehensive Analysis: Three layers of context for every metric
- Professional Quality: Institutional-grade financial analysis
- Interactive Exploration: Dynamic charts and data visualization
Available Calculator Categories
Profitability Metrics
- Gross Margin, EBITDA Margin, Net Income Margin
- Return on Equity (ROE), Return on Invested Capital (ROIC)
- Return on Capital Employed (ROCE)
Dividend Analysis
- Dividend per Share (DPS)
- Dividend Yield LTM
Cash Flow Metrics
- Free Cash Flow Yield LTM
- Free Cash Flow per Share
- Free Cash Flow
Efficiency Indicators
- Revenue per Employee
- Days Inventory Outstanding (DIO)
- Days Sales Outstanding (DSO)
Valuation Multiples
- P/E LTM, PEG 1Y
- EV/Revenue LTM, EV/EBITDA LTM
Solvency & Liquidity
- Total Debt to Total Equity
- Total Debt to EBITDA
- Quick Ratio
Financial Health Scores
- Altman Z-score
- Piotroski F-score
- Beneish M-score
Core Financial Data
- Market Cap, Enterprise Value, Net Debt
- Capital Expenditure, Revenue, Net Income
- Stock-based Compensation, Cost of Goods Sold
- Cash & Cash Equivalents
How to Use Metric Calculators
Step 1: Select Your Metric

- Browse the calculators hub page
- Click "Find out more" on your desired metric card (e.g., "Revenue per Employee")
- Navigate to the dedicated metric analysis page
Step 2: Choose Your Company
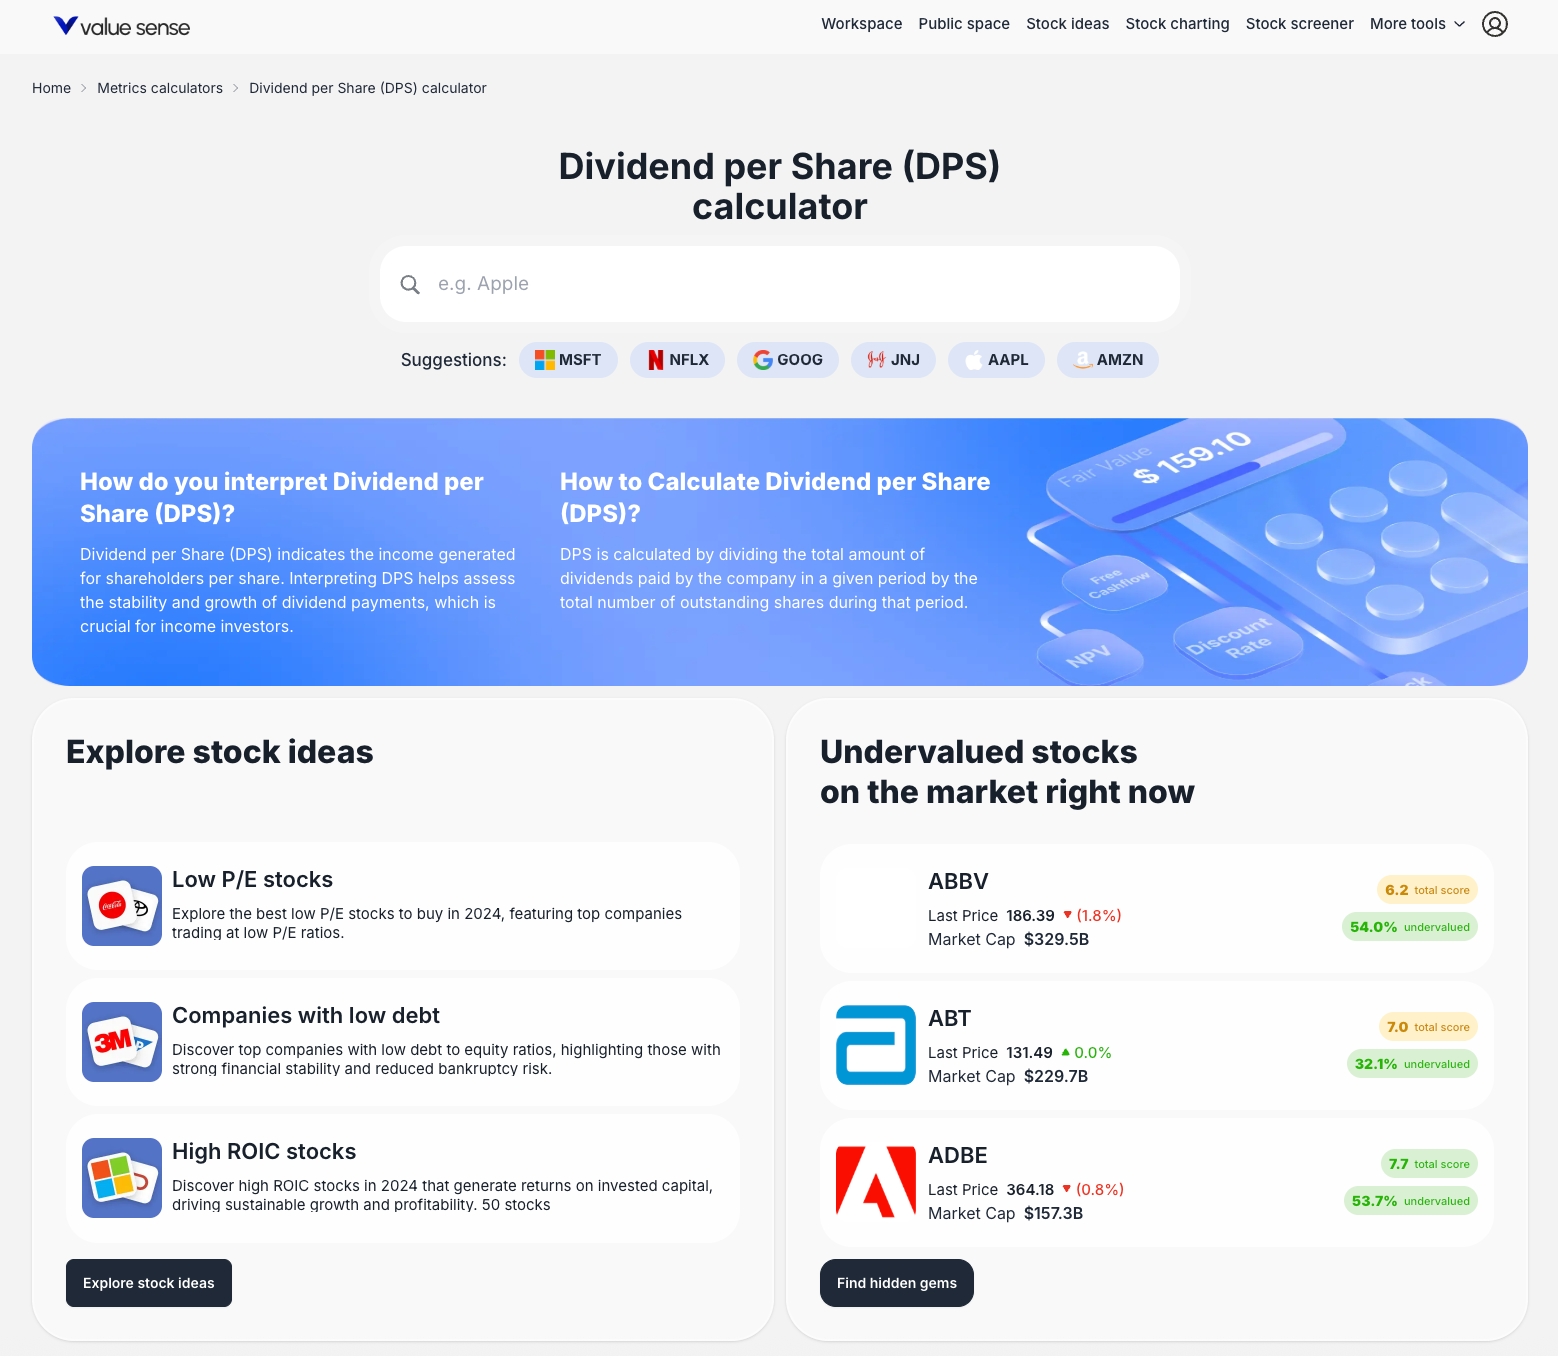
- Search Method: Type company name or ticker in the search bar (e.g., "Apple")
- Quick Selection: Click on pre-populated suggestions (MSFT, NFLX, GOOG)
- Instant Analysis: System generates comprehensive report
Step 3: Analyze the Results
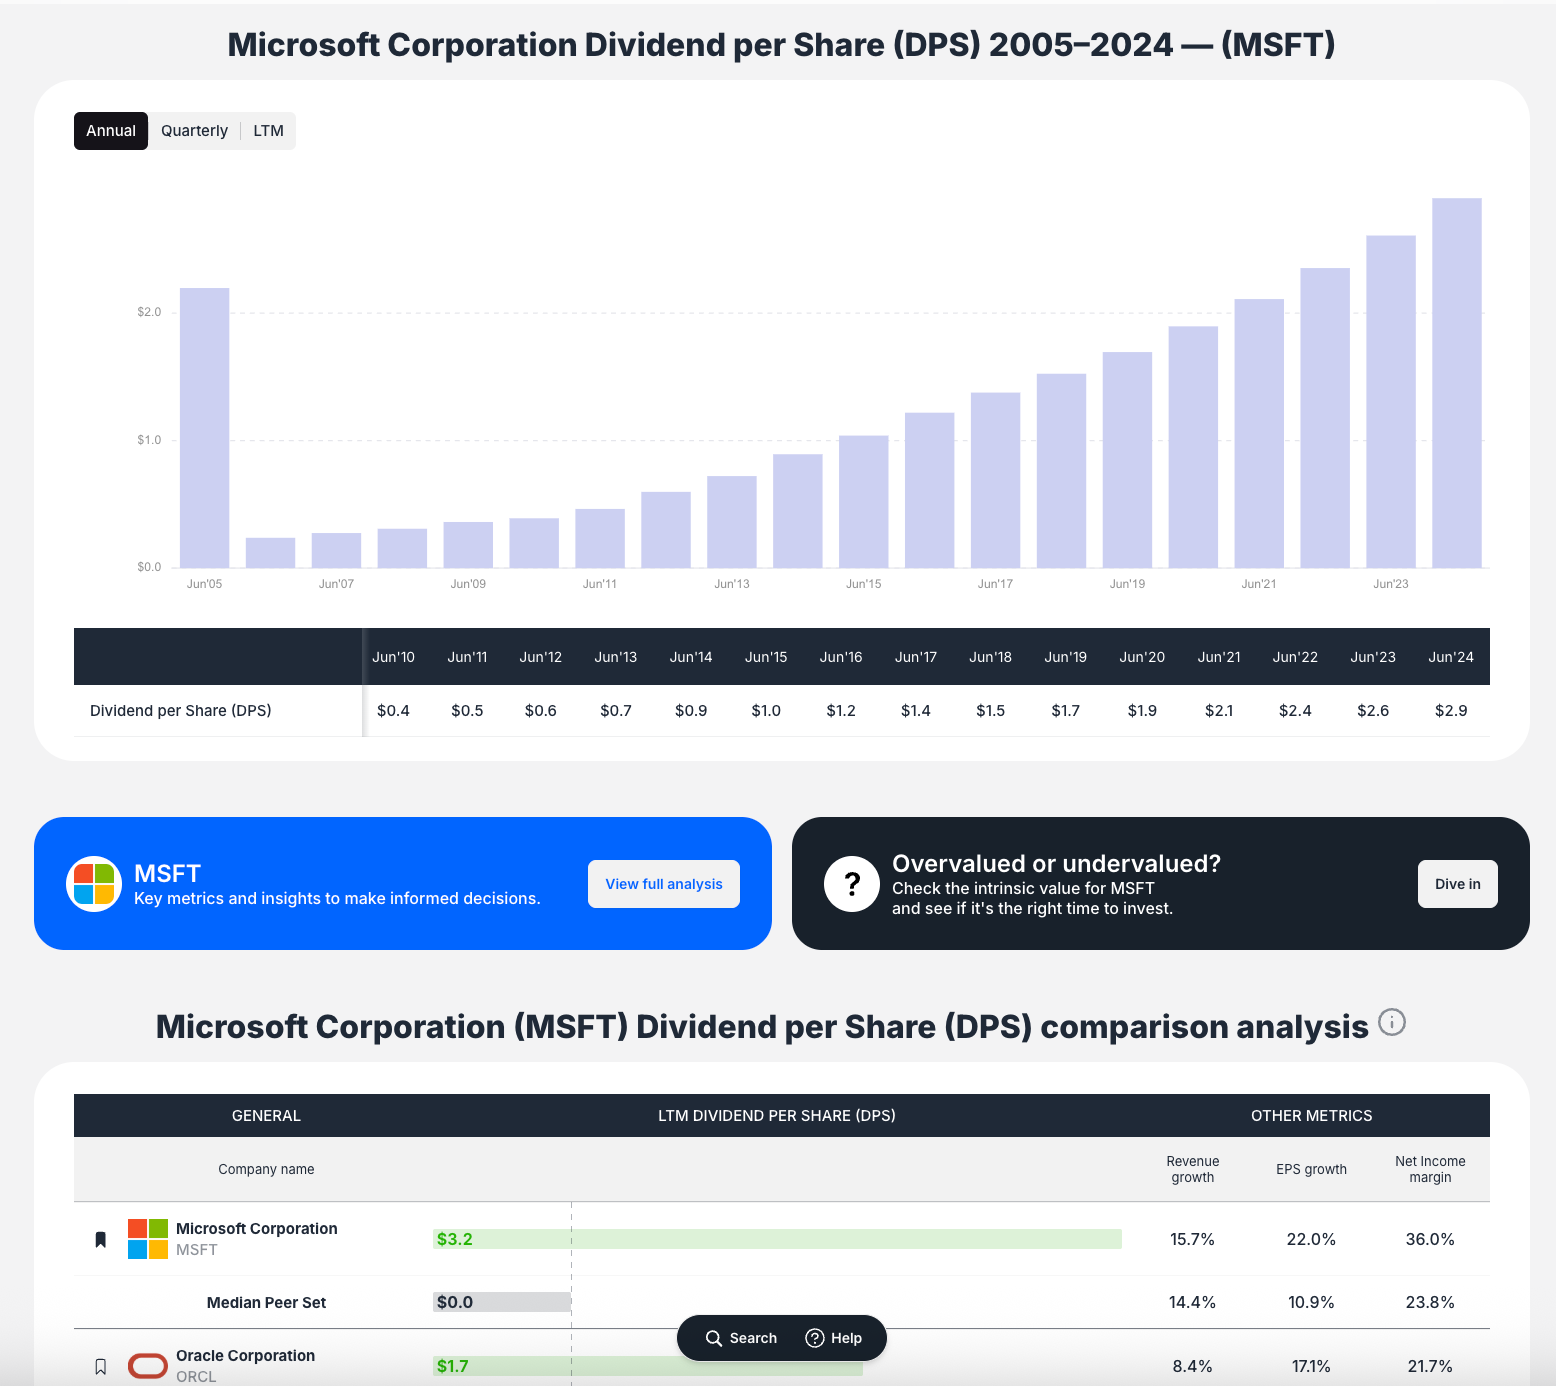
- Summary Review: Check current metric value vs. historical and industry averages
- Historical Trends: Use interactive charts to understand performance over time
- Peer Benchmarking: Compare against direct competitors
Comprehensive Analysis Outputs
Summary Box
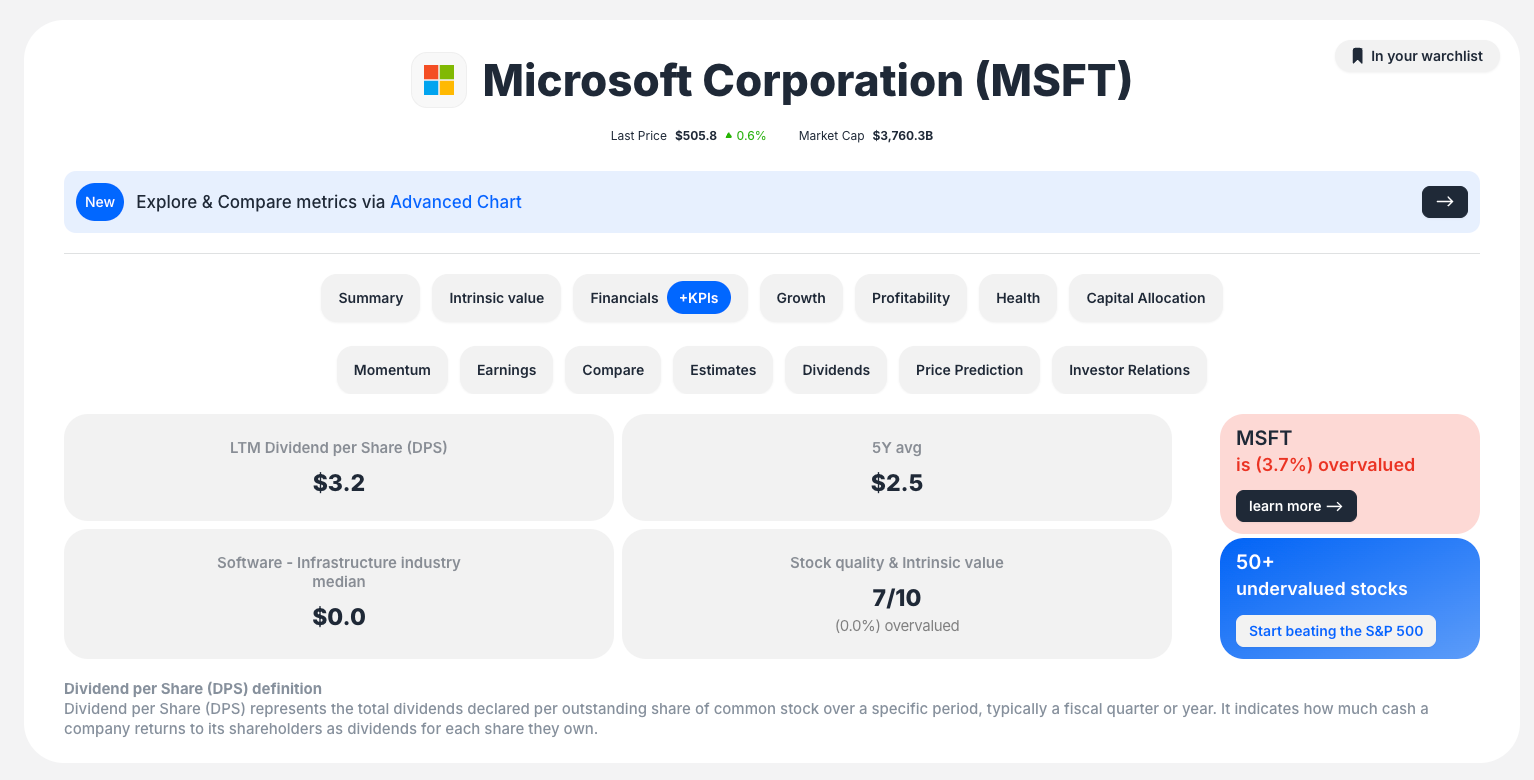
- LTM Value: Current last-twelve-months metric value
- 5-Year Average: Company's historical performance
- Industry Average: Sector benchmark for comparison
Quality Assessment
- Stock Quality Score: Proprietary rating (e.g., "7/10")
- Intrinsic Value Rating: Investment attractiveness indicator
- Overall Assessment: Comprehensive company evaluation
Interactive Historical Chart
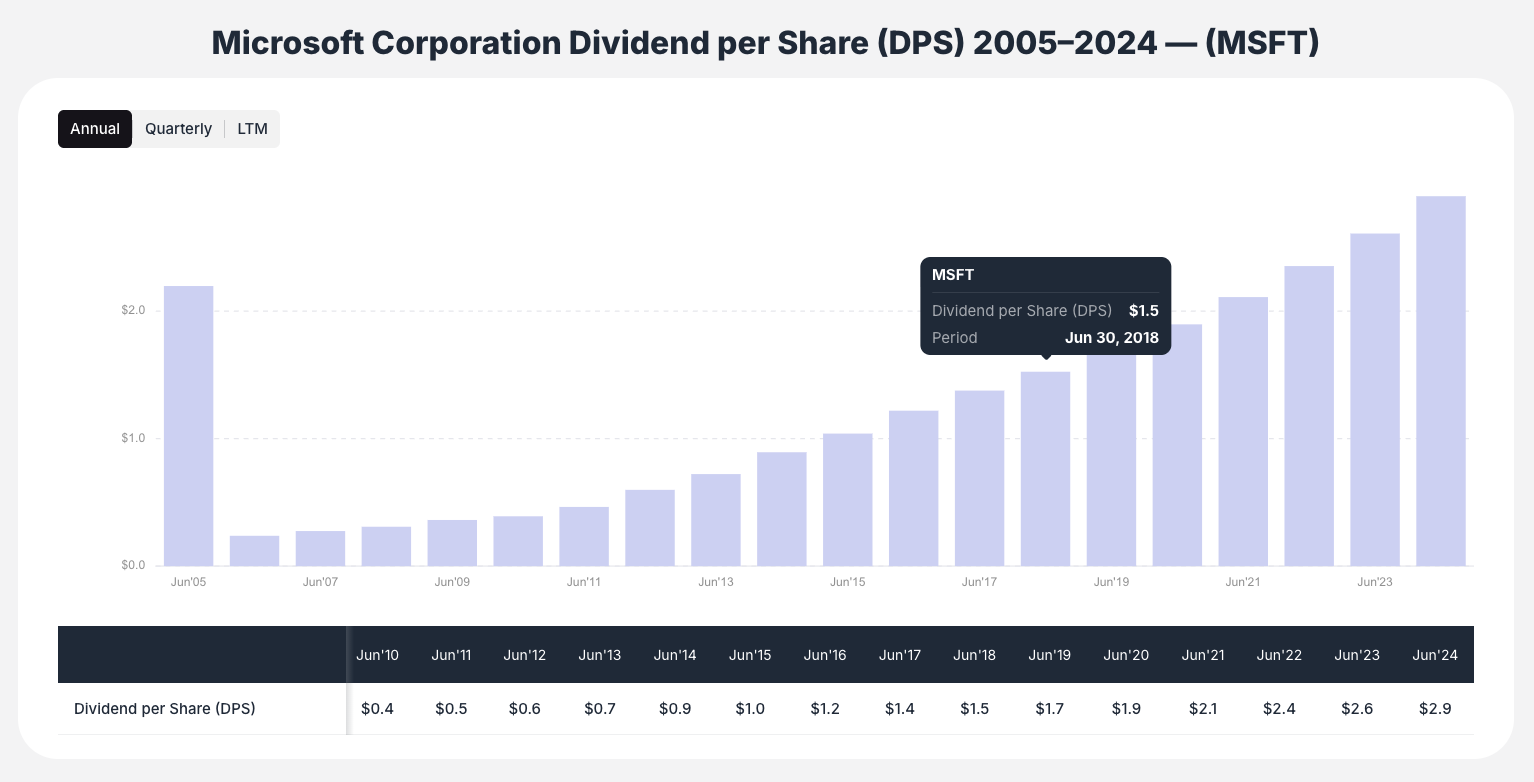
- Multi-Year Visualization: Performance from 2005-2024
- Hover Tooltips: Specific data points for any period
- View Toggles: Switch between Annual, Quarterly, and LTM views
- Industry Comparison: Toggle industry median comparison line
Peer Comparison Table
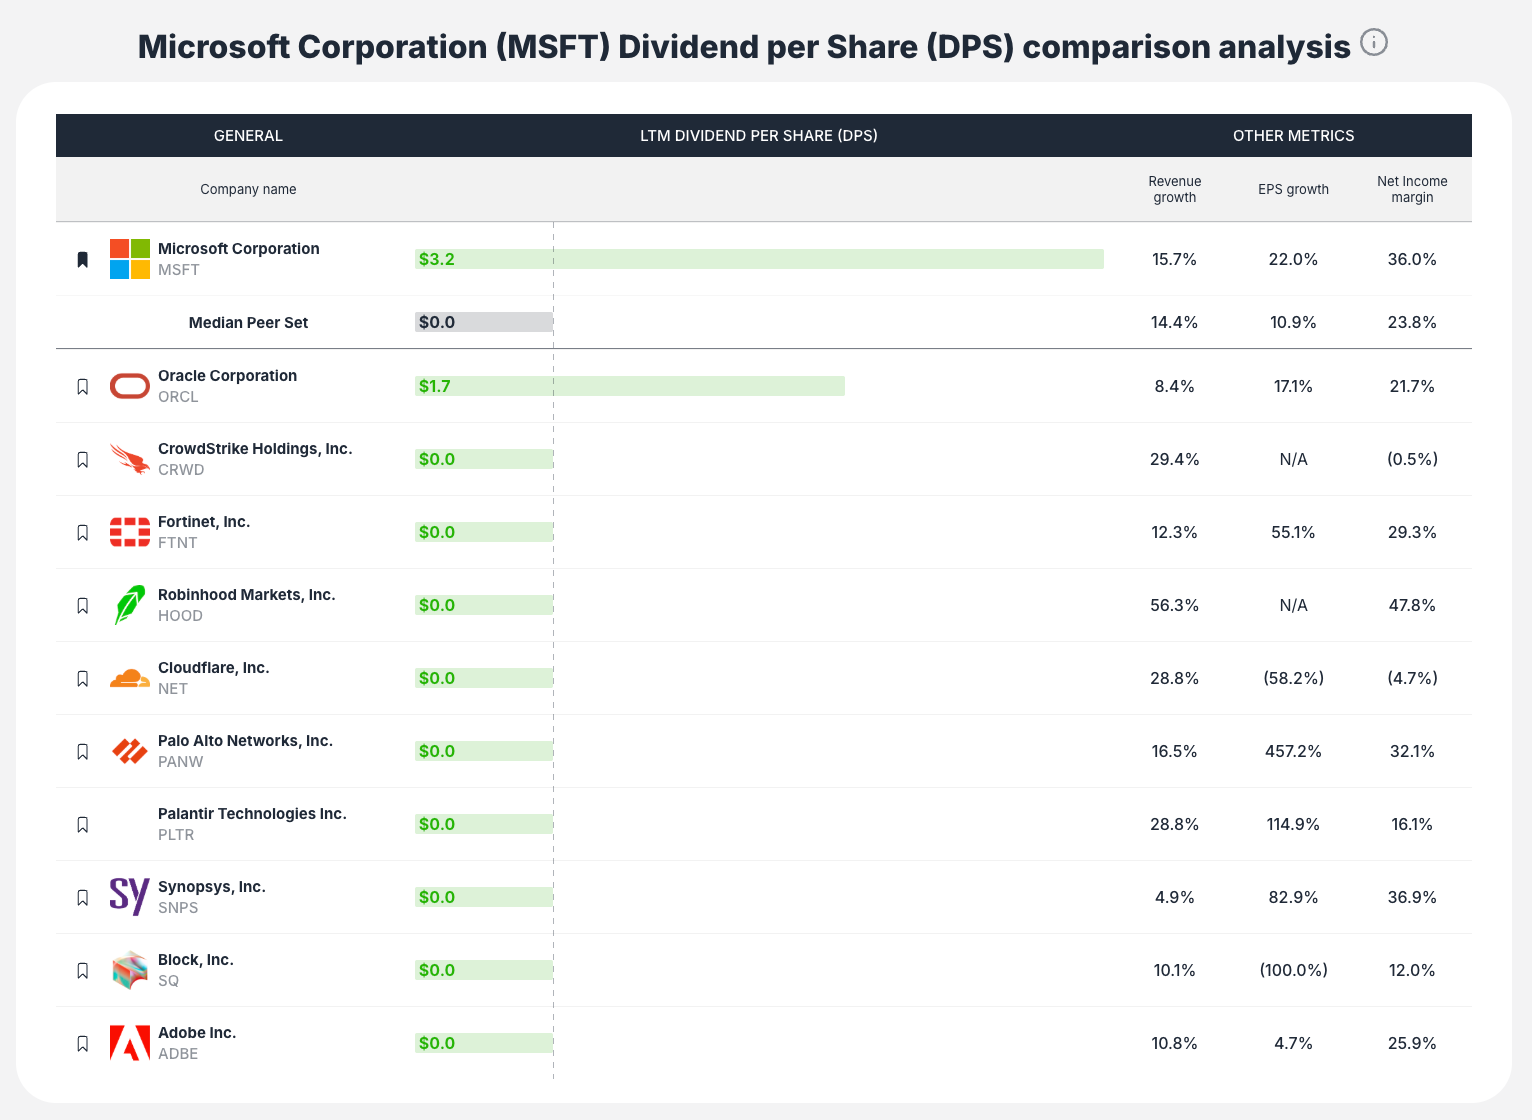
- Direct Competitors: Company vs. closest industry peers
- Metric Benchmarking: Side-by-side performance comparison
- Additional Context: Revenue Growth and Net Income Margin data
- Visual Indicators: Green bars for better performance, red for worse
Key Stats Module
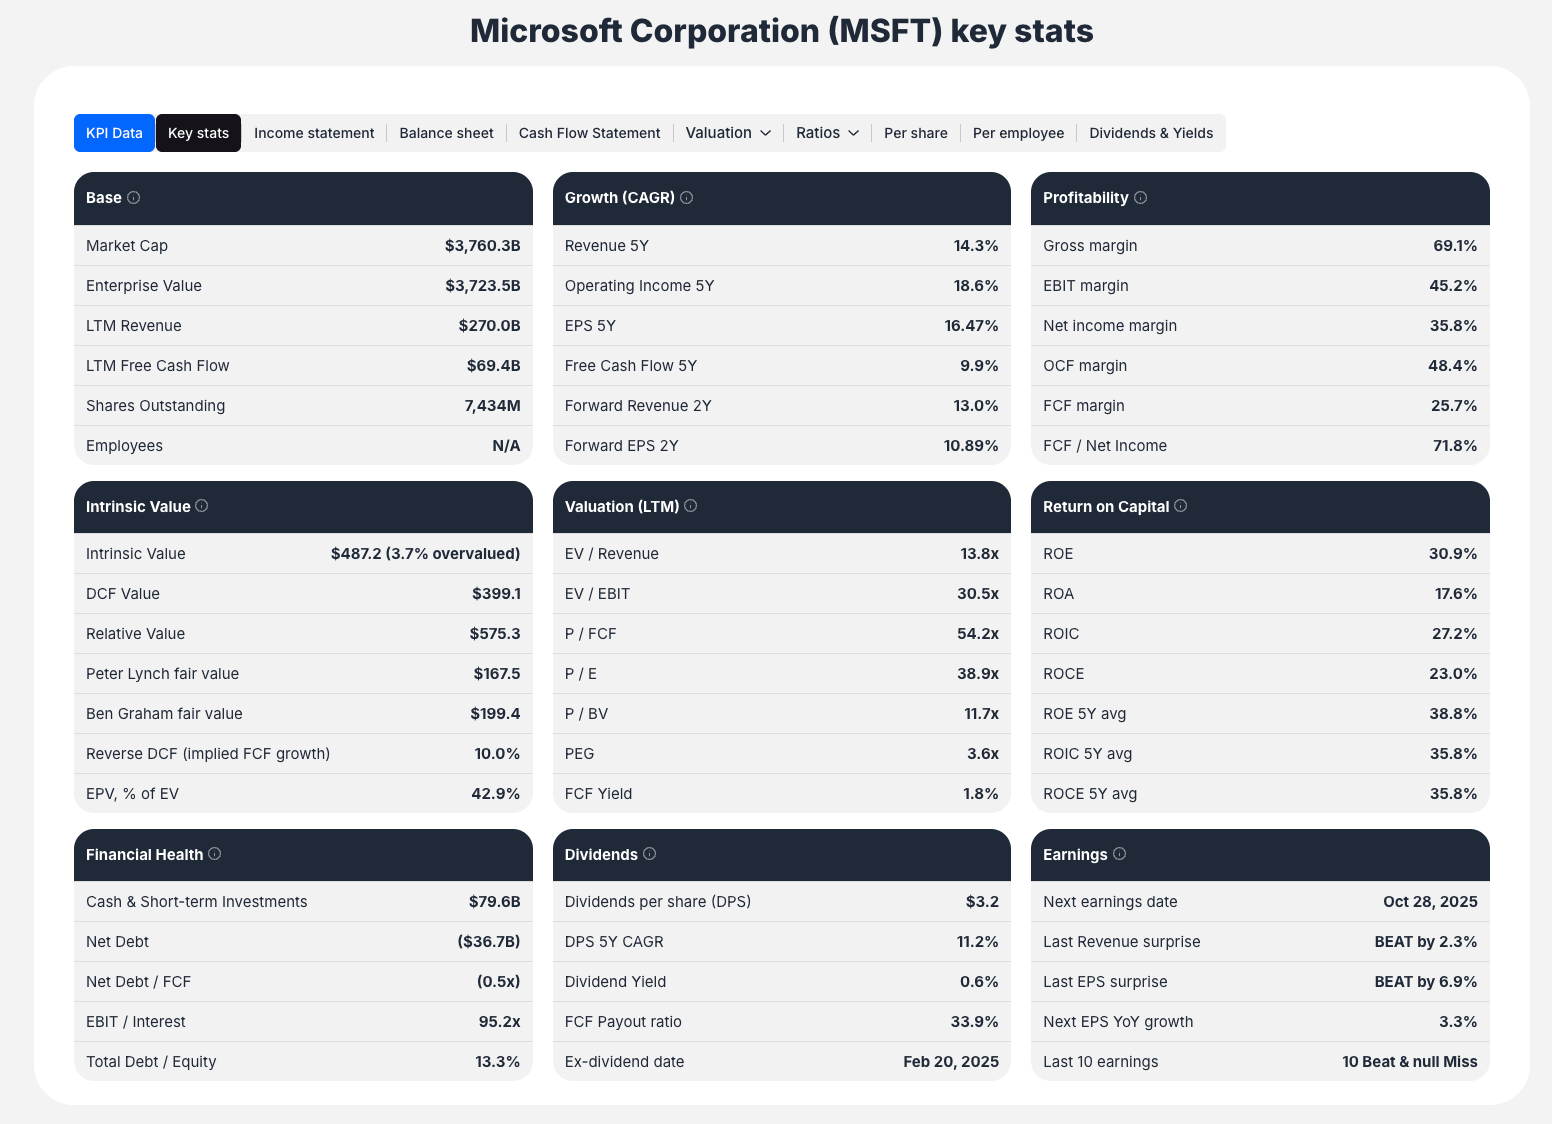
- Base Metrics: Fundamental financial data
- Growth Indicators: Revenue, earnings, and cash flow growth
- Profitability Analysis: Margin and return metrics
- Valuation Multiples: P/E, EV/EBITDA, and other ratios
- Financial Health: Debt, liquidity, and stability indicators
- Dividend Information: Yield, payout ratio, and growth
- Earnings Data: EPS trends and projections
Interactive Features
Chart Functionality
- Hover for Details: Mouse over charts to see specific data points
- Time Period Selection: Toggle between Annual, Quarterly, and LTM views
- Industry Comparison: Switch between company standalone and industry relative views
- Historical Context: Understand long-term trends and patterns
Search and Navigation
- Dynamic Search: Real-time company search with suggestions
- Quick Access: Popular ticker buttons for immediate analysis
- Seamless Flow: Logical progression from hub to detailed analysis
Key Workflow Steps
Step 1: Hub Navigation
Navigate to Metric Calculators hub from website footer
Step 2: Metric Selection
Choose financial metric aligned with your analysis objectives
Step 3: Company Selection
Search for or select company using ticker or name
Step 4: Analysis Review
- Review summary box for key metric values
- Examine historical chart for trend analysis
- Compare against peer companies
- Assess broader financial health context
Step 5: Interactive Exploration
- Use chart toggles to explore different time periods
- Hover over data points for specific values
- Switch between company and industry views
Use Cases and Benefits
Revenue per Employee Calculator
- Benefit: Assesses operational efficiency and productivity
- Use Case: Compare efficiency across tech companies or track single company improvement over time
- Application: Evaluate impact of hiring, layoffs, or automation initiatives
Return on Invested Capital (ROIC) Calculator
- Benefit: Measures capital allocation effectiveness
- Use Case: Identify high-quality "compounder" businesses with sustainable competitive advantages
- Application: Find companies with consistently high ROIC relative to industry peers
Dividend Analysis Calculators
- Benefit: Evaluate income-generating potential
- Use Case: Screen for sustainable dividend payers
- Application: Assess dividend growth and payout sustainability
Financial Health Calculators
- Benefit: Evaluate bankruptcy risk and financial stability
- Use Case: Risk assessment for conservative investors
- Application: Avoid companies with deteriorating financial health
Best Practices
Metric Selection
- Match Objectives: Choose metrics aligned with your investment strategy
- Industry Relevance: Select metrics appropriate for specific sectors
- Multiple Perspectives: Use various calculators for comprehensive analysis
Analysis Approach
- Historical Context: Always review multi-year trends
- Peer Comparison: Understand relative performance within industry
- Industry Averages: Consider sector-specific benchmarks
Interactive Usage
- Explore Time Periods: Use annual, quarterly, and LTM views
- Hover for Details: Access specific data points and dates
- Toggle Comparisons: Switch between company and industry perspectives
Key Features to Highlight
Three-Layer Context Analysis
- Historical Context: Interactive charts showing multi-year trends
- Peer Context: Comparison tables with direct competitors
- Industry Context: Sector average benchmarks in summary
Automated Analysis Tool
- Not Manual Calculator: Pre-built analysis rather than manual input
- Instant Reports: Comprehensive analysis generated automatically
- Professional Quality: Institutional-grade financial assessment
Interactive Elements
- Chart Toggles: Annual, Quarterly, LTM view options
- Hover Tooltips: Specific data points and time periods
- Industry Comparison: Toggle between standalone and relative views
Comprehensive Coverage
- Wide Metric Library: 30+ financial indicators across all categories
- Complete Analysis: From basic metrics to advanced financial health scores
- Integrated Platform: Seamless connection with other ValueSense tools
Metric Calculators transform complex financial analysis into accessible, automated tools that provide the context and comparisons necessary for informed investment decisions, making professional-grade financial analysis available to investors at all levels.