
Microsoft vs Google: Which Tech Giant Is More Undervalued in 2025?
Welcome to the Value Sense Blog, your resource for insights on the stock market! At Value Sense, we focus on intrinsic value tools and offer stock ideas with undervalued companies. Dive into our research products and learn more about our unique approach at valuesense.io
Explore diverse stock ideas covering technology, healthcare, and commodities sectors. Our insights are crafted to help investors spot opportunities in undervalued growth stocks, enhancing potential returns. Visit us to see evaluations and in-depth market research.
The eternal debate among value investors continues: when comparing Microsoft vs Google undervalued potential, which technology behemoth offers the better opportunity? With both companies commanding massive market capitalizations exceeding $2 trillion, determining true value requires diving deep beneath surface-level metrics.
After analyzing comprehensive financial data through ValueSense's intrinsic value tools, the answer isn't as straightforward as many investors assume. While conventional wisdom might suggest one clear winner, the reality presents a nuanced picture that demands careful consideration of multiple valuation approaches.
Current Market Position: The Numbers Don't Lie
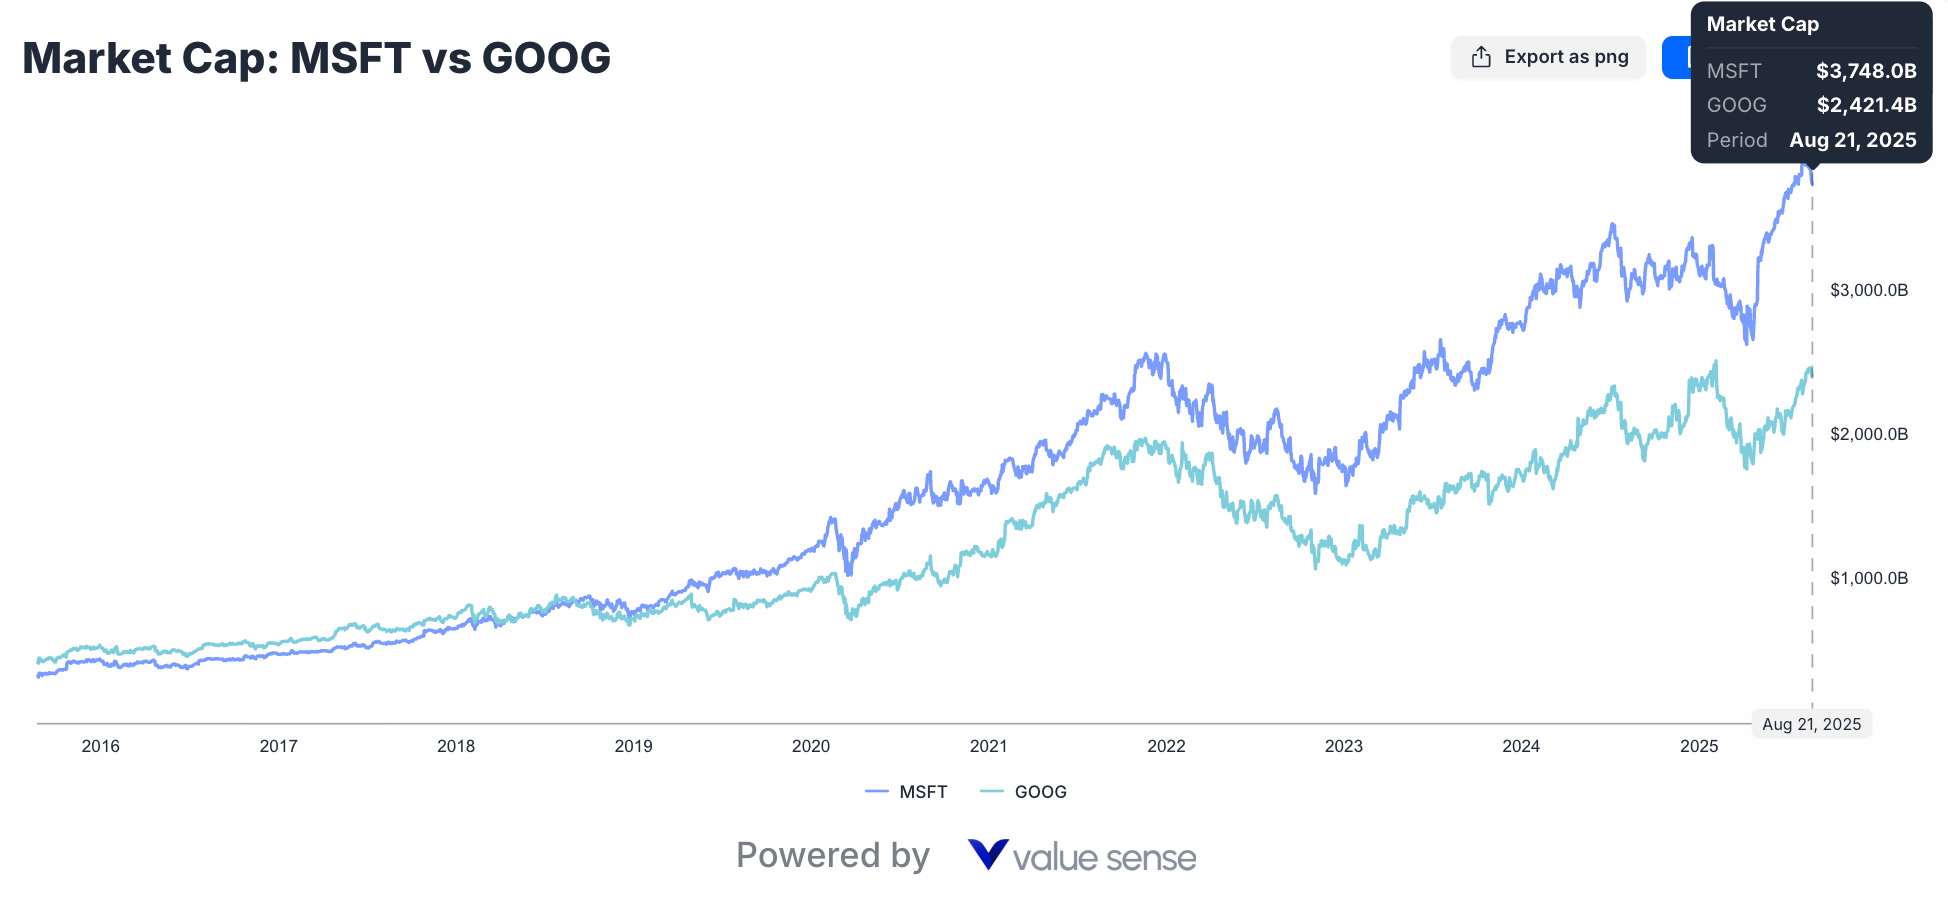
Microsoft currently dominates in market capitalization at $3,748 billion compared to Google's $2,421 billion as of August 2025. However, this $1.3 trillion difference tells only part of the story when evaluating MSFT vs GOOGL value proposition.
Google actually generates higher revenue at $371.4 billion versus Microsoft's $261.7 billion in Q2 2025. This revenue advantage immediately raises questions about whether Microsoft's premium valuation reflects genuine business superiority or market sentiment disconnected from fundamentals.
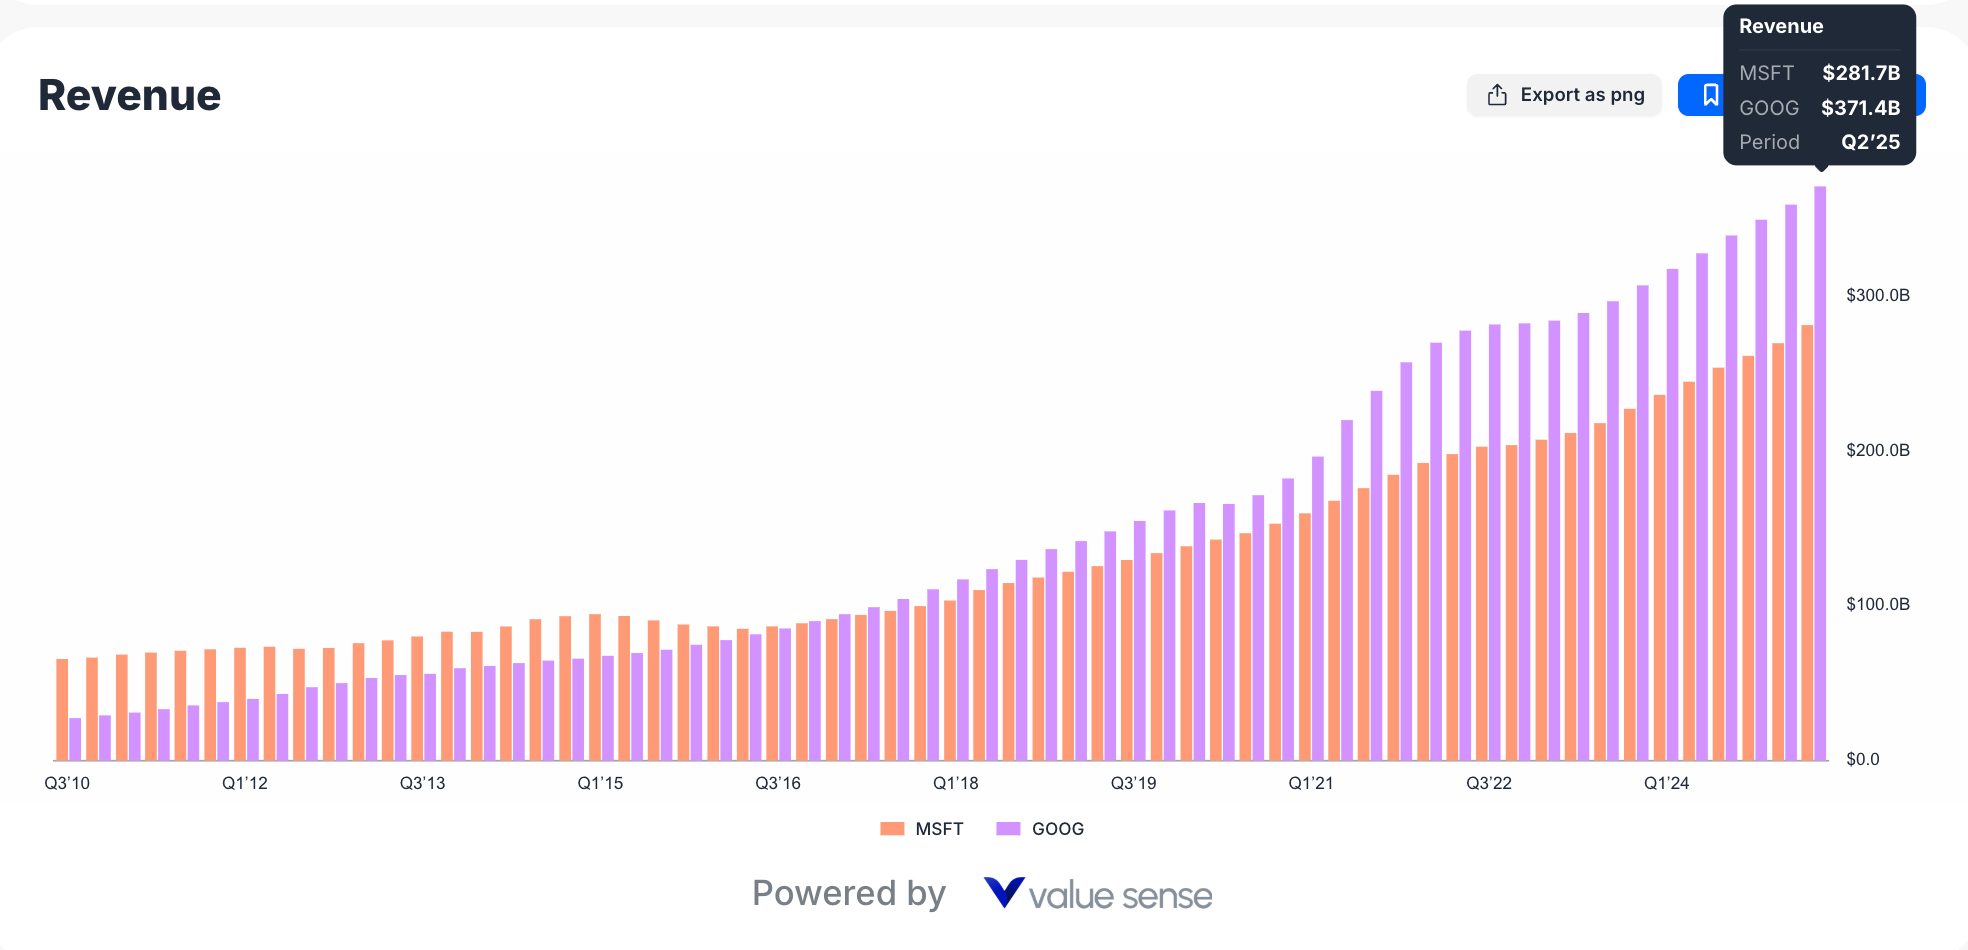
The revenue gap becomes even more intriguing when you consider the trajectory over recent quarters. Both companies have maintained impressive growth rates, but Google's advertising-driven model continues generating more absolute dollars despite Microsoft's diversified approach across cloud, productivity, and gaming segments.
Intrinsic Value Analysis: ValueSense Reveals Hidden Truths
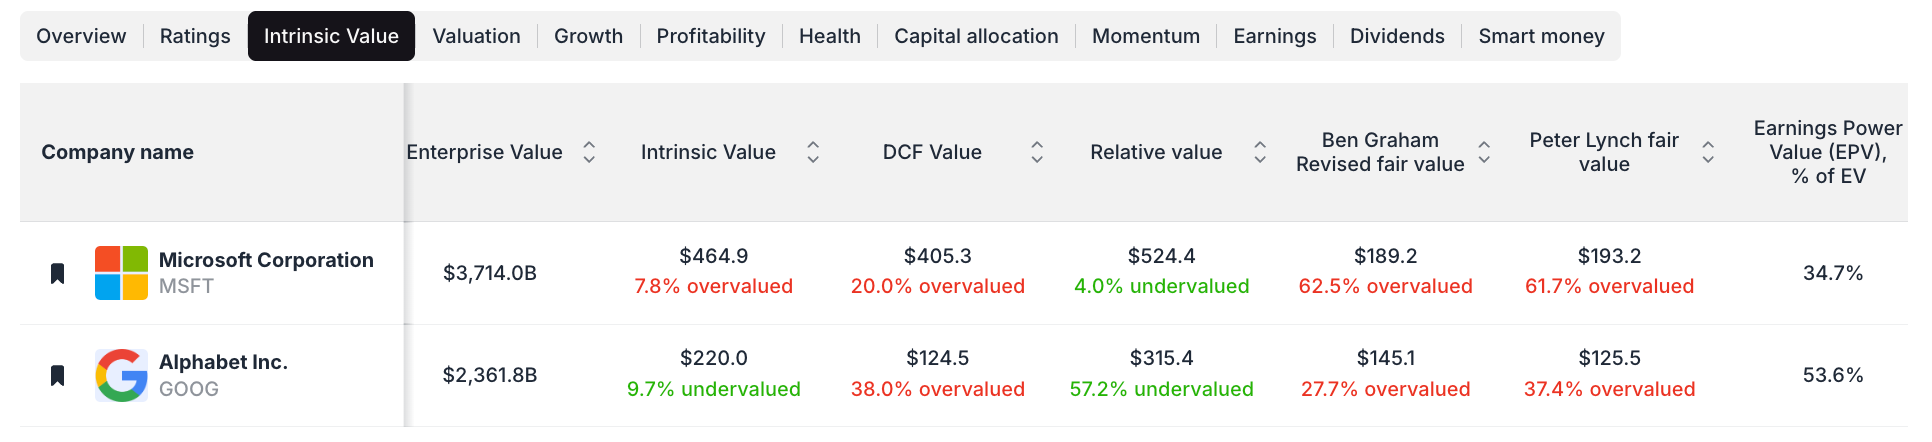
ValueSense's intrinsic value calculations provide fascinating insights into this undervalued tech comparison. Microsoft shows an intrinsic value of $464.9 per share, making it 7.8% overvalued at current prices. Meanwhile, Google's intrinsic value sits at $220.0 per share, indicating the stock trades 9.7% undervalued.
This initial analysis suggests Google holds the edge in pure value terms. However, experienced investors know that intrinsic value calculations can vary significantly based on methodology and assumptions. The devil, as always, lives in the details of discount rates, growth projections, and terminal value estimates.
What makes these calculations particularly compelling is their foundation in actual cash flow generation rather than speculative metrics. Both companies produce substantial free cash flow, but converting those streams into present value requires sophisticated modeling that ValueSense handles systematically.
DCF Analysis: Different Perspectives, Different Conclusions
The Discounted Cash Flow analysis reveals even more interesting dynamics. Microsoft's DCF value reaches $405.3, representing 20.0% overvaluation. Google's DCF value of $124.5 shows a substantial 38.0% overvaluation, completely flipping the initial intrinsic value narrative.
These contrasting results highlight why sophisticated investors use multiple valuation methods. Relying on a single metric, regardless of its sophistication, can lead to suboptimal investment decisions. The DCF model's sensitivity to terminal growth assumptions explains much of the variance between methodologies.
Professional money managers often weight different valuation approaches based on market conditions and company characteristics. Technology companies, with their rapid innovation cycles and scalable business models, present particular challenges for traditional DCF modeling.
Profitability Metrics: Where Microsoft Shines
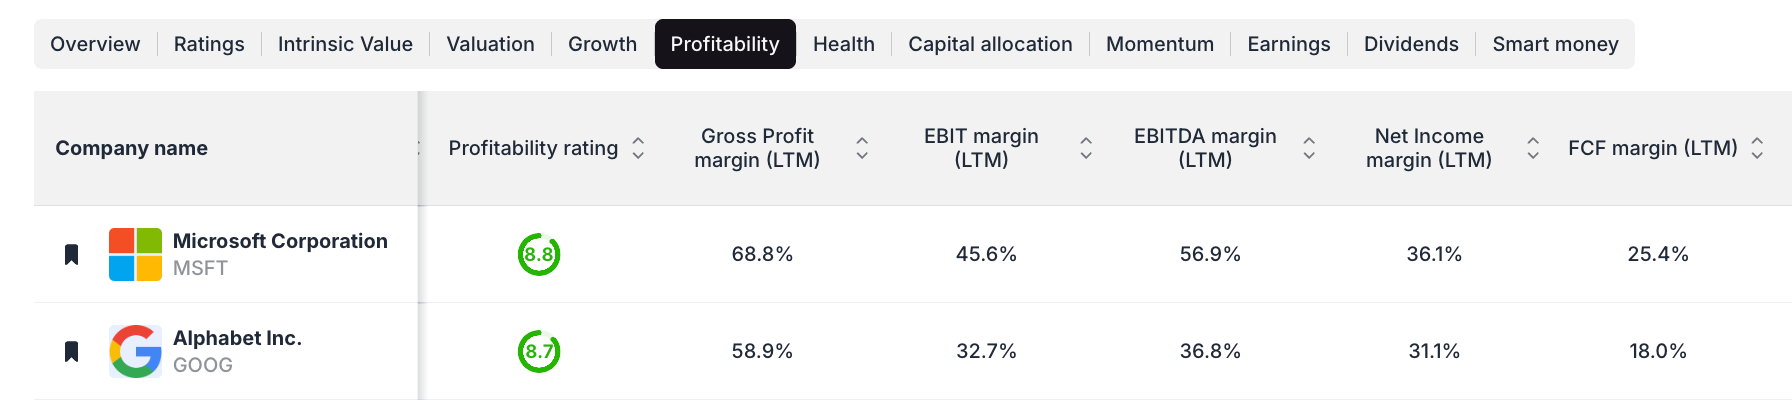
Microsoft's financial efficiency becomes apparent when examining profitability ratios. The company maintains superior free cash flow margins at 25.4% compared to Google's 18.0%. This 740 basis point advantage reflects Microsoft's ability to convert revenue into actual cash more effectively.
The margin difference stems largely from business model variations. Microsoft's subscription-based software generates predictable, high-margin revenue streams. Google's advertising model, while profitable, requires continuous investment in content acquisition, data centers, and algorithm development to maintain competitive positioning.
However, Google's higher absolute free cash flow yield of 2.7% versus Microsoft's 1.9% suggests investors receive better cash returns relative to their investment. This metric particularly appeals to income-focused value investors seeking immediate returns rather than long-term capital appreciation.
Valuation Multiples: The P/E Story
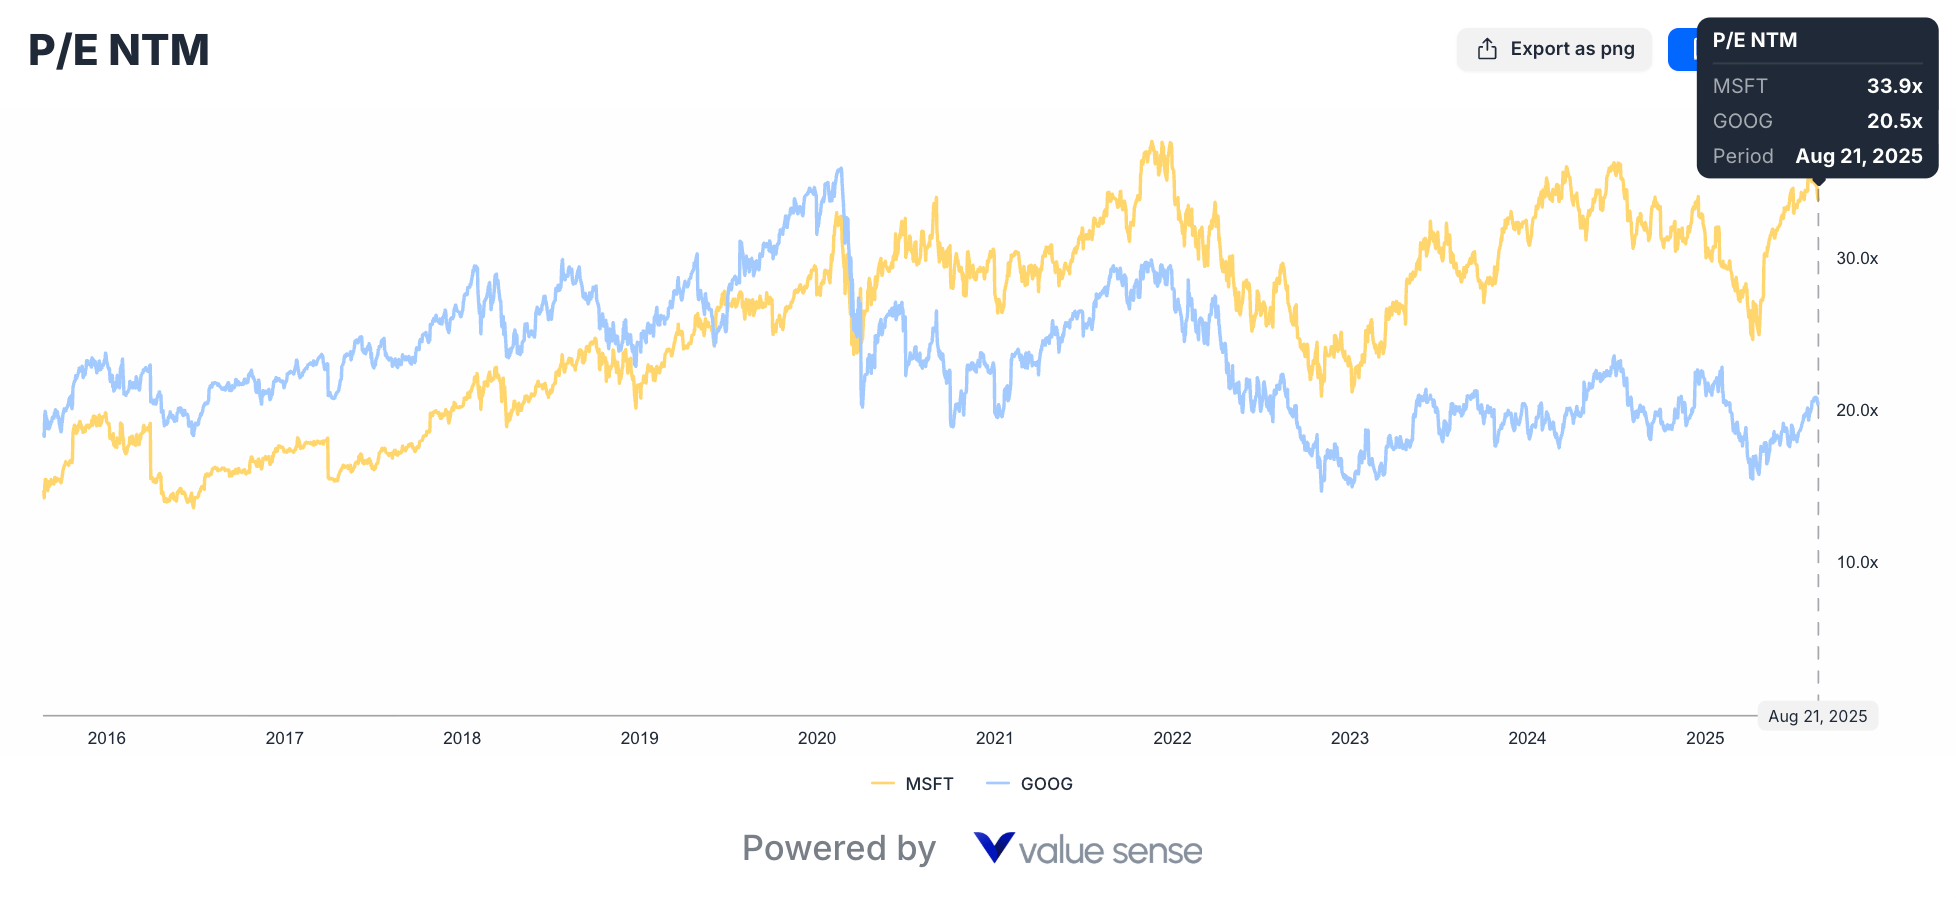
The P/E NTM comparison reveals Microsoft trading at 33.9x next twelve months earnings while Google commands 20.5x. This substantial 65% premium for Microsoft shares requires justification through superior growth prospects or business quality.
Historically, such valuation gaps between comparable companies either narrow through relative performance or reflect genuine fundamental differences. Understanding which scenario applies here determines the better value opportunity for patient investors.
Microsoft's premium reflects several factors: recurring revenue predictability, enterprise customer stickiness, and successful cloud transformation. Google's lower multiple might indicate market concerns about advertising headwinds, regulatory risks, or simply represent a value opportunity overlooked by momentum-focused investors.
The P/E differential has remained relatively stable over recent quarters, suggesting market participants view this gap as justified rather than temporary. This persistence makes the valuation spread particularly significant for contrarian investors seeking mispriced opportunities.
Growth Trajectory Analysis
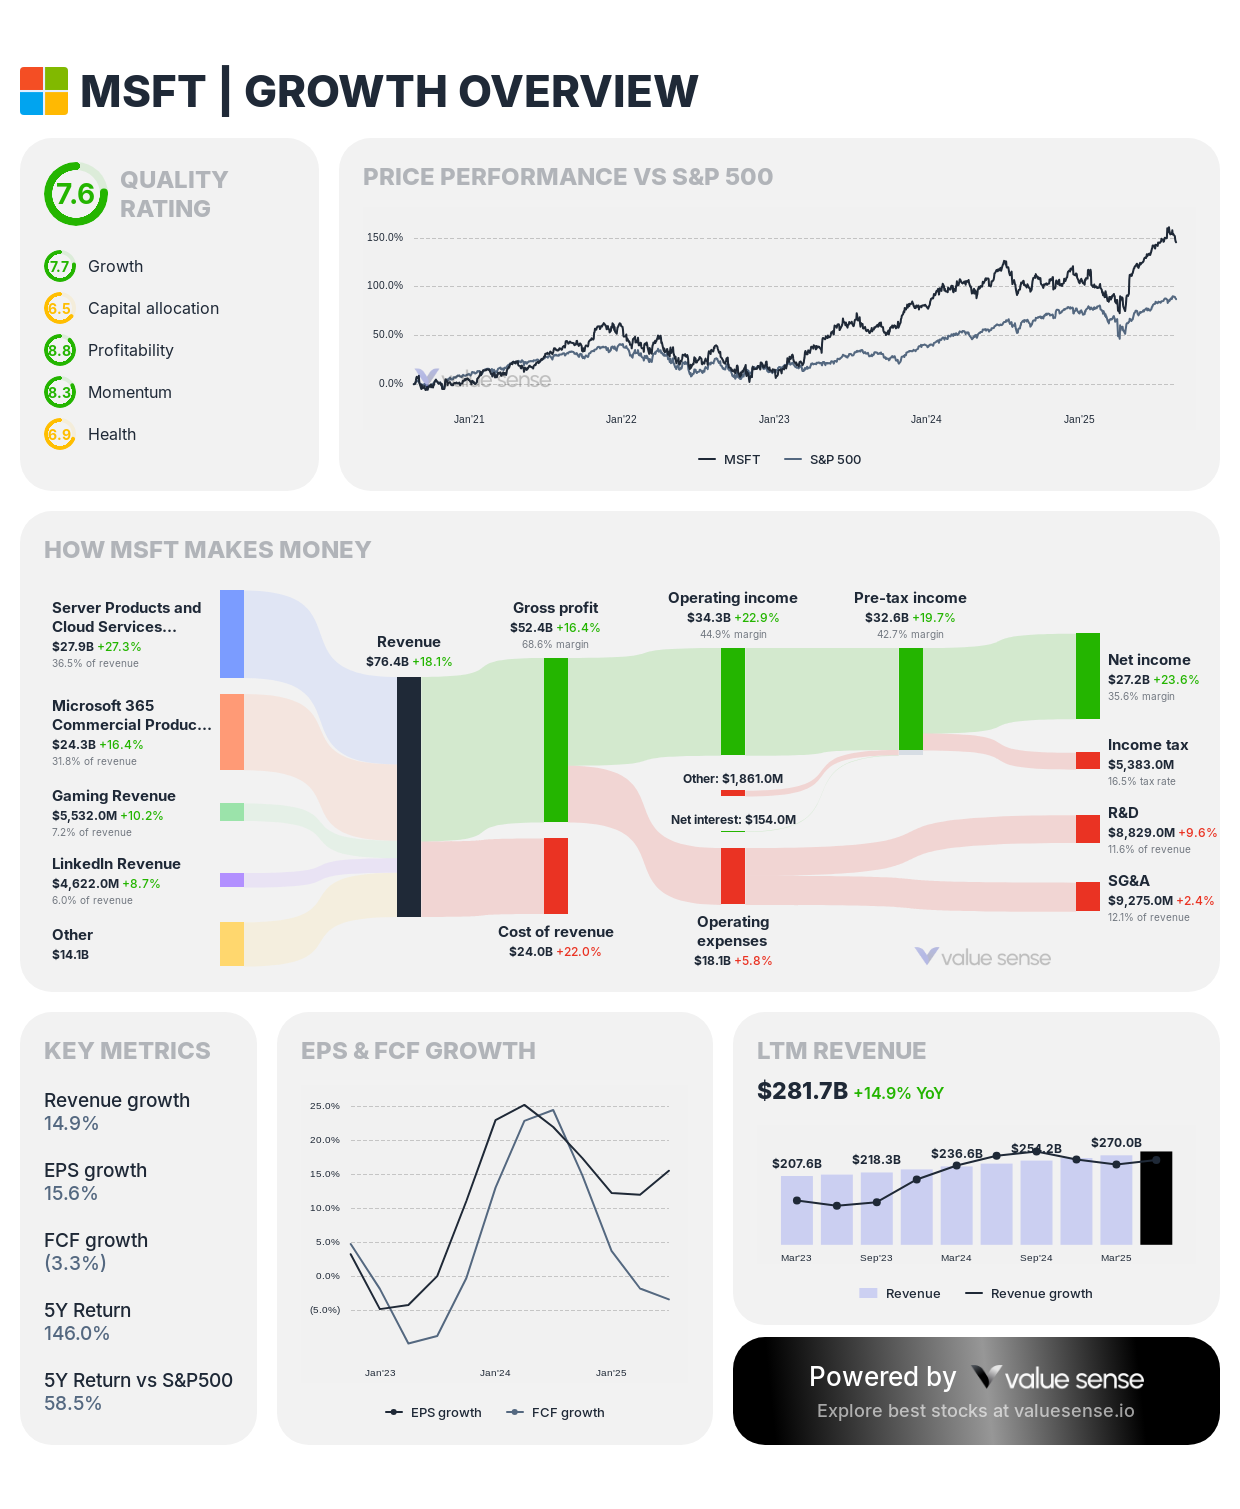
Revenue growth patterns show both companies maintaining impressive expansion despite their massive scale. Microsoft's diversified revenue streams across cloud computing, productivity software, and gaming provide stability during economic uncertainty.
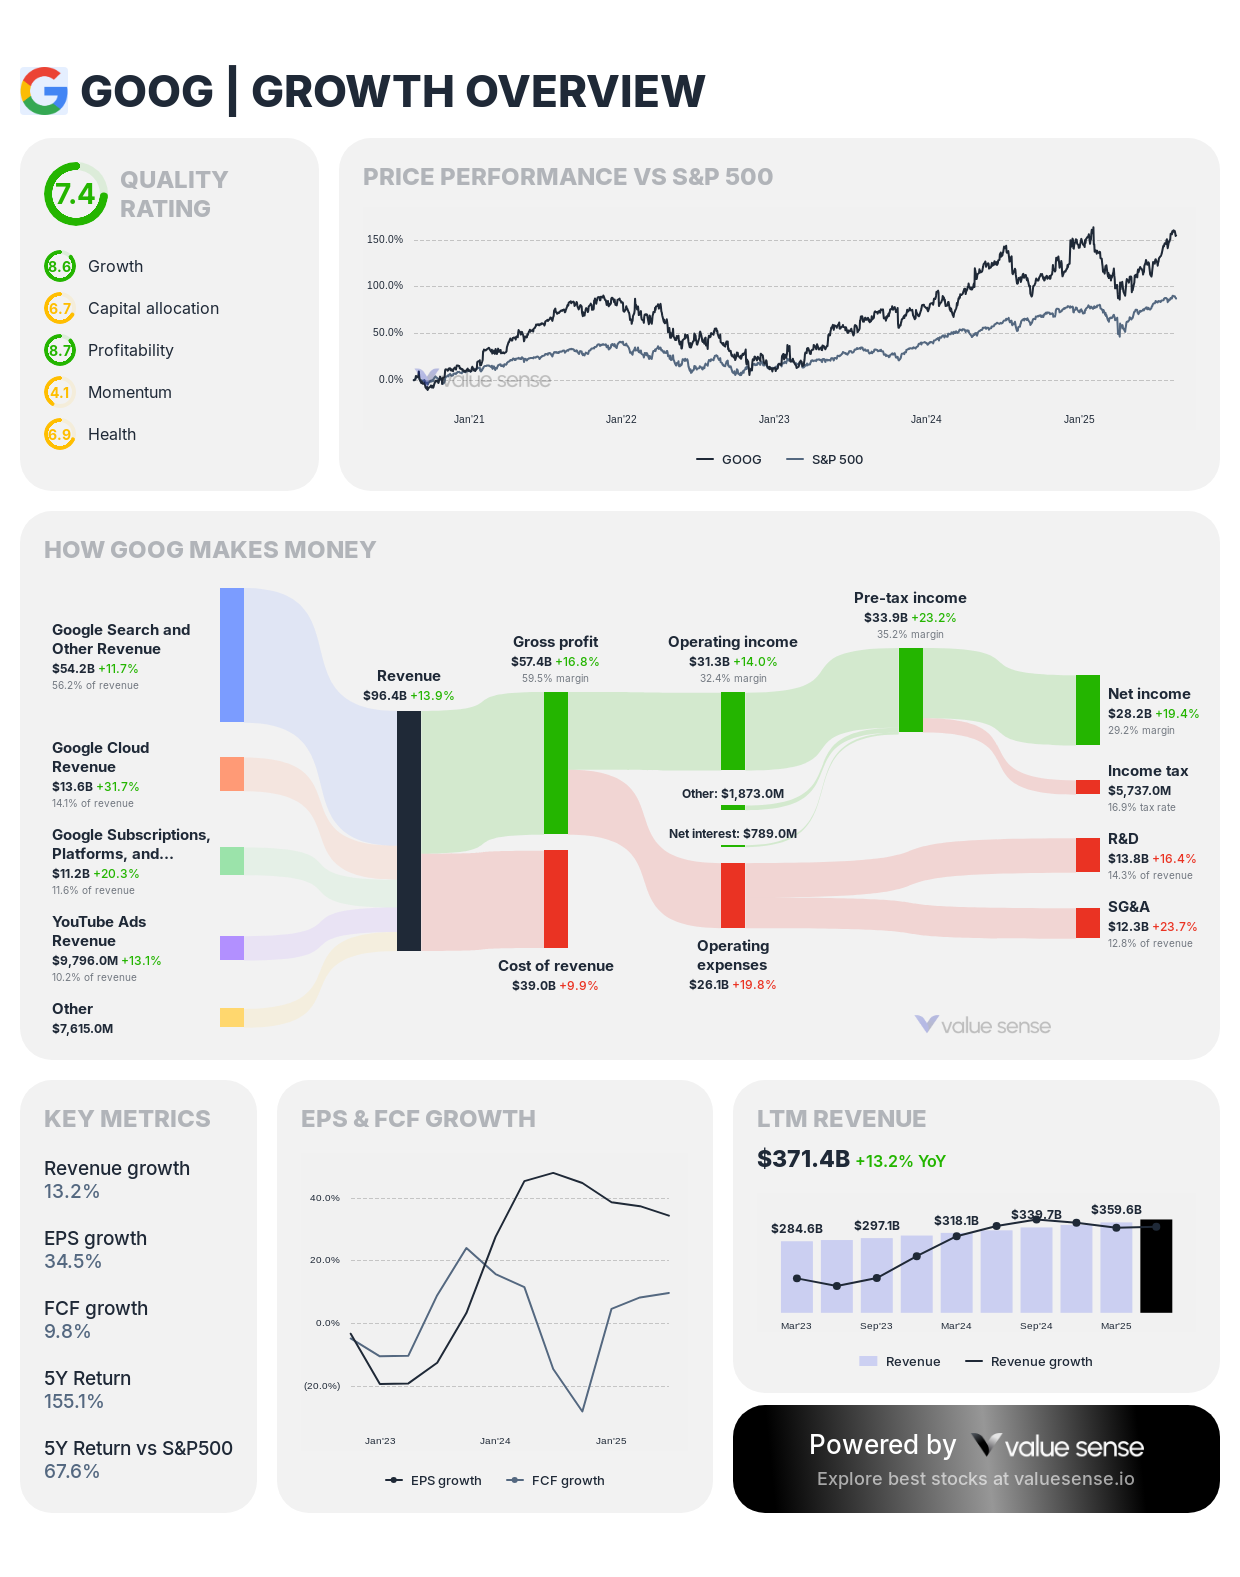
Google's advertising-dependent model, while historically lucrative, faces increasing regulatory scrutiny and privacy-driven headwinds. However, the company's investments in cloud infrastructure and artificial intelligence could offset traditional advertising challenges.
Market Share Dynamics
Microsoft's dominant position in enterprise software creates substantial switching costs and recurring revenue predictability. Google's search monopoly generates similar defensive characteristics, though regulatory risks pose potential threats to long-term sustainability.
MSFT VS GOOGL - Valuation Comparison
| Metric | Microsoft (MSFT) | Google (GOOGL) | Advantage |
|---|---|---|---|
| Market Cap | $3,748.0B | $2,421.4B | MSFT |
| Revenue (Q2'25) | $261.7B | $371.4B | GOOGL |
| P/E NTM | 33.9x | 20.5x | GOOGL |
| Free Cash Flow Margin | 25.4% | 18.0% | MSFT |
| FCF Yield LTM | 1.9% | 2.7% | GOOGL |
| Intrinsic Value Status | 7.8% Overvalued | 9.7% Undervalued | GOOGL |
| DCF Value | $405.3 (20.0% overvalued) | $124.5 (38.0% overvalued) | MSFT |
| Ben Graham Fair Value | $189.2 (62.5% overvalued) | $145.1 (27.7% overvalued) | GOOGL |
Risk Assessment: What Could Go Wrong?
Microsoft faces risks from cloud computing competition and potential enterprise spending slowdowns during economic downturns. The company's high valuation multiples leave little room for execution mistakes or market disappointment.
Google confronts more immediate regulatory challenges, particularly around antitrust concerns and privacy regulations. The company's advertising revenue concentration creates vulnerability to economic cycles and changing consumer behaviors.
Both companies must navigate artificial intelligence disruption carefully. While AI presents massive opportunities, it also threatens existing business models and requires substantial capital investment without guaranteed returns.
Investment Verdict: Context Matters
Based purely on current valuation metrics, Google appears more attractive for value-oriented investors. The company trades at lower multiples while generating higher absolute revenues, suggesting better risk-adjusted returns potential.
However, Microsoft's superior profitability margins and diversified revenue base justify some valuation premium. Investors willing to pay for quality and stability might find Microsoft's premium worthwhile despite current overvaluation signals.
The most prudent approach might involve position sizing based on conviction levels rather than choosing exclusively between these tech giants. Both companies possess competitive advantages that should drive long-term value creation, albeit through different paths.
Market timing considerations also matter significantly. Google's current undervaluation according to intrinsic value models suggests potential upside if the market recognizes this disconnect. Microsoft's overvaluation signals might indicate limited near-term appreciation potential unless fundamentals improve substantially.
Explore More Investment Opportunities
For investors seeking undervalued companies with high fundamental quality, our analytics team provides curated stock lists:
📌 50 Undervalued Stocks (Best overall value plays for 2025)
📌 50 Undervalued Dividend Stocks (For income-focused investors)
📌 50 Undervalued Growth Stocks (High-growth potential with strong fundamentals)
🔍 Check out these stocks on the Value Sense platform for free!
More Articles You Might Like
📖 Rule of 40 Stocks August 2025: Best Growth-Efficiency Plays
📖 Rule of 40 Explained: The Ultimate SaaS Stock Analysis Guide
📖 Tesla Stock Forecast: Is TSLA Undervalued or Overvalued?
FAQ about Microsoft VS Google
Q: Is Microsoft or Google more undervalued based on current metrics?
A: According to ValueSense intrinsic value analysis, Google appears 9.7% undervalued while Microsoft shows 7.8% overvaluation. However, DCF analysis suggests both companies trade above fair value, with different degrees of overvaluation depending on methodology. Google's lower P/E ratio of 20.5x versus Microsoft's 33.9x also suggests better relative value.
Q: Why does Microsoft command a higher P/E ratio than Google?
A: Microsoft's 33.9x P/E NTM versus Google's 20.5x reflects market confidence in Microsoft's diversified business model, recurring revenue streams, and superior profit margins at 25.4% versus Google's 18.0%. Investors pay premium for perceived stability and growth predictability in enterprise software markets.
Q: Which company generates better cash flow returns for investors?
A: Google offers higher free cash flow yield at 2.7% compared to Microsoft's 1.9%, meaning investors receive more cash return per dollar invested. However, Microsoft maintains higher free cash flow margins at 25.4% versus Google's 18.0%, indicating better operational efficiency in converting sales to cash.
Q: How reliable are intrinsic value calculations for these mega-cap stocks?
A: Intrinsic value models provide useful frameworks but require careful interpretation for large technology companies. Multiple methodologies often yield different results due to varying assumptions about growth rates, discount rates, and terminal values. ValueSense's approach using multiple valuation methods helps provide more comprehensive analysis than single-metric approaches.
Q: Should investors choose between Microsoft and Google or own both?
A: Diversification across both companies might offer optimal risk-adjusted returns. Each company faces different challenges and opportunities, making combined exposure potentially superior to concentrated positions in either stock alone. Consider weighting based on individual risk tolerance and valuation preferences rather than making binary choices.