ValueSense features - Overview templates
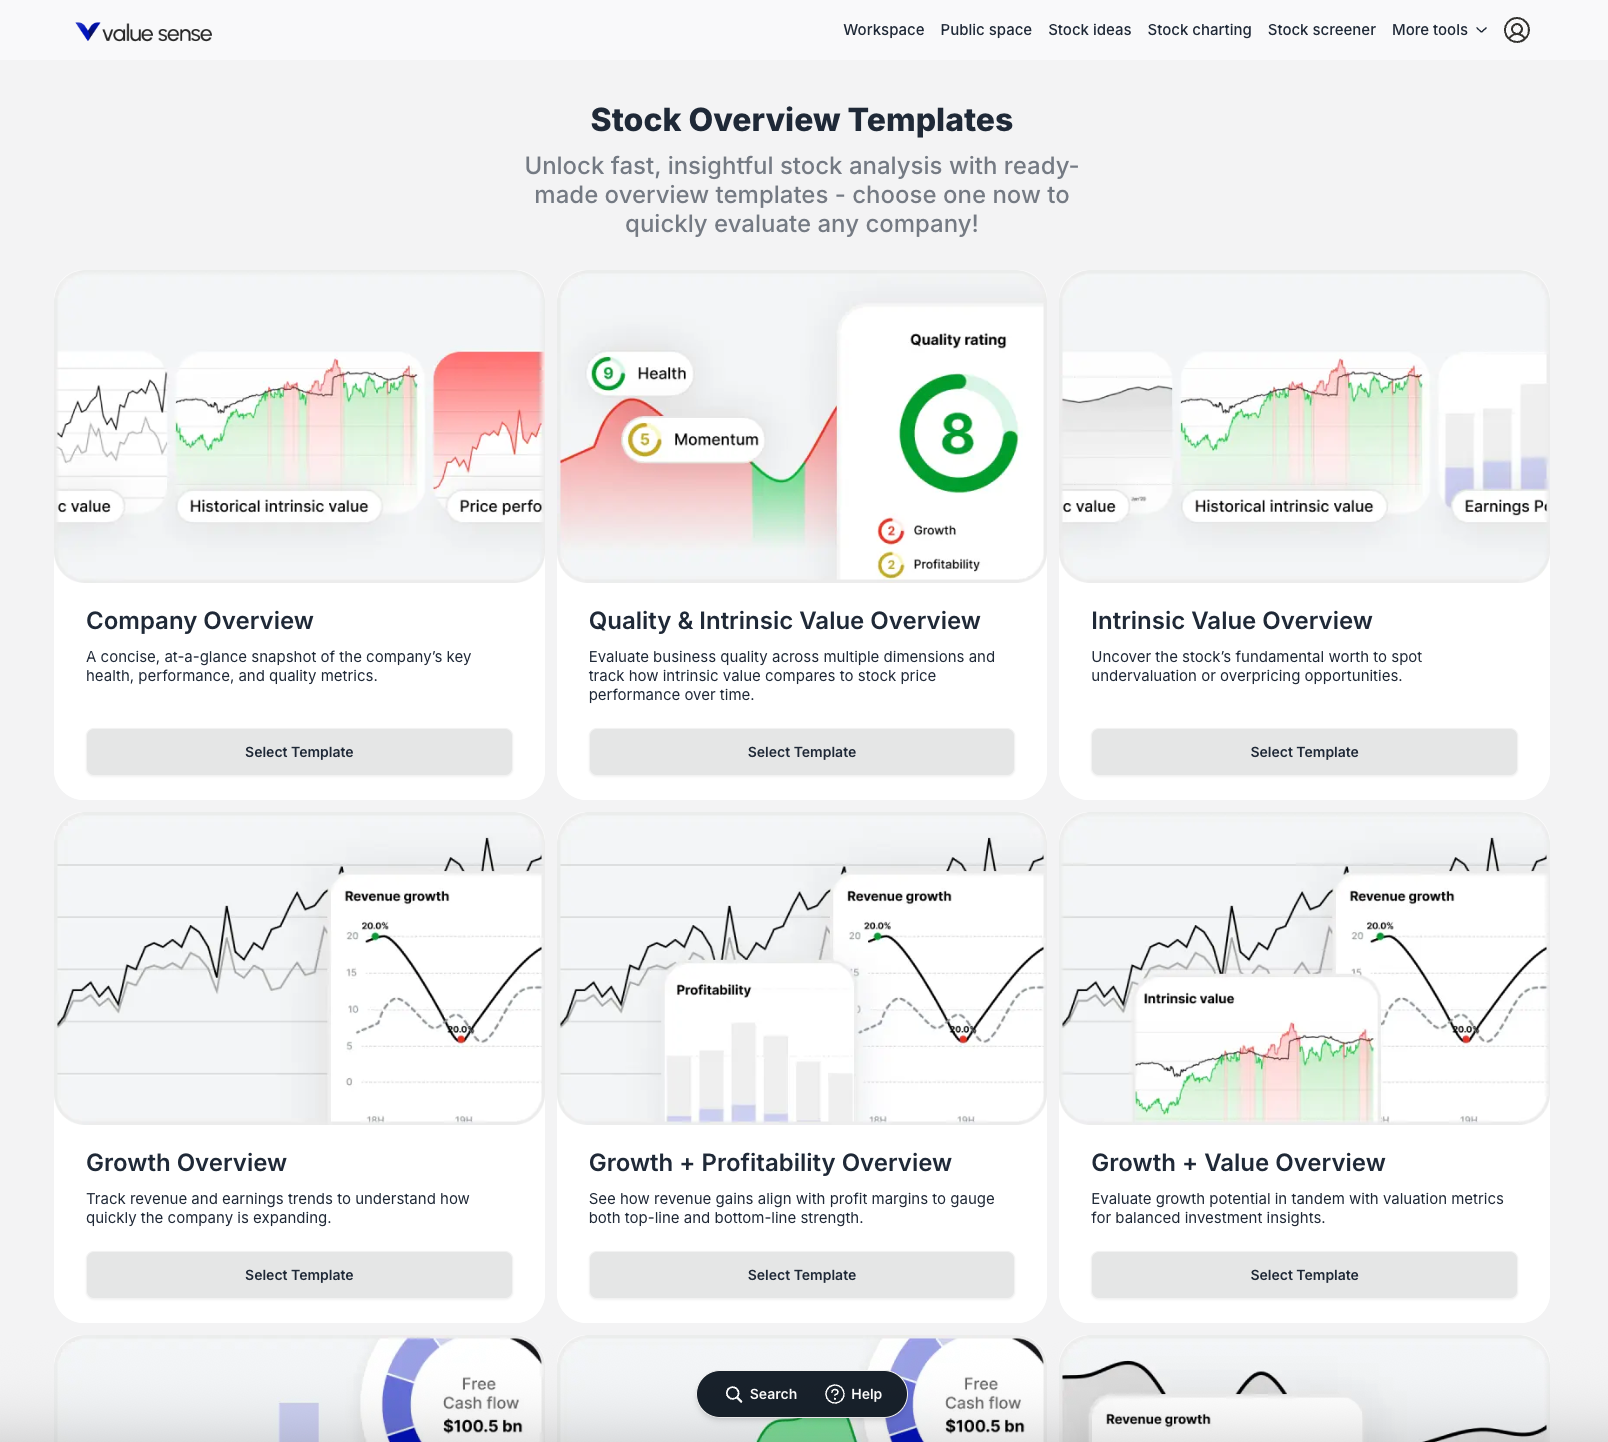
Overview Templates unlock fast, insightful stock analysis with ready-made analytical frameworks that help you quickly evaluate any company. Instead of building dashboards from scratch, you can select from a comprehensive library of curated templates, each focusing on different aspects of financial analysis to provide instant, professional-quality company reports.
Accessing Overview Templates
From the Main Navigation
- Hover over "More tools" in the main navigation bar
- Click "Overview templates" from the dropdown menu
- Access the template gallery with all available analytical frameworks

What Overview Templates Do
Core Purpose
Overview Templates automatically generate comprehensive, visually-rich, one-page summary reports on any publicly traded company using pre-defined analytical frameworks. This saves significant time in gathering and visualizing key data points while ensuring consistent, professional analysis.
Key Benefits
- Speed and Efficiency: Condenses hours of research into digestible, shareable pages
- Professional Quality: Institutional-grade analysis and visualization
- Comprehensive Coverage: Multiple analytical perspectives for complete company assessment
- Interactive Experience: Dynamic charts and data exploration capabilities
Available Template Library
Investment Analysis Templates
- Company Overview: Complete 360-degree company assessment
- Quality & Intrinsic Value Overview: Combined quality metrics and valuation analysis
- Intrinsic Value Overview: Focused valuation and fair value assessment
- Growth Overview: Growth trends and future potential analysis
- Growth + Profitability Overview: Combined growth and margin analysis
- Growth + Value Overview: Growth opportunities at attractive valuations
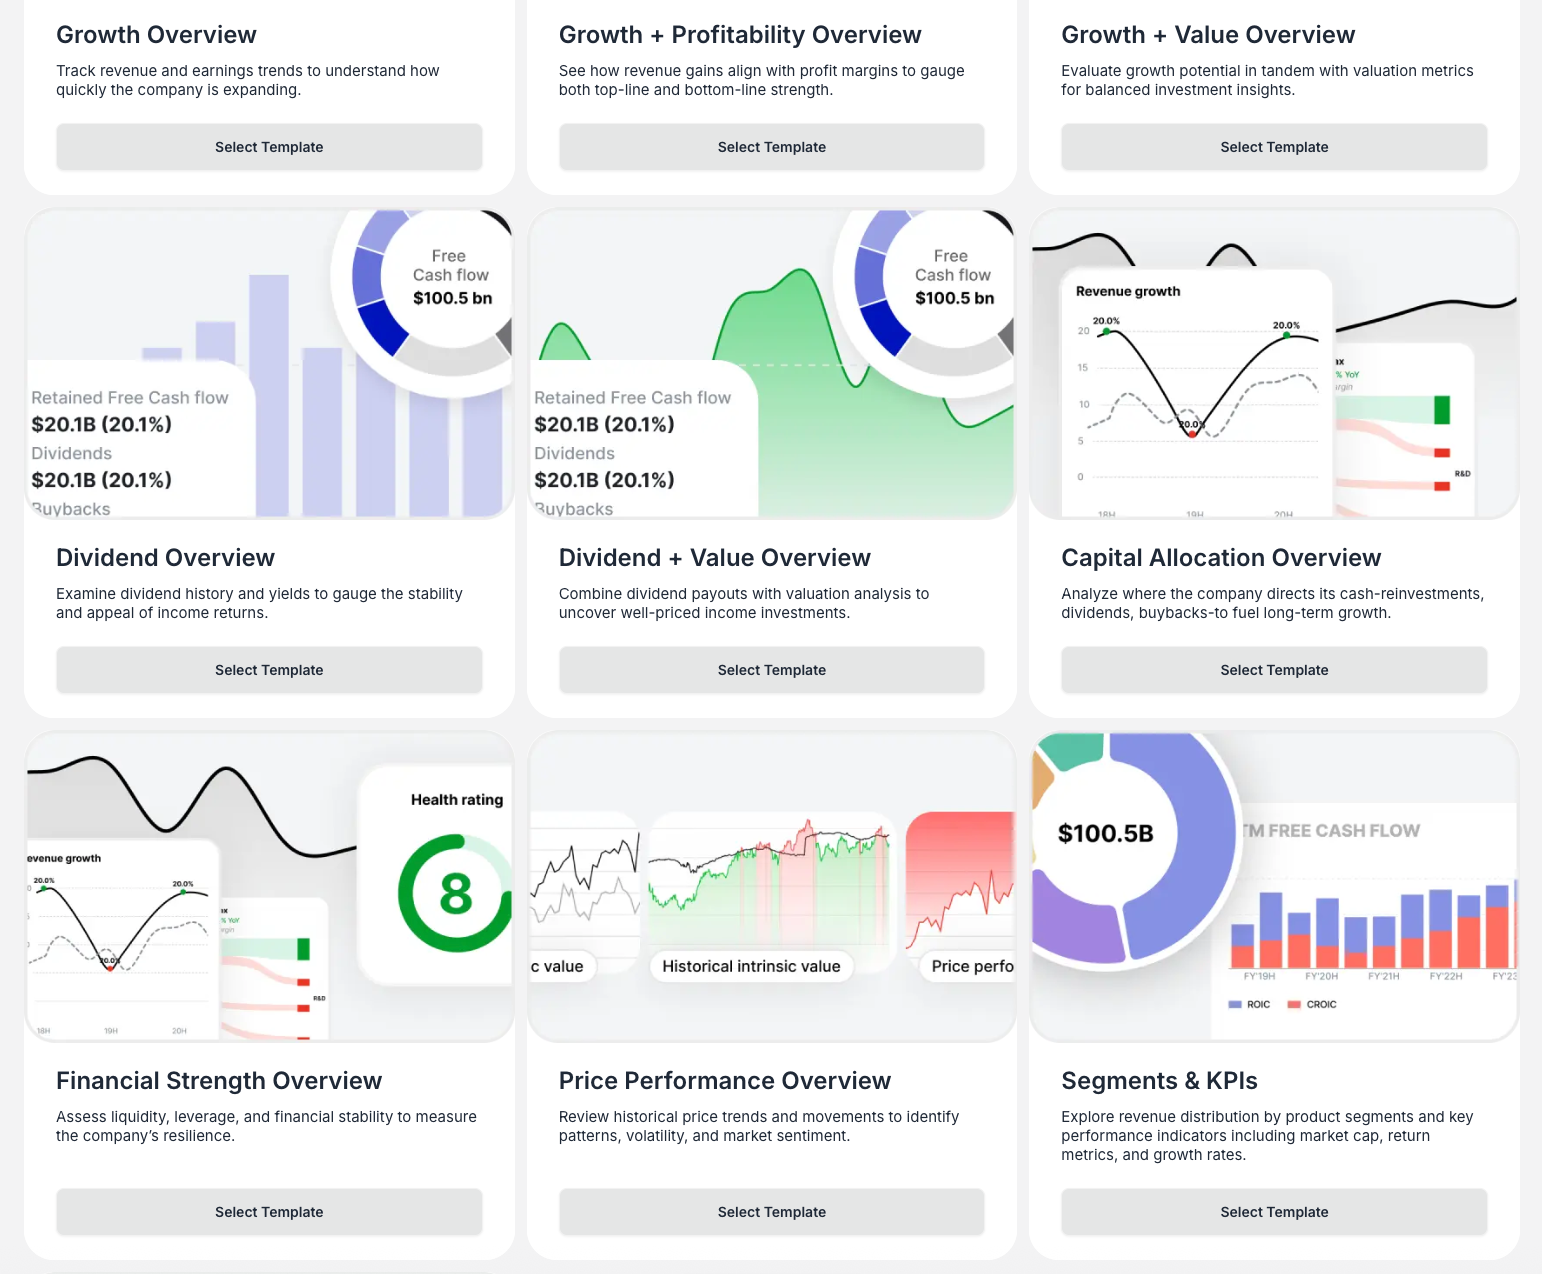
Income & Dividend Templates
- Dividend Overview: Dividend history, yield, and sustainability analysis
- Dividend + Value Overview: Income investing with valuation considerations
Operational & Financial Templates
- Capital Allocation Overview: Management efficiency and capital deployment
- Financial Strength Overview: Balance sheet health and stability analysis
- Segments & KPIs: Revenue breakdown and key performance indicators
- Revenue Breakdown: Detailed revenue composition and trends
Performance Templates
- Price Performance Overview: Stock performance vs. benchmarks
- Investing Visuals: Summary: Key investment metrics visualization
How to Use Templates
Method 1: Starting from Template Gallery
- Browse Templates: Navigate to the "Stock Overview Templates" page
- Preview Templates: Hover over template cards to see animated previews
- Select Template: Click "Select Template" on your desired framework
- Choose Company: Search for and select a company from the modal window
- Generate Report: Automatically creates comprehensive analysis
Method 2: Switching Templates on Existing Reports
- Use Template Dropdown: Click the "Template" dropdown at the top of any report
- Select New Framework: Choose different analytical perspective
- Dynamic Loading: Page content updates to match new template
- Maintain Context: Company selection remains consistent across template changes
Template Content and Analysis
Company Overview Template Features
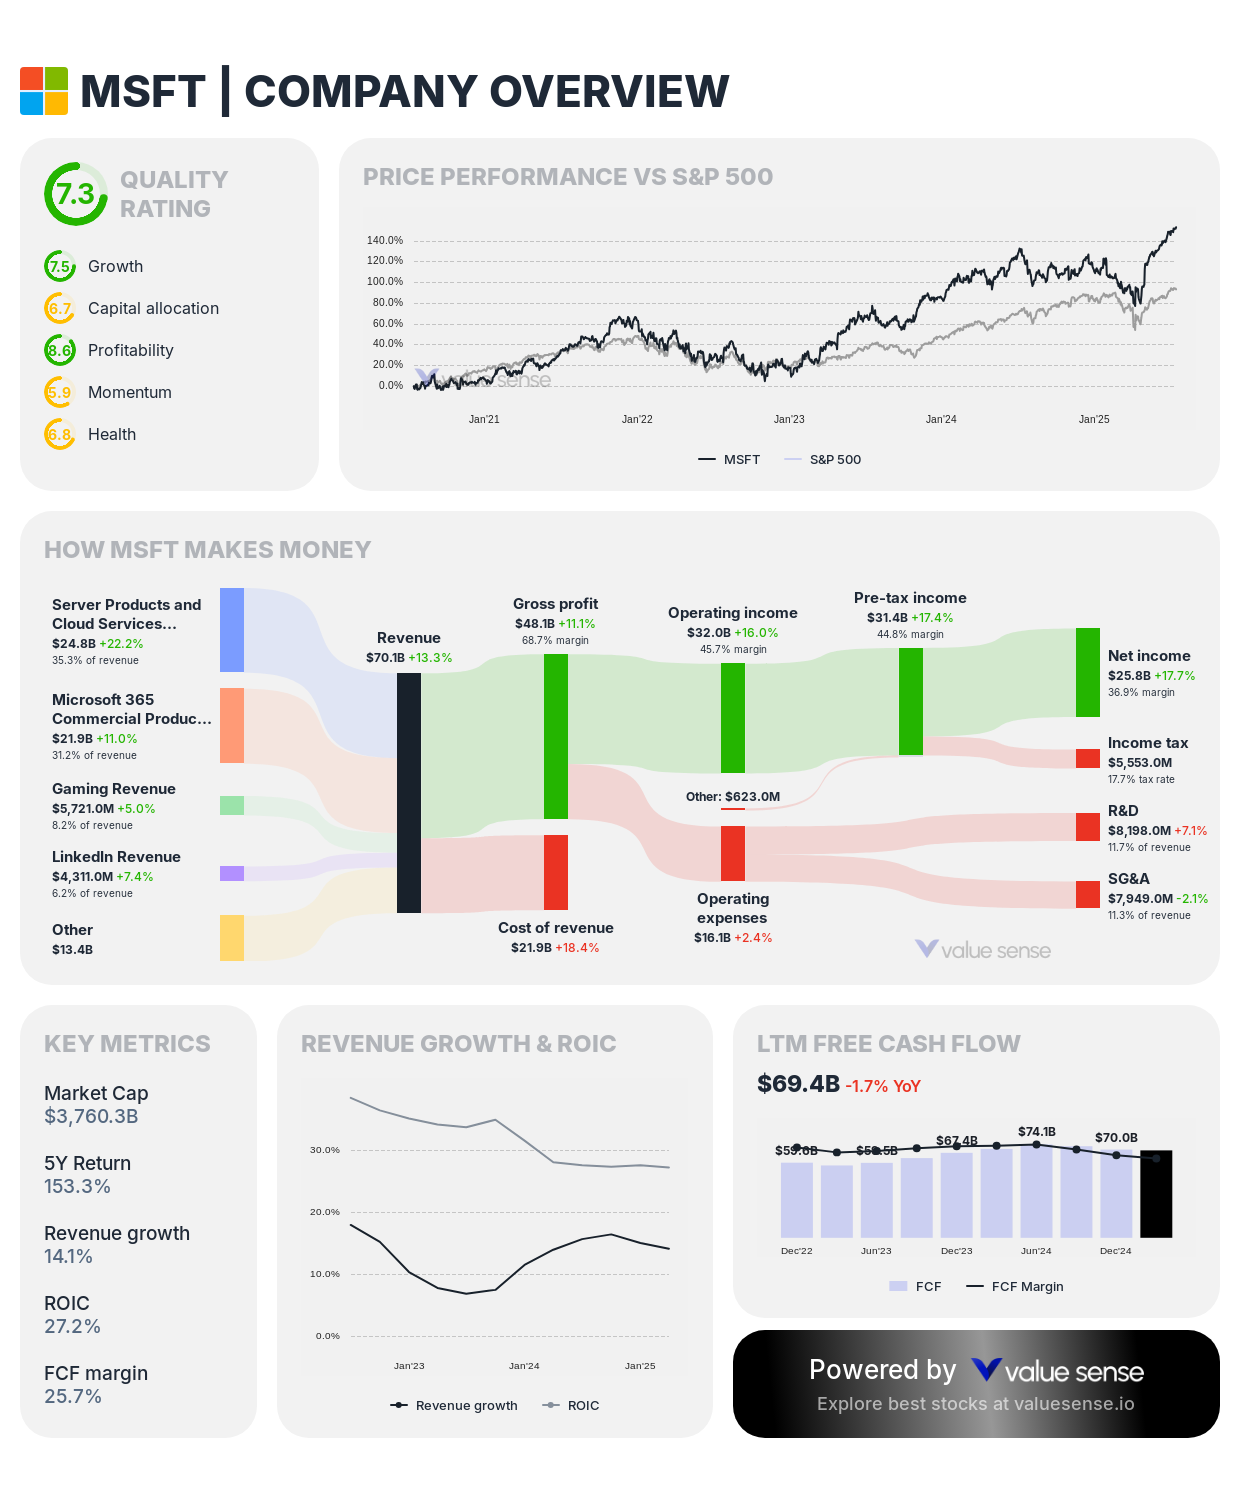
- Quality Rating: Numerical score (e.g., 7.3) with sub-ratings for Growth, Capital Allocation, Profitability, Momentum, and Health
- Price Performance vs S&P 500: Line chart comparing stock performance against benchmark
- How [Company] Makes Money: Sankey diagram showing revenue flow from segments to net income
- Key Metrics: Market Cap, 5Y Return, Revenue growth, ROIC, FCF margin
- Revenue Growth & ROIC: Historical performance trends
- LTM Free Cash Flow: Cash generation analysis
Segments & KPIs Template Features
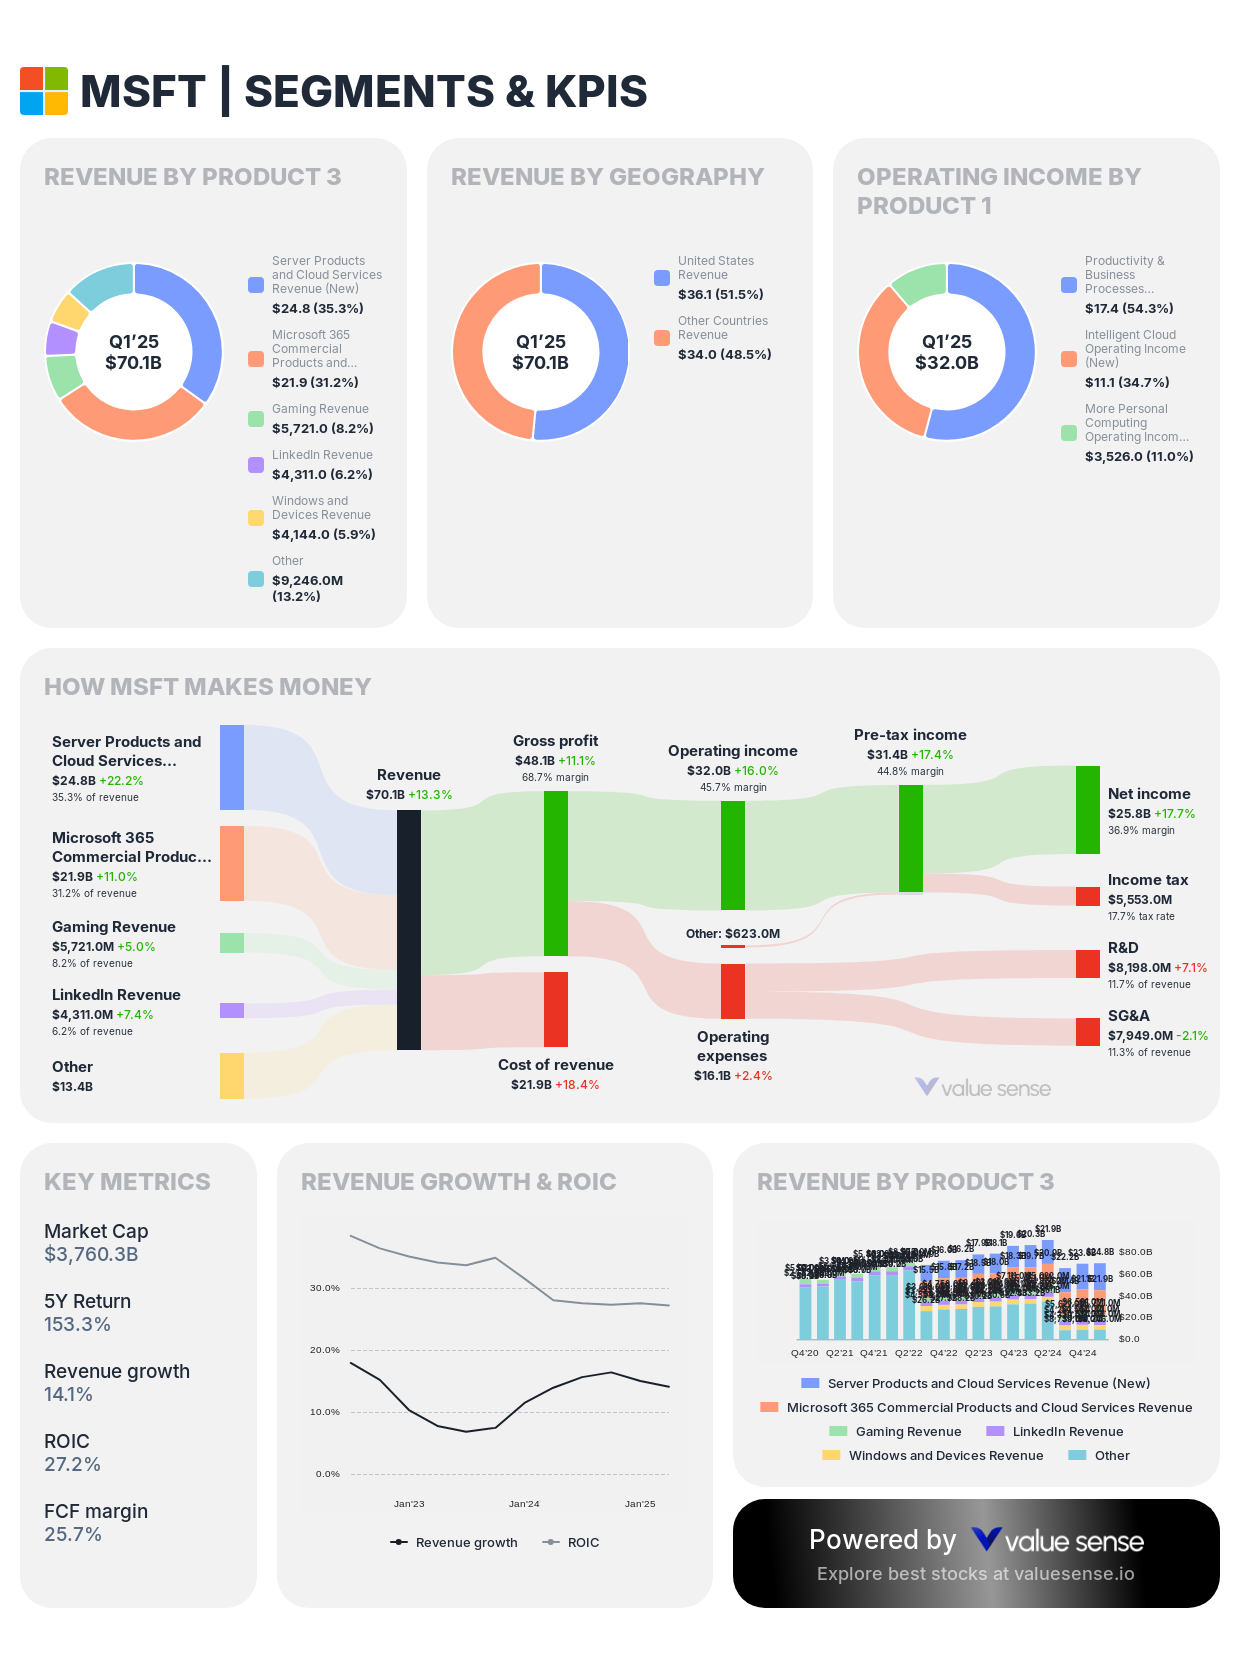
- Revenue by Product: Donut chart showing revenue breakdown by business segment
- Revenue by Geography: Geographic revenue distribution analysis
- Operating Income by Product: Profit breakdown by business unit
- Key Performance Indicators: Segment-specific metrics and trends
Interactive Features
Template Gallery Experience
- Animated Previews: Hover over template cards to see content previews
- Visual Selection: Choose templates based on actual report appearance
- Clear Categorization: Templates organized by analytical focus
Company Search Functionality
- Dynamic Search: Results update as you type
- Popular Tickers: Quick access to commonly analyzed companies
- Clear Feedback: "Nothing found" messages and clear buttons
- Efficient Selection: Streamlined company selection process
Interactive Reports
- Hover for Details: Mouse over charts to see specific data points and dates
- Loading States: "Crunching data... Almost there!" progress indicators
- Download Capability: Export reports for presentations or archival
- Template Switching: Quick pivot between analytical perspectives
Key Workflow Steps
Step 1: Access and Browse
Navigate to Overview Templates and explore available analytical frameworks
Step 2: Select Template
Choose the template that matches your analysis needs and investment focus
Step 3: Choose Company
Search for and select the company you want to analyze
Step 4: Analyze Report
Review the generated comprehensive report with interactive charts and data
Step 5: Refine Analysis
Use template dropdown to switch analytical perspectives for the same company
Step 6: Export and Share
Download reports for presentations, investment meetings, or personal archives
Use Cases and Applications
Initial Due Diligence
- Company Overview: Get comprehensive understanding of new stock ideas
- Quality Assessment: Evaluate company fundamentals and investment quality
- Quick Screening: Rapidly assess multiple investment opportunities
Thesis-Driven Analysis
- Growth Focus: Use Growth Overview for companies with expansion potential
- Income Investing: Apply Dividend Overview for income-focused strategies
- Value Investing: Utilize Intrinsic Value templates for undervalued opportunities
- Segment Analysis: Employ Segments & KPIs for complex, diversified companies
Reporting and Communication
- Investment Presentations: Professional reports for meetings and presentations
- Team Collaboration: Share consistent analysis across investment teams
- Personal Archives: Maintain research records with standardized format
Best Practices
Template Selection
- Match Analysis Goals: Choose templates that align with your investment thesis
- Consider Company Type: Select frameworks appropriate for company characteristics
- Multiple Perspectives: Use different templates for comprehensive analysis
Report Analysis
- Interactive Exploration: Use hover functionality to examine specific data points
- Comparative Analysis: Switch templates to see different analytical angles
- Context Consideration: Understand industry and market context for metrics
Workflow Optimization
- Start with Overview: Begin with Company Overview for comprehensive assessment
- Drill Down: Use specialized templates for focused analysis
- Export Strategically: Download reports for important investment decisions
Key Features to Highlight
Animated Template Previews
- Visual Selection: See actual report content before committing
- Informed Choice: Understand template value before selection
- Efficient Browsing: Quickly evaluate multiple analytical frameworks
Sankey Diagram Visualization
- Unique Feature: "How [Company] Makes Money" flow visualization
- Revenue Transparency: Clear understanding of business model
- Competitive Differentiator: Standout visualization not commonly available
On-the-Fly Template Switching
- Convenient Analysis: Pivot analytical perspective without re-selecting company
- Efficient Workflow: Maintain context while changing focus
- Comprehensive Assessment: Easy access to multiple analytical angles
Download and Export
- Professional Reports: Export analysis for presentations and meetings
- Archive Capability: Maintain research records over time
- Sharing Functionality: Distribute analysis to team members or clients
Overview Templates transform complex financial analysis into accessible, professional-quality reports that can be generated in minutes rather than hours, making sophisticated investment research available to investors at all levels.