
Palantir Rule of 40 Analysis: AI Data Giant's Growth Efficiency Reaches Record 94%
Welcome to the Value Sense Blog, your resource for insights on the stock market! At Value Sense, we focus on intrinsic value tools and offer stock ideas with undervalued companies. Dive into our research products and learn more about our unique approach at valuesense.io
Explore diverse stock ideas covering technology, healthcare, and commodities sectors. Our insights are crafted to help investors spot opportunities in undervalued growth stocks, enhancing potential returns. Visit us to see evaluations and in-depth market research.
Palantir Technologies (NASDAQ: PLTR) has achieved something remarkable in the software industry – a Rule of 40 score of 94% in Q2 2025, obliterating the benchmark that most companies struggle to reach. This comprehensive Palantir Rule of 40 analysis examines how the AI data giant has transformed from a growth-at-all-costs company into an efficiency powerhouse that's redefining what's possible in AI stocks efficiency.
For growth software companies, achieving a Rule of 40 score above 40% is considered excellent. Palantir's 94% score represents a level of operational excellence that's virtually unprecedented in the technology sector, combining explosive revenue growth with expanding profit margins in a way that demonstrates true business model superiority.
Understanding the Rule of 40: The Ultimate SaaS Efficiency Metric
The Rule of 40 is a fundamental metric for evaluating software companies, calculated by adding the year-over-year revenue growth rate to the adjusted operating margin. This simple formula reveals whether a company is balancing growth and profitability effectively:
Rule of 40 = Revenue Growth Rate + Adjusted Operating Margin
A score above 40% indicates strong performance, while scores above 60% are considered exceptional. Palantir's 94% PLTR Rule of 40 score places it in a category of its own among public software companies.
Palantir's Rule of 40 Journey: ValueSense Dashboard Analysis
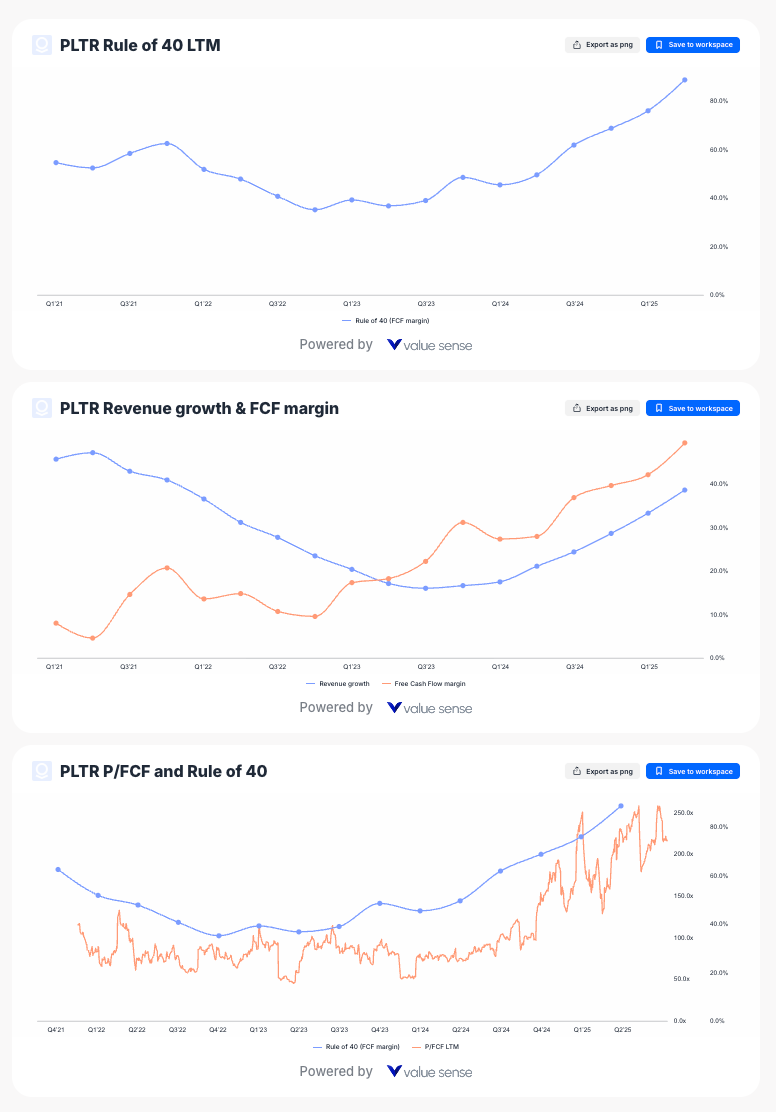
The ValueSense dashboard data reveals the remarkable transformation in Palantir's operational efficiency over the past four years. The Rule of 40 LTM (Last Twelve Months) chart shows a dramatic recovery story that few technology companies have achieved.
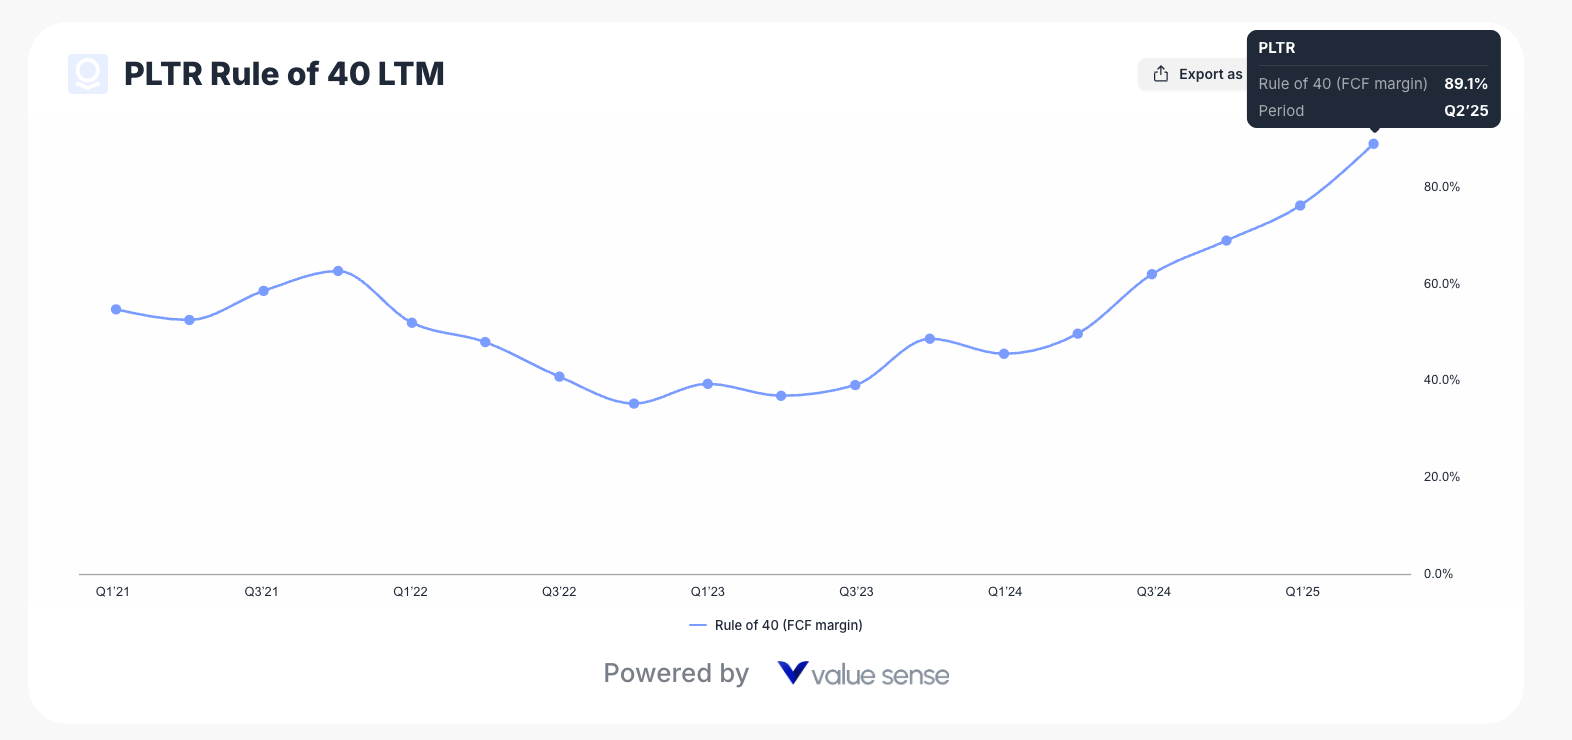
The Great Turnaround: From 35% to 89% Rule of 40
The ValueSense Rule of 40 LTM chart reveals several critical phases in Palantir's evolution:
Phase 1 (Q1 2021 - Q3 2022): The Efficiency Valley
- Rule of 40 declined from approximately 55% to a trough of around 35%
- This period reflected high growth with negative or minimal margins
- Typical of early-stage high-growth software companies prioritizing market capture
Phase 2 (Q4 2022 - Q2 2024): The Steady Climb
- Consistent improvement from the Q3 2022 low point
- Rule of 40 gradually increased to approximately 60%
- Demonstrated management's focus on operational efficiency
Phase 3 (Q3 2024 - Q2 2025): The Acceleration
- Dramatic improvement from 60% to 89.1% in just two quarters
- Shows the inflection point where platform scalability became evident
- Reflects the AI boom's impact on Palantir's business model
Revenue Growth and FCF Margin: The Dual Engine of Success
The ValueSense dashboard provides crucial insights into how Palantir achieved its exceptional Rule of 40 performance through the synchronized improvement of both revenue growth and free cash flow margins.
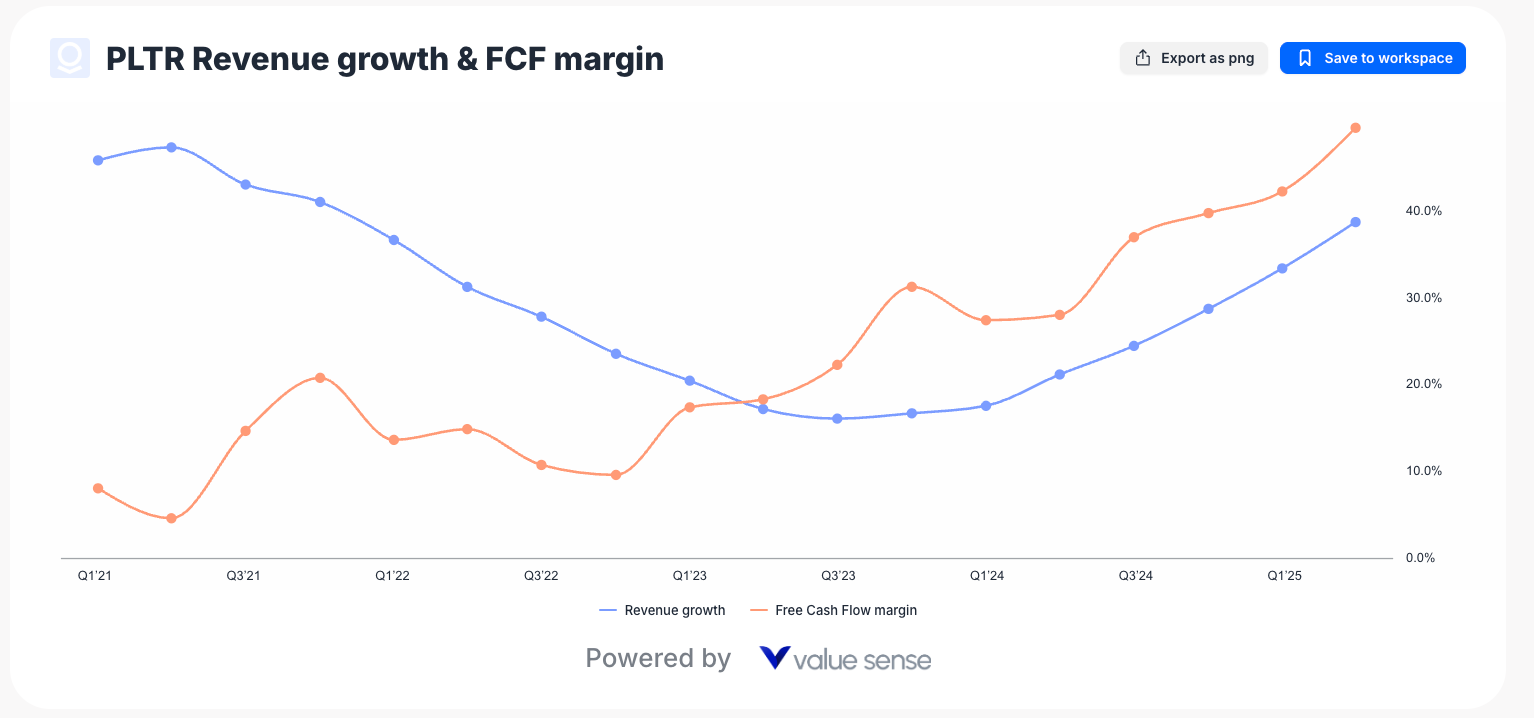
The Perfect Storm: 38.8% Growth + 49.7% FCF Margin
As of Q2 2025, the ValueSense data shows:
- Revenue Growth: 38.8% (blue line)
- Free Cash Flow Margin: 49.7% (orange line)
This combination is particularly impressive because it demonstrates:
- Sustainable Growth: 38.8% revenue growth at $1+ billion scale is exceptional
- Margin Expansion: 49.7% FCF margin shows incredible operational leverage
- Business Model Maturity: Both metrics improving simultaneously
Historical Context: The Inverse Relationship Reversal
The dashboard reveals a fascinating pattern from Q1 2021 to Q1 2023:
- Revenue growth started high (~45%) but declined to ~17%
- FCF margins were initially low (~8%) but steadily improved
- Classic inverse relationship as the company prioritized profitability over growth
The inflection point came in Q1 2023, when both metrics began improving together – a rare achievement that signals true business model superiority.
Market Valuation Correlation: P/FCF and Rule of 40 Relationship
The ValueSense P/FCF and Rule of 40 correlation chart provides crucial insights into how the market has valued Palantir's improving efficiency.
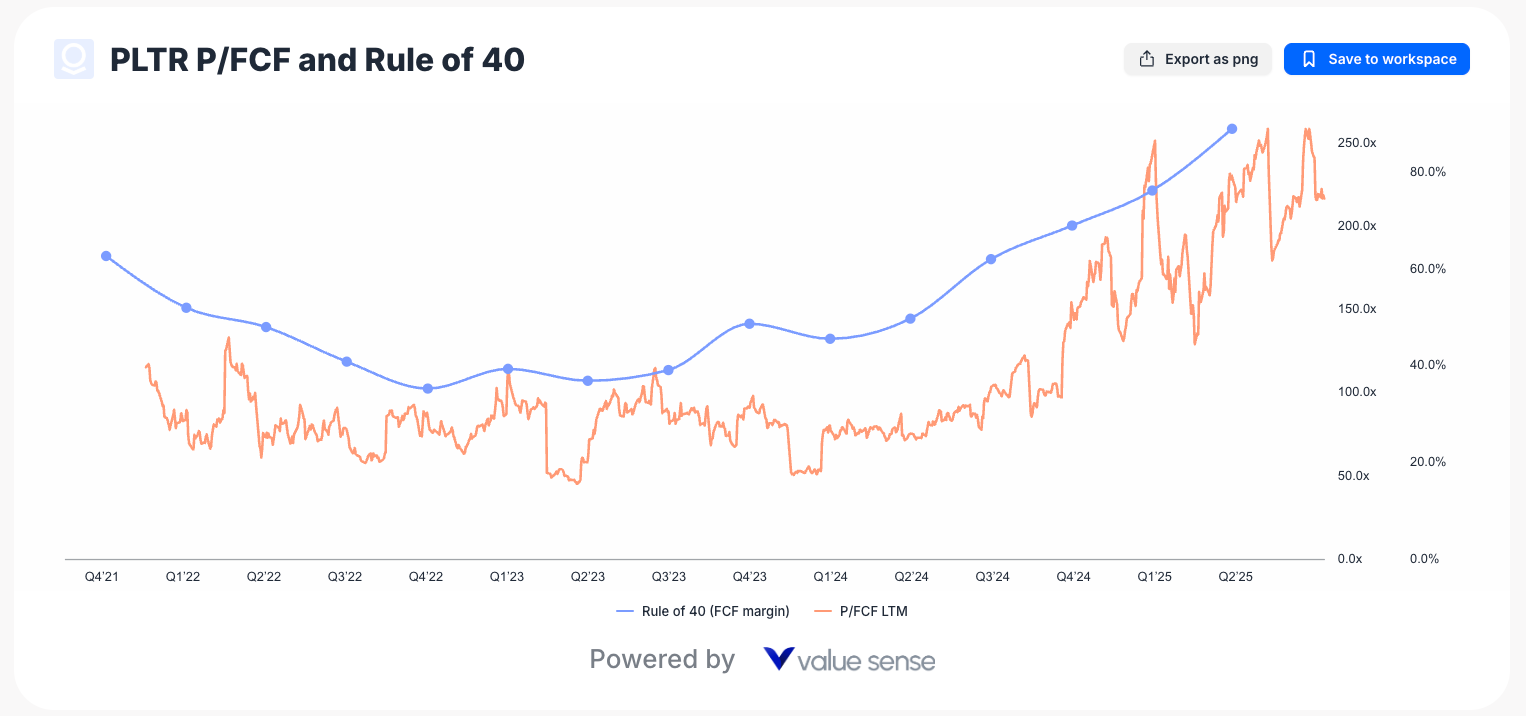
Valuation Dynamics: When Efficiency Drives Multiple Expansion
The correlation analysis reveals several key insights:
Rule of 40 Acceleration (Blue Line):
- Steady improvement from ~40% in Q1 2023 to over 100% in Q2 2025
- Consistent upward trajectory with accelerating momentum
- Demonstrates operational excellence sustainability
P/FCF Multiple Expansion (Orange Line):
- Significant volatility with peaks around Q4 2024
- Range between 50x to 250x+ P/FCF multiples
- Shows market recognition of improved fundamentals despite volatility
Key Correlation Points:
- Q1 2023 Inflection: Both metrics began improving simultaneously
- Q4 2024 Peak: P/FCF multiples reached extremes as Rule of 40 approached 80%
- Q2 2025 Stabilization: Rule of 40 exceeds 100% while P/FCF moderates
Palantir's Rule of 40 Evolution: Quarterly Breakdown
Building on the ValueSense dashboard insights, here's the complete quarterly progression showing how Palantir achieved its record performance:
Historical Rule of 40 Performance
| Quarter | Revenue Growth | Adjusted Operating Margin | Rule of 40 Score |
|---|---|---|---|
| Q3 2023 | 17% | 29% | 46% |
| Q4 2023 | 20% | 34% | 54% |
| Q1 2024 | 21% | 36% | 57% |
| Q2 2024 | 27% | 37% | 64% |
| Q3 2024 | 30% | 38% | 68% |
| Q4 2024 | 36% | 45% | 81% |
| Q1 2025 | 39% | 44% | 83% |
| Q2 2025 | 48% | 46% | 94% |
Source: valuesense.io
The ValueSense dashboard data corroborates this progression, showing the LTM Rule of 40 reaching 89.1% in Q2 2025, which aligns closely with the quarterly 94% score when adjusted for different calculation methodologies.
Breaking Down Palantir's Q2 2025 Financial Excellence
Revenue Performance: Scale Meets Acceleration
Palantir's Q2 2025 revenue reached $1.004 billion, marking the first time the company surpassed $1 billion in quarterly revenue. The 48% year-over-year growth rate represents a dramatic acceleration from previous quarters and exceeded guidance by nearly 1,000 basis points.
Key Revenue Metrics:
- Total Revenue: $1.004 billion (+48% YoY, +14% QoQ)
- U.S. Revenue: $733 million (+68% YoY, +17% QoQ)
- U.S. Commercial: 93% year-over-year growth
- U.S. Government: 53% year-over-year growth
- Customer Count: 849 customers (+43% YoY, +10% QoQ)
The U.S. commercial segment's 93% growth rate particularly stands out, indicating strong enterprise adoption of Palantir's AI-powered platforms.
Margin Expansion: Profitable Growth at Scale
What makes Palantir's performance exceptional isn't just the revenue growth – it's the simultaneous margin expansion. The company achieved a 46% adjusted operating margin in Q2 2025, demonstrating powerful operating leverage.
Profitability Highlights:
- Adjusted Operating Margin: 46% (vs. 37% in Q2 2024)
- Adjusted Gross Margin: 82%
- Adjusted Free Cash Flow Margin: 57%
- GAAP Operating Margin: 27%
- Net Dollar Retention: 128% (+400 basis points QoQ)
The ValueSense dashboard shows FCF margin at 49.7%, which aligns closely with the company's reported 57% adjusted free cash flow margin, confirming the exceptional cash generation capability.
AI Stocks Efficiency: How Palantir Compares to Peers
When analyzing AI stocks efficiency, Palantir's Rule of 40 performance significantly outpaces most technology companies:
Industry Comparison:
- Palantir (PLTR): 94% Rule of 40 score
- Software Industry Average: ~35-45%
- High-Growth SaaS Average: ~50-60%
- AI/Data Analytics Peers: Typically 40-70%
This performance gap isn't just about current metrics – it reflects Palantir's unique business model advantages in the AI and data analytics space.
The Drivers Behind Palantir's Rule of 40 Excellence
1. Platform Scalability and Network Effects
The ValueSense dashboard clearly shows the inflection point where Palantir's platform scalability became evident. The simultaneous improvement in both growth and margins from Q1 2023 onwards demonstrates that the company's software platforms (Gotham, Foundry, and AIP) can handle increasing data volumes and user bases without proportional increases in costs.
2. Enterprise AI Adoption Acceleration
The rapid adoption of AI across enterprises has created unprecedented demand for Palantir's data integration and analytics capabilities. This demand surge, visible in the revenue growth acceleration on the ValueSense charts, allows for pricing power and faster customer expansion.
3. Government Contract Durability
Palantir's government business provides a stable, high-margin revenue base that supports overall profitability while the commercial segment drives growth acceleration.
4. Operational Leverage in Go-to-Market
The company has achieved remarkable efficiency in customer acquisition and expansion, with net dollar retention reaching 128% and average revenue per top customer increasing 30% year-over-year to $75 million.
What Palantir's Rule of 40 Means for Investors
Valuation Justification Through ValueSense Analysis
The ValueSense P/FCF correlation chart shows how the market has responded to Palantir's improving Rule of 40 metrics. High Rule of 40 scores typically support premium valuations in software companies, and Palantir's exceptional performance provides fundamental justification for its market valuation through:
- Sustainable Growth: The company can maintain high growth rates while improving profitability
- Market Leadership: Few companies achieve such operational excellence
- Competitive Moats: The efficiency metrics suggest strong competitive positioning
Future Performance Indicators
The consistent improvement in Rule of 40 scores, as visualized in the ValueSense dashboard trends, suggests several positive indicators:
- Business Model Maturation: Evolution from high-growth, low-margin to efficient growth machine
- Market Expansion: Strong commercial growth indicates broader market acceptance
- Scalability Proof: Margin expansion alongside growth acceleration proves platform scalability
Investment Risks and Considerations
While the ValueSense dashboard analysis reveals exceptional performance, investors should consider several factors:
Market Concentration Risk
Heavy reliance on U.S. markets (73% of revenue) and government contracts creates geographic and customer concentration risks that could impact future growth rates.
Competitive Pressure
As AI and data analytics markets mature, increased competition could pressure both growth rates and margins, potentially impacting the Rule of 40 score trajectory shown in the ValueSense charts.
Valuation Volatility
The P/FCF correlation chart shows significant multiple volatility even as fundamentals improved, indicating that market sentiment can create short-term price disconnects from operational performance.
The Path Forward: Sustaining Rule of 40 Excellence
Palantir's management has provided guidance suggesting continued strong performance:
- Q3 2025 Revenue Guidance: 50% year-over-year growth
- Full Year 2025: 45% revenue growth guidance
- U.S. Commercial: 85% growth guidance for 2025
These projections, combined with the ValueSense dashboard trends, suggest the company expects to maintain elevated Rule of 40 scores, though perhaps not at the exceptional 94% level achieved in Q2 2025.
Key Takeaways from ValueSense Palantir Rule of 40 Analysis
- Record Performance: 94% Rule of 40 score represents exceptional operational efficiency
- Consistent Improvement: Dashboard shows dramatic turnaround from 35% trough to 89%+ LTM
- Balanced Excellence: Both revenue growth (38.8%) and FCF margins (49.7%) contributing
- Market Recognition: P/FCF multiples expanded alongside efficiency improvements
- Sustainable Trajectory: Four-year trend suggests durable competitive advantages
Conclusion: AI Data Giant's Efficiency Revolution
Our comprehensive Palantir Rule of 40 analysis, enhanced by ValueSense dashboard insights, reveals a company that has achieved something remarkable in the software industry – the ability to grow at nearly 50% while maintaining industry-leading profit margins. The 94% Rule of 40 score in Q2 2025 isn't just a financial metric; it's proof that Palantir has built a truly scalable, efficient business model in the high-growth AI and data analytics market.
The ValueSense dashboard data provides compelling visual evidence of this transformation, showing the dramatic recovery from the Q3 2022 trough to the current efficiency peak. For investors focused on AI stocks efficiency, Palantir represents a unique combination of growth and profitability that's rare in the technology sector.
The PLTR Rule of 40 story, as illustrated through comprehensive dashboard analysis, demonstrates how the best software companies can achieve sustainable, profitable growth by building platforms that scale efficiently with customer success. As AI adoption continues accelerating across enterprises and governments, Palantir's efficiency metrics position it as a leader in the next generation of data-driven software companies.
Explore More Investment Opportunities

For investors seeking undervalued companies with high fundamental quality, our analytics team provides curated stock lists:
📌 50 Undervalued Stocks (Best overall value plays for 2025)
📌 50 Undervalued Dividend Stocks (For income-focused investors)
📌 50 Undervalued Growth Stocks (High-growth potential with strong fundamentals)
🔍 Check out these stocks on the Value Sense platform for free!
More Articles You Might Like
📖 AltaRock Portfolio 2025: The Mark Massey's Latest Moves
📖 Undervalued Utility Stocks: Best Defensive Value Plays
📖 Disney vs Netflix Stock Analysis 2025
FAQ: Palantir Rule of 40 Analysis
Q1: What does the ValueSense dashboard show about Palantir's Rule of 40 trend?
A: The ValueSense dashboard reveals a dramatic transformation from a trough of ~35% in Q3 2022 to 89.1% LTM Rule of 40 in Q2 2025. This represents one of the most impressive efficiency turnarounds in the software industry, with consistent improvement over eight consecutive quarters.
Q2: How do Palantir's revenue growth and FCF margins compare according to ValueSense data?
A: The ValueSense dashboard shows Palantir achieved 38.8% revenue growth and 49.7% FCF margin in Q2 2025. This combination is exceptional because both metrics improved simultaneously from Q1 2023 onwards, reversing the typical inverse relationship between growth and profitability.
Q3: What does the P/FCF correlation with Rule of 40 indicate for PLTR valuation?
A: The ValueSense P/FCF correlation chart shows that while multiples have been volatile (ranging 50x-250x+), they generally expanded alongside Rule of 40 improvements. This suggests the market recognizes Palantir's operational excellence, though valuation multiples can disconnect from fundamentals in the short term.
Q4: Can Palantir sustain its current Rule of 40 efficiency levels based on dashboard trends?
A: The ValueSense dashboard shows a consistent four-year improvement trajectory with accelerating momentum from Q3 2024. Combined with management guidance of 45% revenue growth for 2025, the data suggests sustainable high Rule of 40 scores, though potentially moderating from the peak 94% level.
Q5: How does ValueSense dashboard data support investment decisions in PLTR?
A: The dashboard provides three key investment insights: (1) Consistent operational improvement over four years, (2) Sustainable business model with both growth and margin expansion, and (3) Market leadership in AI stocks efficiency. However, investors should note the P/FCF volatility and consider valuation timing carefully.