ValueSense Intrinsic Value Tools - Peter Lynch Fair Value Calculator
The Peter Lynch Fair Value calculator implements the renowned investor's approach to stock valuation, combining the Price-to-Earnings (P/E) ratio with a company's growth rate and dividend yield to determine if a stock is undervalued or overvalued. This time-tested method provides a straightforward way to assess whether a stock's current price reflects its growth potential.
Accessing the Peter Lynch Fair Value Calculator
From the Intrinsic Value Tools Hub
- Navigate to the main
valuesense.io/intrinsic-value-toolspage - Scroll down to find the "Peter Lynch Fair Value" card
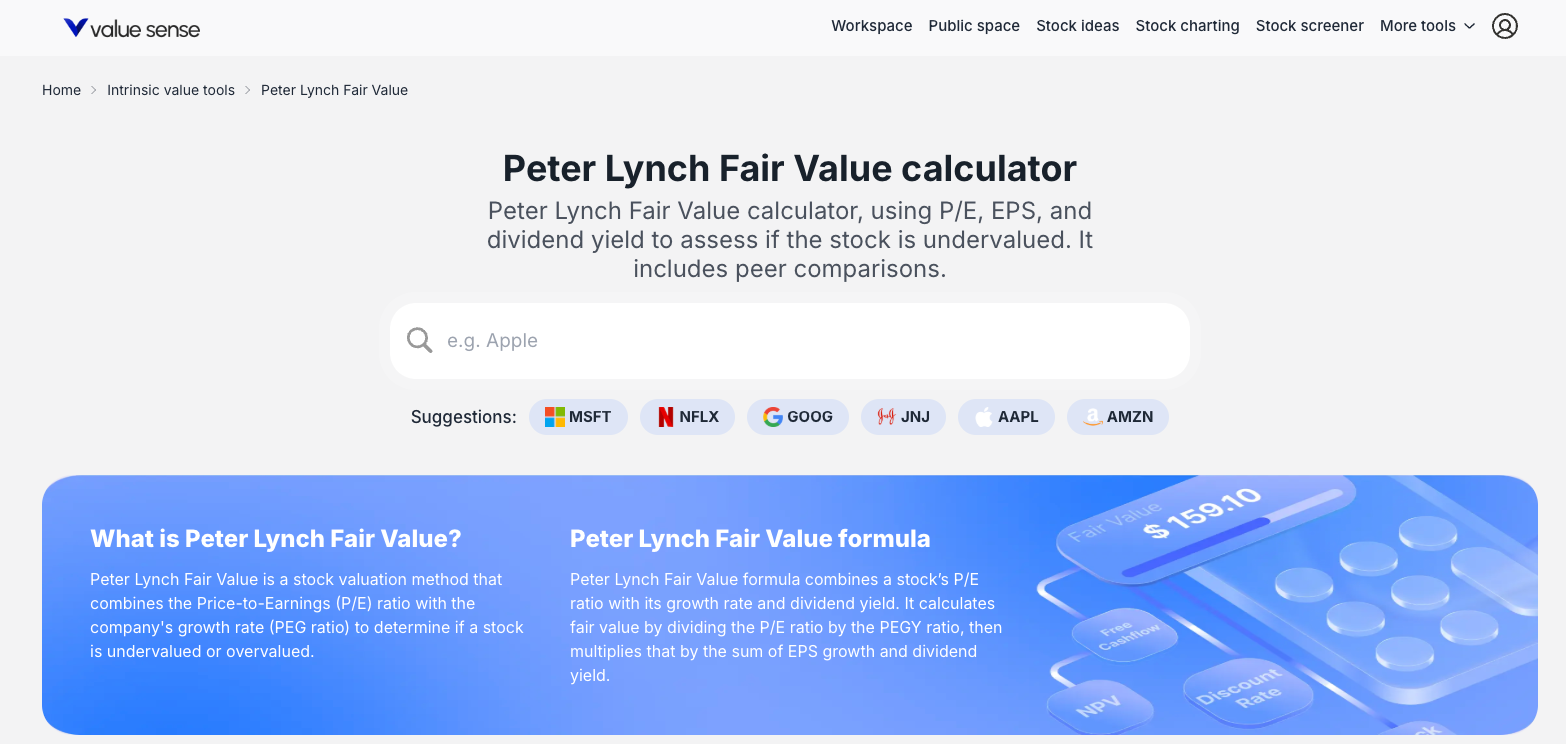
- Click on the card to access the calculator's landing page
- Search for a stock in the search bar (e.g., "Apple") or click on suggested tickers (MSFT, NFLX, GOOG)
- Access the comprehensive analysis page for your selected company

What the Peter Lynch Fair Value Method Does
Core Purpose
The tool determines whether a stock is undervalued or overvalued based on Peter Lynch's proven investment principles, specifically using the PEGY (Price/Earnings to Growth and Yield) ratio methodology.
Key Methodology
The calculation combines three fundamental factors:
- Price-to-Earnings (P/E) ratio: Current valuation multiple
- Earnings Per Share (EPS) growth: Company's growth rate
- Dividend Yield: Income component of total return
Investment Philosophy
Based on Lynch's principle that a fairly valued stock should have a P/E ratio roughly equal to its growth rate, with dividend yield providing additional value.
Core Calculation Method
Step 1: PEGY Ratio Calculation
PEGY = LTM P/E / (EPS growth % + Dividend Yield %)
Step 2: Peter Lynch Fair Value
Fair Value = Last Share Price / PEGY
Key Interpretation Rule
- PEGY < 1.0x: Stock may be attractively priced relative to its growth
- PEGY > 1.0x: Stock may be over-priced relative to its growth potential
Input Data and Customization
Default Data Sources
- LTM P/E: Last twelve months price-to-earnings ratio
- EPS Growth: Earnings per share growth rate
- Dividend Yield: Current dividend yield percentage
- Last Share Price: Current market price
Customizable Assumptions
- Interactive Input Fields: Modify any assumption in the "Peter Lynch Fair Value Assumptions" section
- Scenario Testing: Input your own figures to test different growth or P/E scenarios
- Real-time Recalculation: Results update instantly as you modify inputs
- Save Scenarios: Use "Save as new" to preserve custom analysis
Comprehensive Results and Outputs
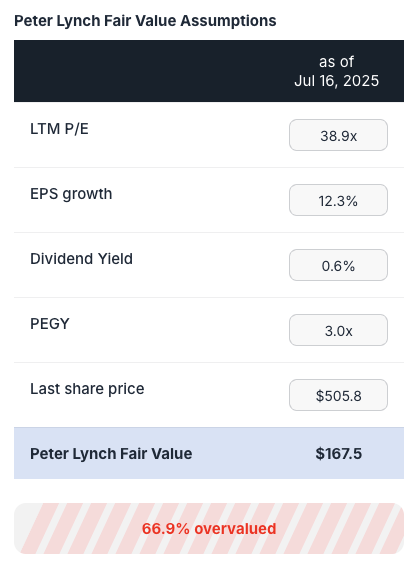
Summary Valuation
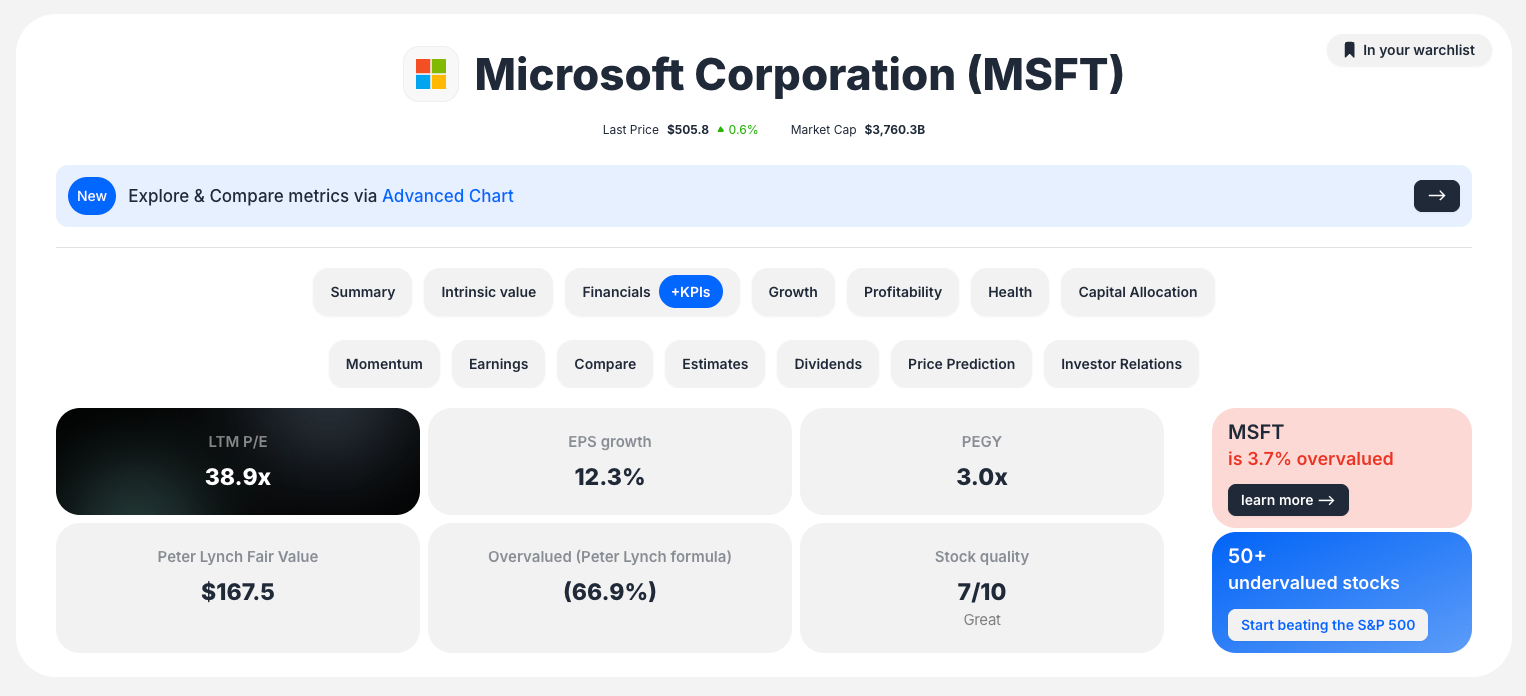
- Peter Lynch Fair Value: Calculated dollar value per share (e.g., $167.5)
- Over/Undervaluation: Clear percentage indication (e.g., "66.9% overvalued")
- PEGY Ratio: Key metric for quick assessment
Visual Formula Breakdown
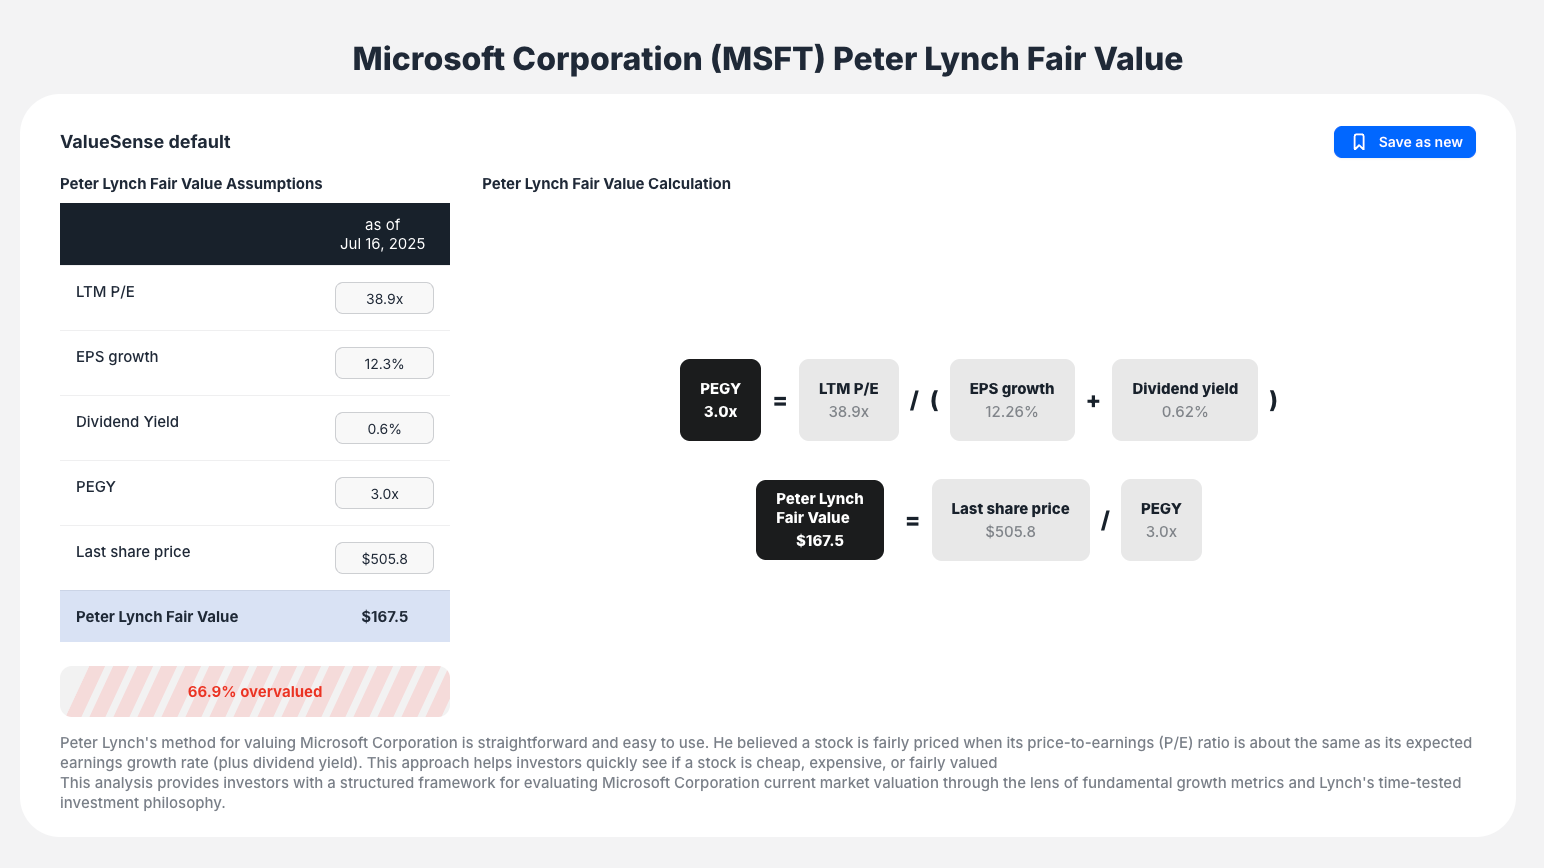
- Step-by-step calculation: Shows how PEGY ratio and fair value are derived
- Transparent methodology: Visual representation of all inputs and calculations
- Clear result interpretation: Prominent display of final valuation status
Historical Context Charts
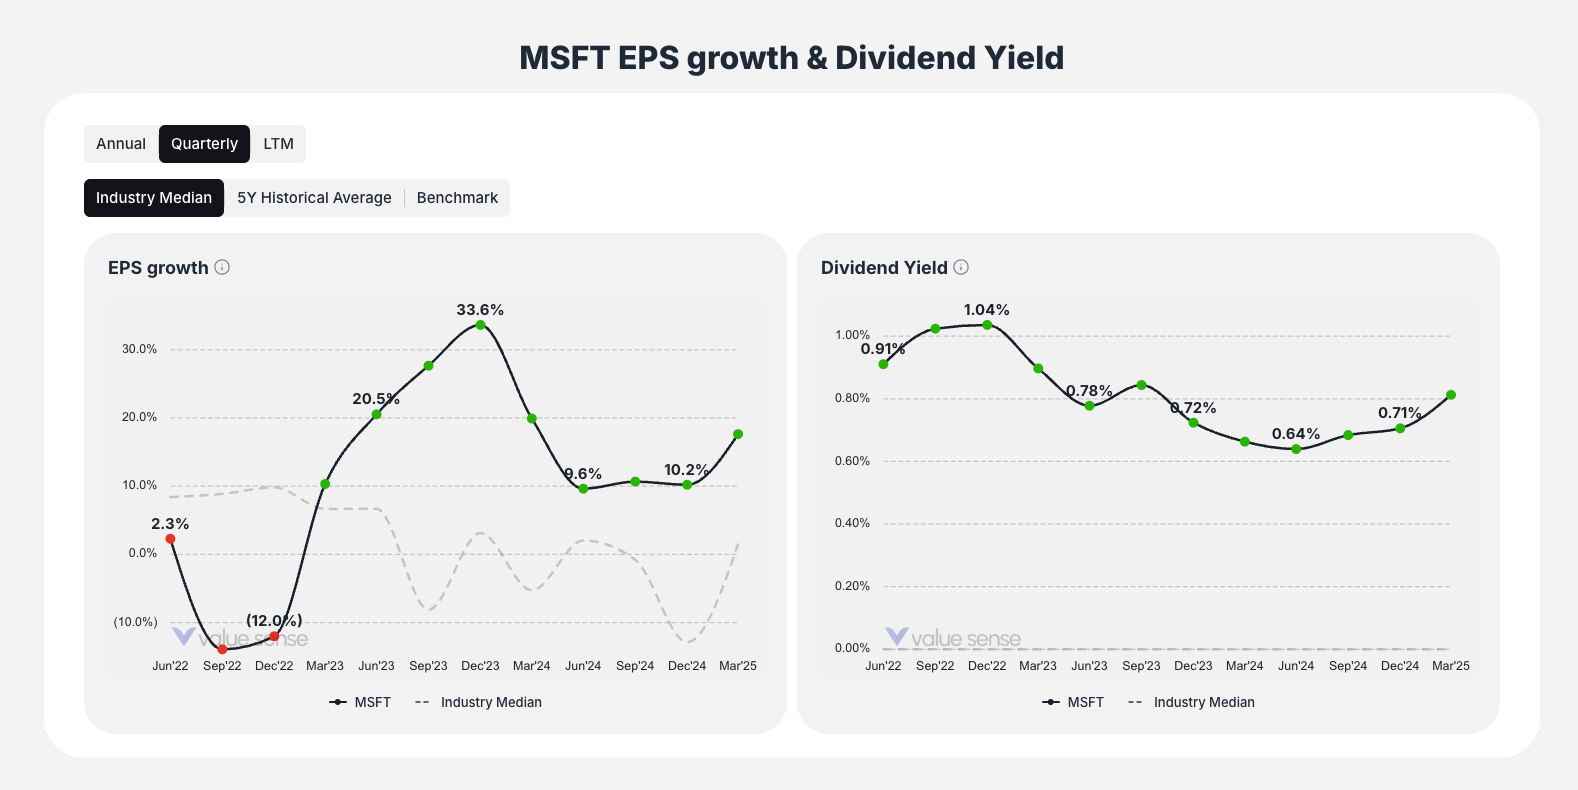
- EPS Growth & Dividend Yield History: Historical trends for key input metrics
- Data validation: Helps assess if current assumptions are reasonable
- Trend analysis: Understanding sustainability of growth rates
Peer Comparison Table
Benchmarks your selected stock against industry peers on:
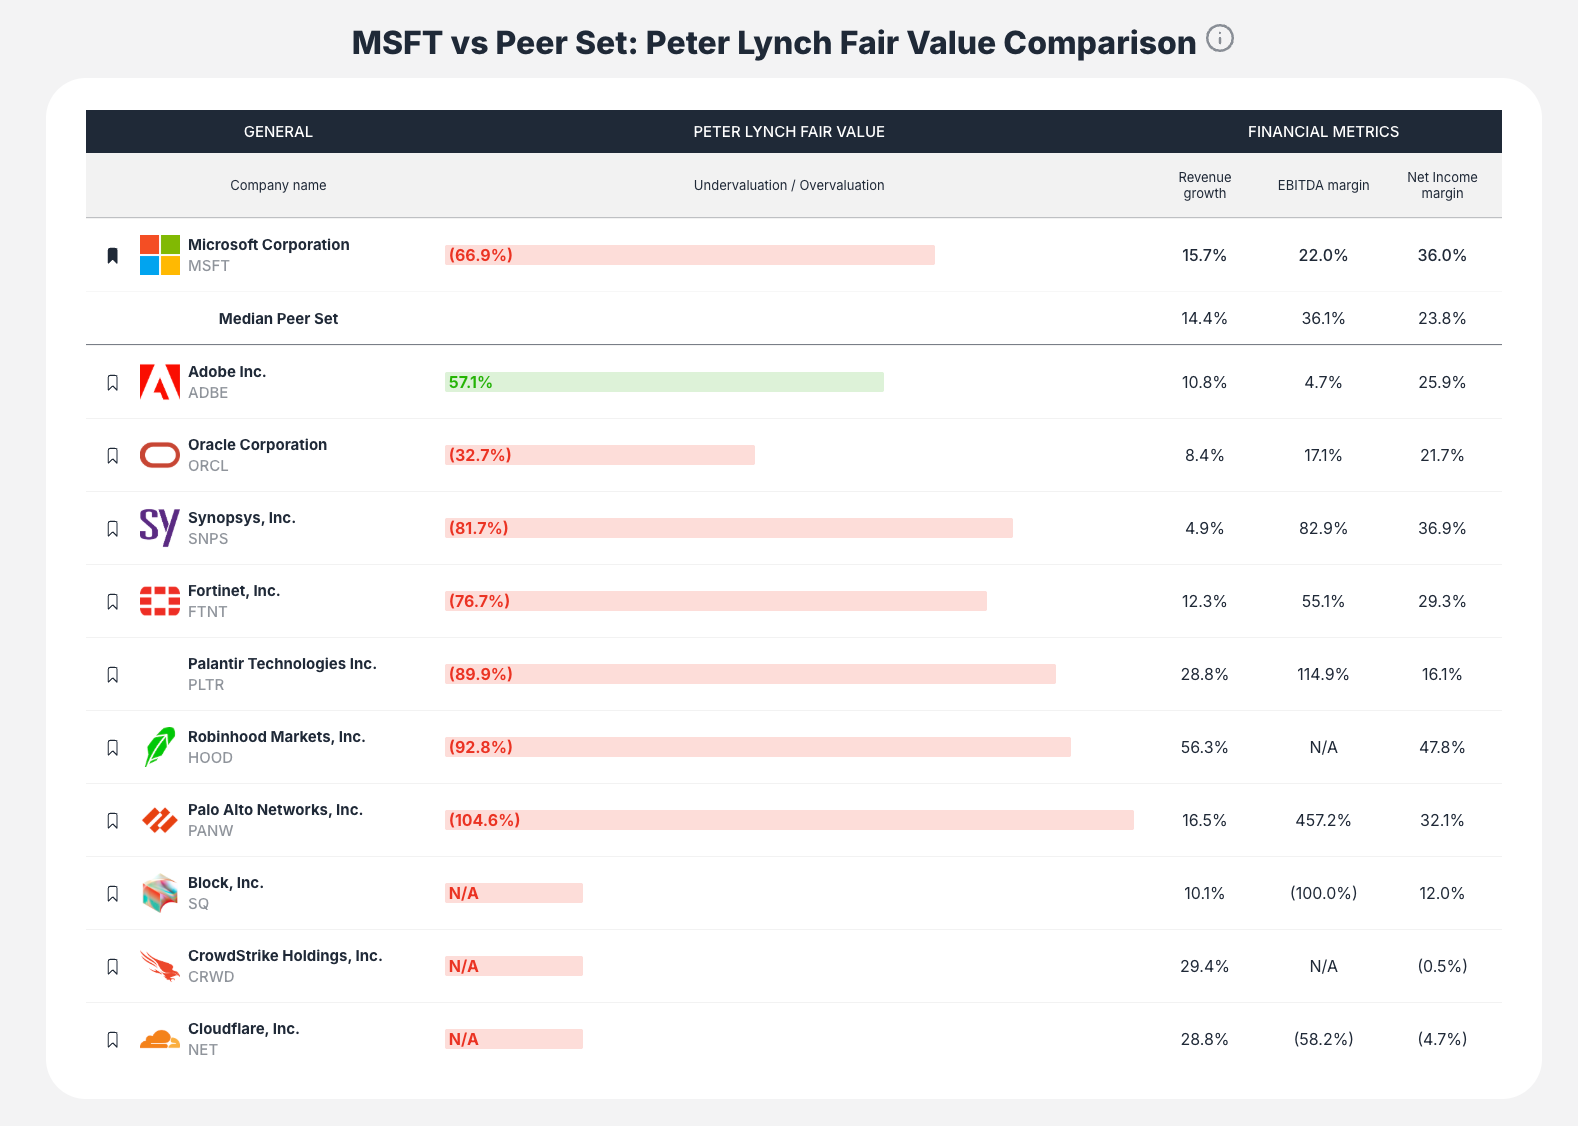
- Peter Lynch Fair Value comparison
- Under/overvaluation percentages
- Revenue growth rates
- Profitability margins
How to Interpret Results
Primary Valuation Assessment
- Compare Fair Value to Current Price
- Higher fair value = potentially undervalued
- Lower fair value = potentially overvalued
- Analyze PEGY Ratio
- Below 1.0x = attractive valuation relative to growth
- Above 1.0x = expensive relative to growth potential
Contextual Analysis
- Peer Comparison: Understand if valuation is in line with, better, or worse than competitors
- Historical Trends: Assess sustainability of current growth rates using historical charts
- Growth Quality: Consider both EPS growth and dividend yield components
Key Workflow Steps
Step 1: Access and Select
Navigate to the Peter Lynch Fair Value calculator and choose your target stock
Step 2: Review Default Analysis
- Examine automatically generated fair value calculation
- Note default assumptions and formula breakdown
- Check initial over/undervaluation assessment
Step 3: Interpret Core Results
- Compare fair value to current share price
- Analyze PEGY ratio for quick assessment
- Review over/undervaluation percentage
Step 4: Customize Analysis (Optional)
- Modify assumptions in the "Assumptions" section
- Test different growth rate scenarios
- Experiment with P/E ratio variations
Step 5: Contextualize with Data
- Review historical EPS growth and dividend yield charts
- Analyze peer comparison table for industry context
- Assess sustainability of key assumptions
Step 6: Integration and Next Steps
- Use integrated links to explore related investment ideas
- Apply findings to broader investment strategy
- Consider analysis alongside other valuation methods
Best Practices
Assumption Validation
- Always review historical charts before accepting default assumptions
- Consider cyclical patterns in EPS growth
- Evaluate dividend sustainability
Peer Context
- Compare PEGY ratios across industry peers
- Understand industry-specific growth patterns
- Consider competitive positioning
Scenario Analysis
- Test conservative and optimistic growth scenarios
- Vary P/E assumptions based on market conditions
- Consider impact of dividend policy changes
Method Limitations
- Most effective for established companies with consistent earnings
- Less suitable for high-growth companies with no dividends
- Works best for companies with predictable business models
Key Questions the Tool Answers
- "Is this stock fairly valued according to Peter Lynch's method?"
- Direct answer through fair value calculation and PEGY ratio
- "How does the valuation compare to growth potential?"
- PEGY ratio provides growth-adjusted valuation assessment
- "What if my growth assumptions are different?"
- Customizable inputs allow personal assumption testing
- "How does this compare to similar companies?"
- Peer comparison table provides industry context
- "Are the current assumptions reasonable?"
- Historical charts validate input assumptions
The Peter Lynch Fair Value calculator brings one of investing's most successful methodologies to your analysis toolkit, providing clear, actionable insights based on the principle that great companies should trade at reasonable prices relative to their growth potential.