Profitability Ratios for Stock Investors: A Comprehensive Guide
Profitability ratios are indispensable tools for stock investors seeking to assess how efficiently a company generates profits relative to its revenues and expenses. These ratios offer insights into a company’s financial health, its ability to sustain growth, and how it stacks up against competitors. By examining profitability ratios, investors can make more informed decisions, aligning their investment strategies with a company’s potential for long-term success.
Key Profitability Ratios for Investors
Several types of profitability ratios are particularly useful for stock investors, with each ratio serving a unique purpose in analyzing a company’s financial health.
Gross Profit Margin
Gross profit margin represents how much profit remains after a company subtracts the cost of goods sold (COGS) from total revenue. It shows how efficiently a company produces goods or services relative to the costs of production. The formula is:

For example, if a company’s revenue is $1,000 and the gross profit is $900, the gross profit margin is:

This means the company retains 90% of revenue after covering direct production costs, leaving plenty of room to manage other expenses.
Operating Profit Margin
Operating profit margin goes a step further by factoring in operating expenses, such as administrative costs, research and development, and depreciation. It shows how well a company is managing its operational efficiency. The formula is:

If the operating profit is $800 and revenue is $1,000, the operating profit margin is:
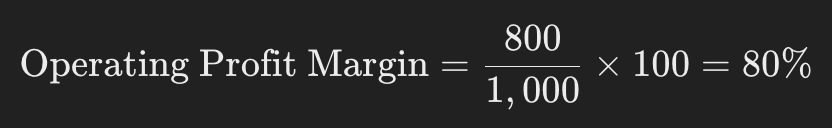
This indicates the company effectively controls its day-to-day operations, allowing it to generate a high percentage of revenue as profit.
Net Profit Margin
Net profit margin is the most comprehensive profitability ratio. It accounts for all expenses, including taxes, interest, and extraordinary items. It shows how much of a company’s revenue ultimately becomes net profit. The formula is:

If a company has a net profit of $525 and revenue of $1,000, the net profit margin would be:

Practical Example: Nike’s Profitability Ratios (FY 2023)
Let’s apply these ratios to Nike’s FY 2023 financials to illustrate their importance:
Gross Profit Margin: Nike had a gross profit of $22.3 billion and revenue of $51.2 billion. The gross profit margin is:

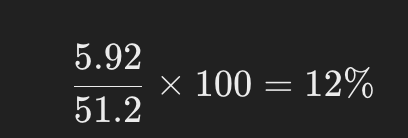
Operating Profit Margin: With an operating profit of $5.92 billion, Nike’s operating profit margin is:
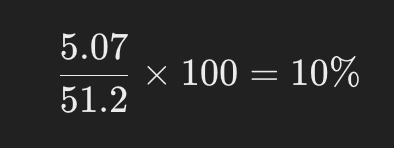
Net Profit Margin: Nike’s net profit of $5.07 billion yields a net profit margin of:
Why Profitability Ratios Matter for Investors
Understanding profitability ratios allows investors to analyze key aspects of a company's performance, such as:
- Efficiency: How well a company manages production costs and operating expenses to generate profit.
- Competitiveness: Investors can compare these ratios across companies to assess competitive advantages.
- Growth Potential: Consistently high or improving profitability ratios indicate strong growth potential, making the company an attractive investment.
For example, by comparing Nike’s gross profit margin of 44% with that of its competitor Adidas (40%), investors may conclude that Nike is more efficient in controlling production costs. Similarly, tracking changes in a company’s net profit margin over time can reveal trends that signal either growth or emerging financial challenges.
The Role of Profitability Ratios in Investment Decisions
Profitability ratios help investors answer key questions about a company, such as:
- Is the company improving its profit-generating ability?
A rising net profit margin suggests that a company is becoming more efficient in turning revenue into profit. - How does the company compare to its peers?
Comparing operating profit margins across companies reveals which firm manages its expenses better, giving investors a sense of operational efficiency. - Is the company’s profitability sustainable?
Analyzing gross profit margins over time helps investors determine whether a company can consistently cover its production costs while remaining profitable.
By using these ratios, stock investors can identify companies that are not only profitable but are also positioned for long-term growth.