ValueSense Intrinsic Value Tools - Relative Value
The Relative Value Calculator determines whether a stock is cheap or expensive compared to similar companies and its own historical performance. Unlike absolute valuation methods, this tool focuses on relative comparisons to help you identify opportunities where stocks are trading at discounts or premiums to their peers and historical norms.
Accessing the Relative Value Calculator
From the Value Investing Tools Hub
- Navigate to the main Value investing tools page
- Scroll down to locate the "Relative Value" card
- Click on the card to access the tool's main landing page
From the Tool's Landing Page
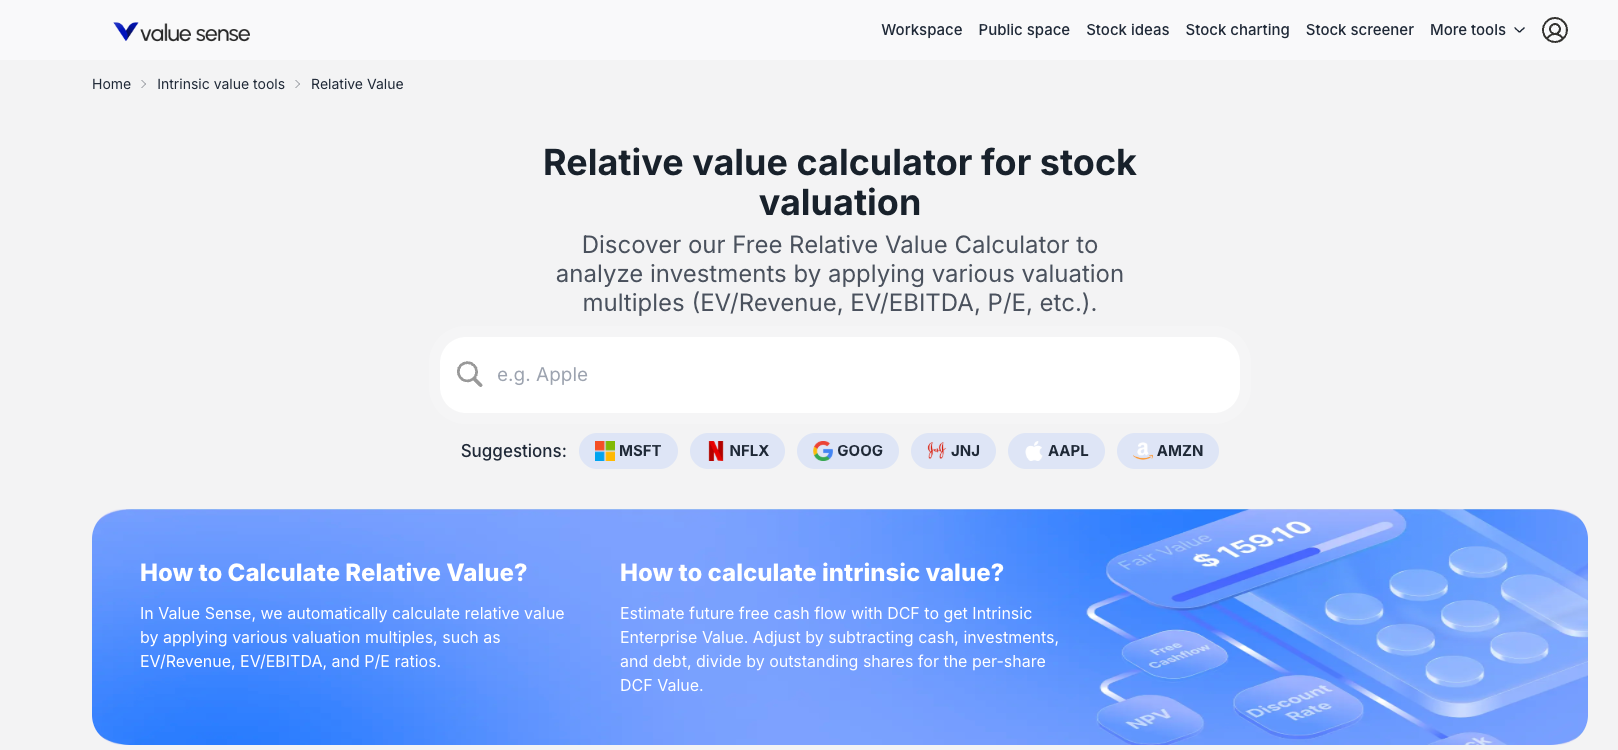

- On the "Relative value calculator for stock valuation" page
- Type a company name or ticker in the search bar (e.g., "Apple")
- Or click on provided suggestions (MSFT, NFLX, GOOG)
What the Relative Value Calculator Does
Core Purpose
The calculator answers the fundamental question: "Is this stock cheap or expensive compared to similar companies and its own past performance?"
Key Functions
- Peer Comparison: Compares valuation multiples against a curated peer group
- Historical Analysis: Analyzes the company's historical valuation patterns
- Relative Valuation: Generates a "Relative Value" per share based on peer and historical data
- Context Assessment: Determines if current valuation levels are normal or extreme
Key Outputs and Results
Top-Level Summary Cards
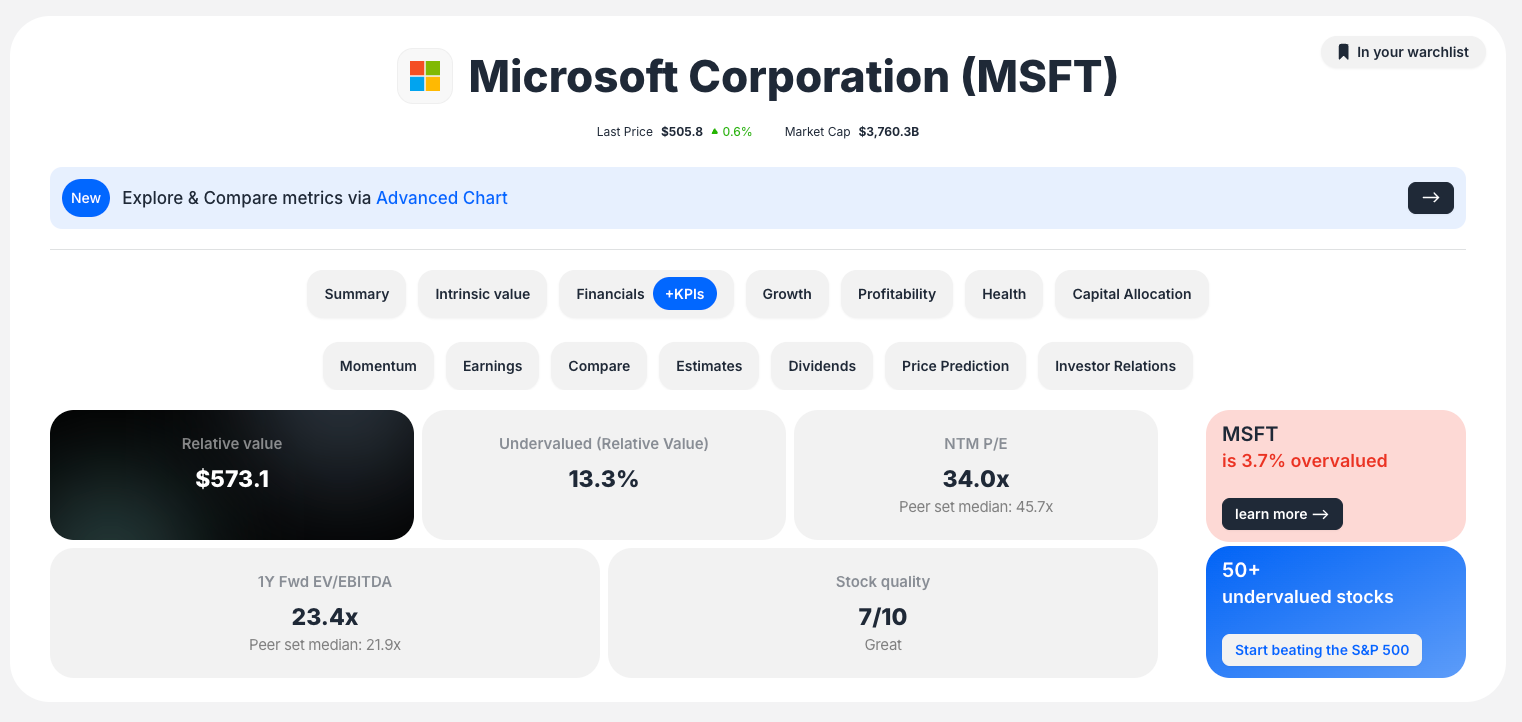
- Relative Value: Dollar value per share (e.g., $573.1)
- Undervaluation/Overvaluation: Percentage difference from current price (e.g., 13.3% Undervalued)
- Key Metrics: NTM P/E, 1Y Fwd EV/EBITDA
Relative Value Model Section
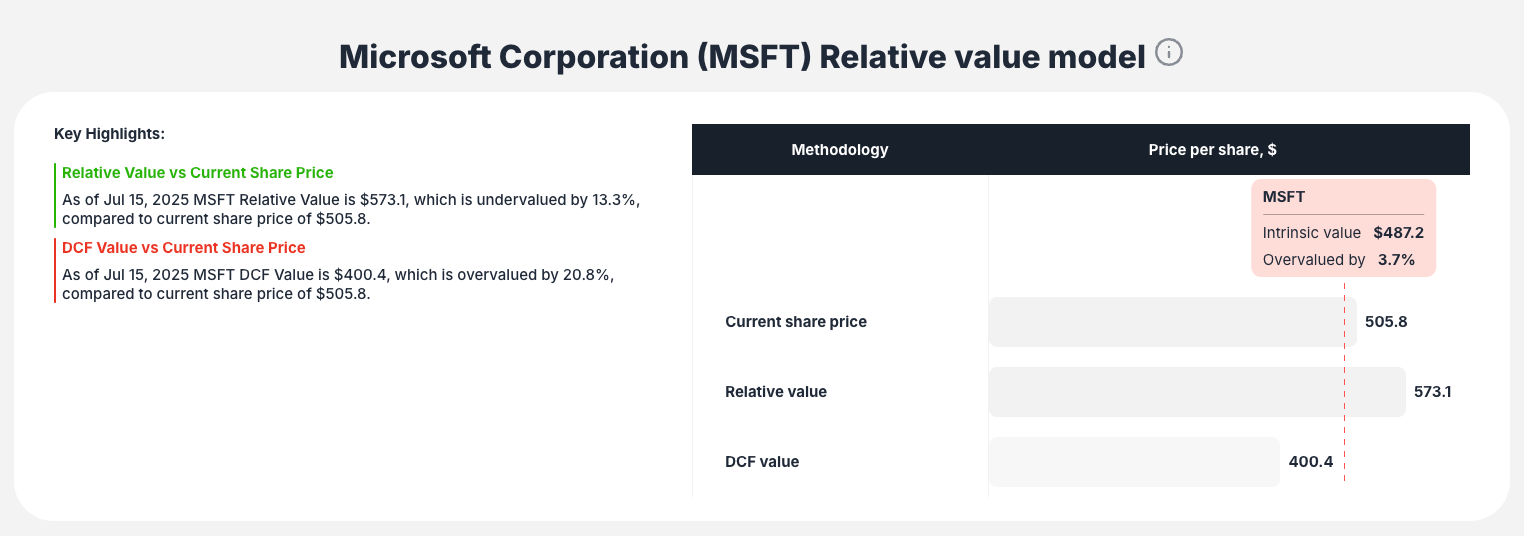
- Key Highlights: Text summary explaining the valuation result
- Price Comparison Bar Chart: Visual comparison of:
- Current share price
- Relative value
- Intrinsic value
- DCF value
Peer Comparison Table
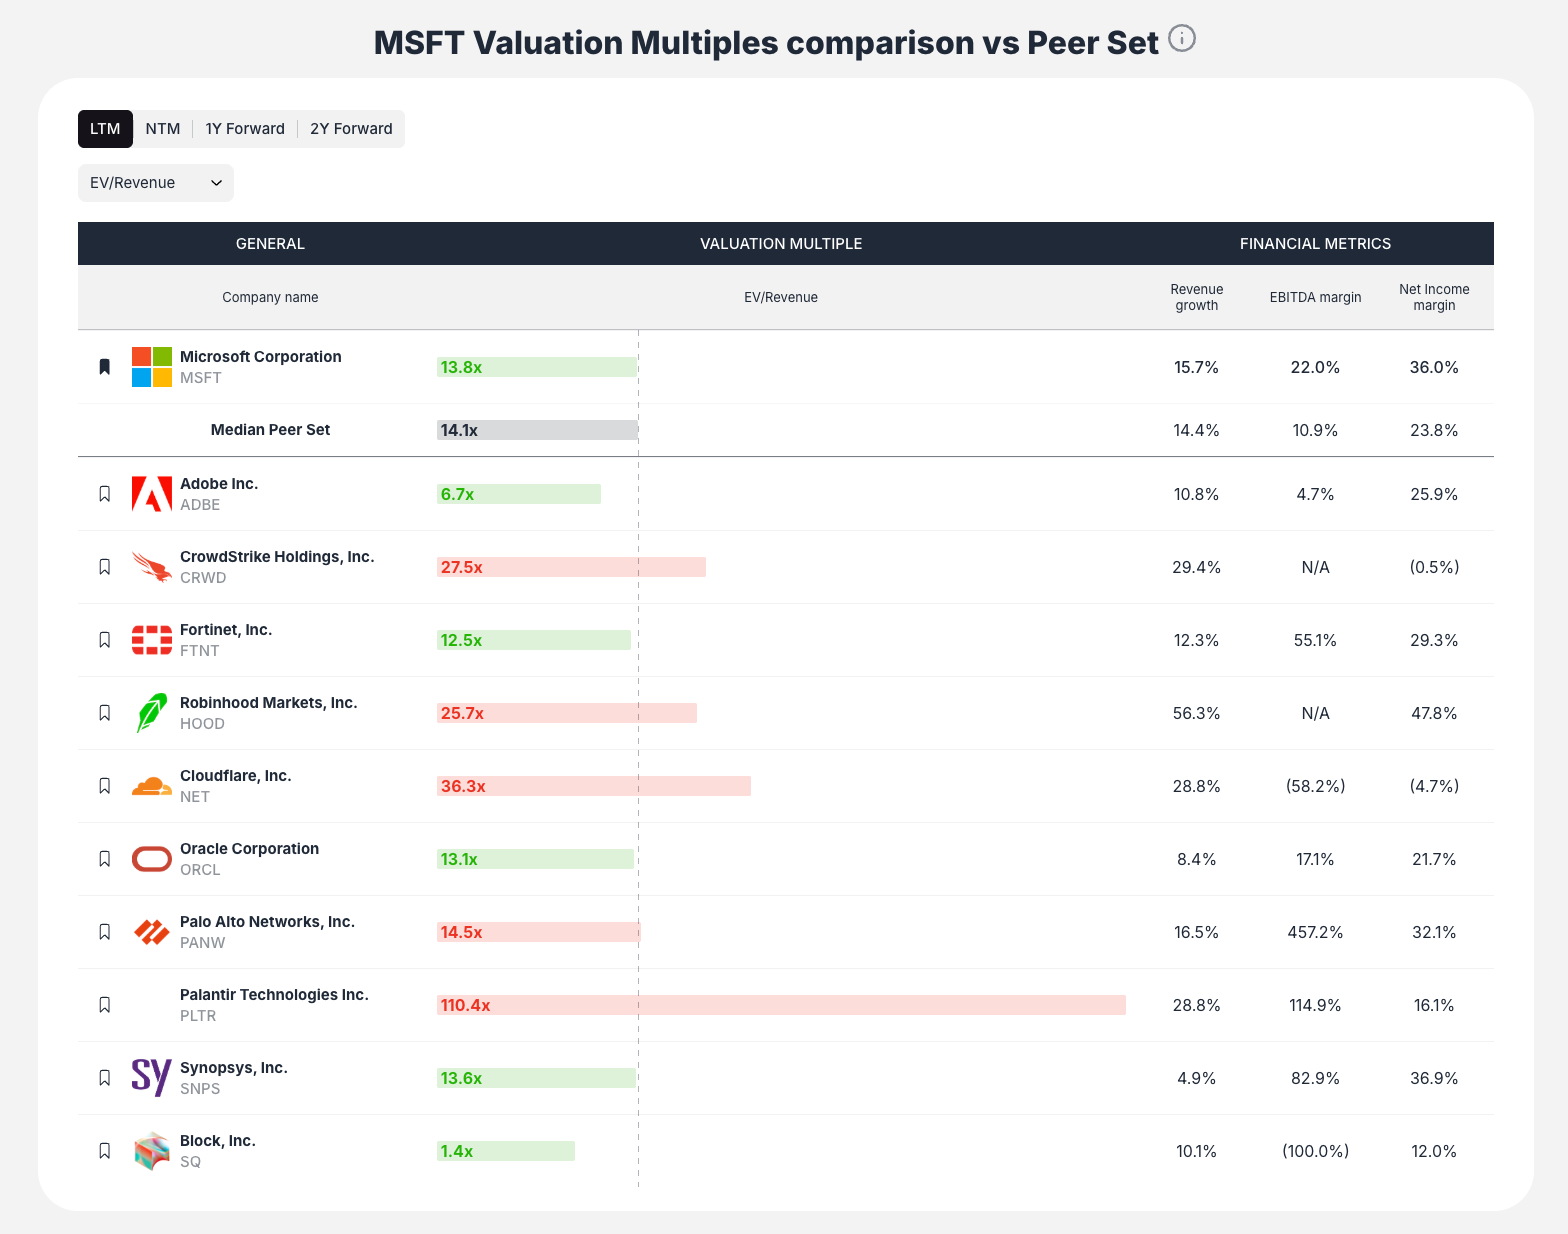
- Target company vs. median peer set
- Individual peer companies listed
- Selected valuation multiple for each company
- Key financial metrics (Revenue Growth, EBITDA Margin)
Valuation Multiples Overview
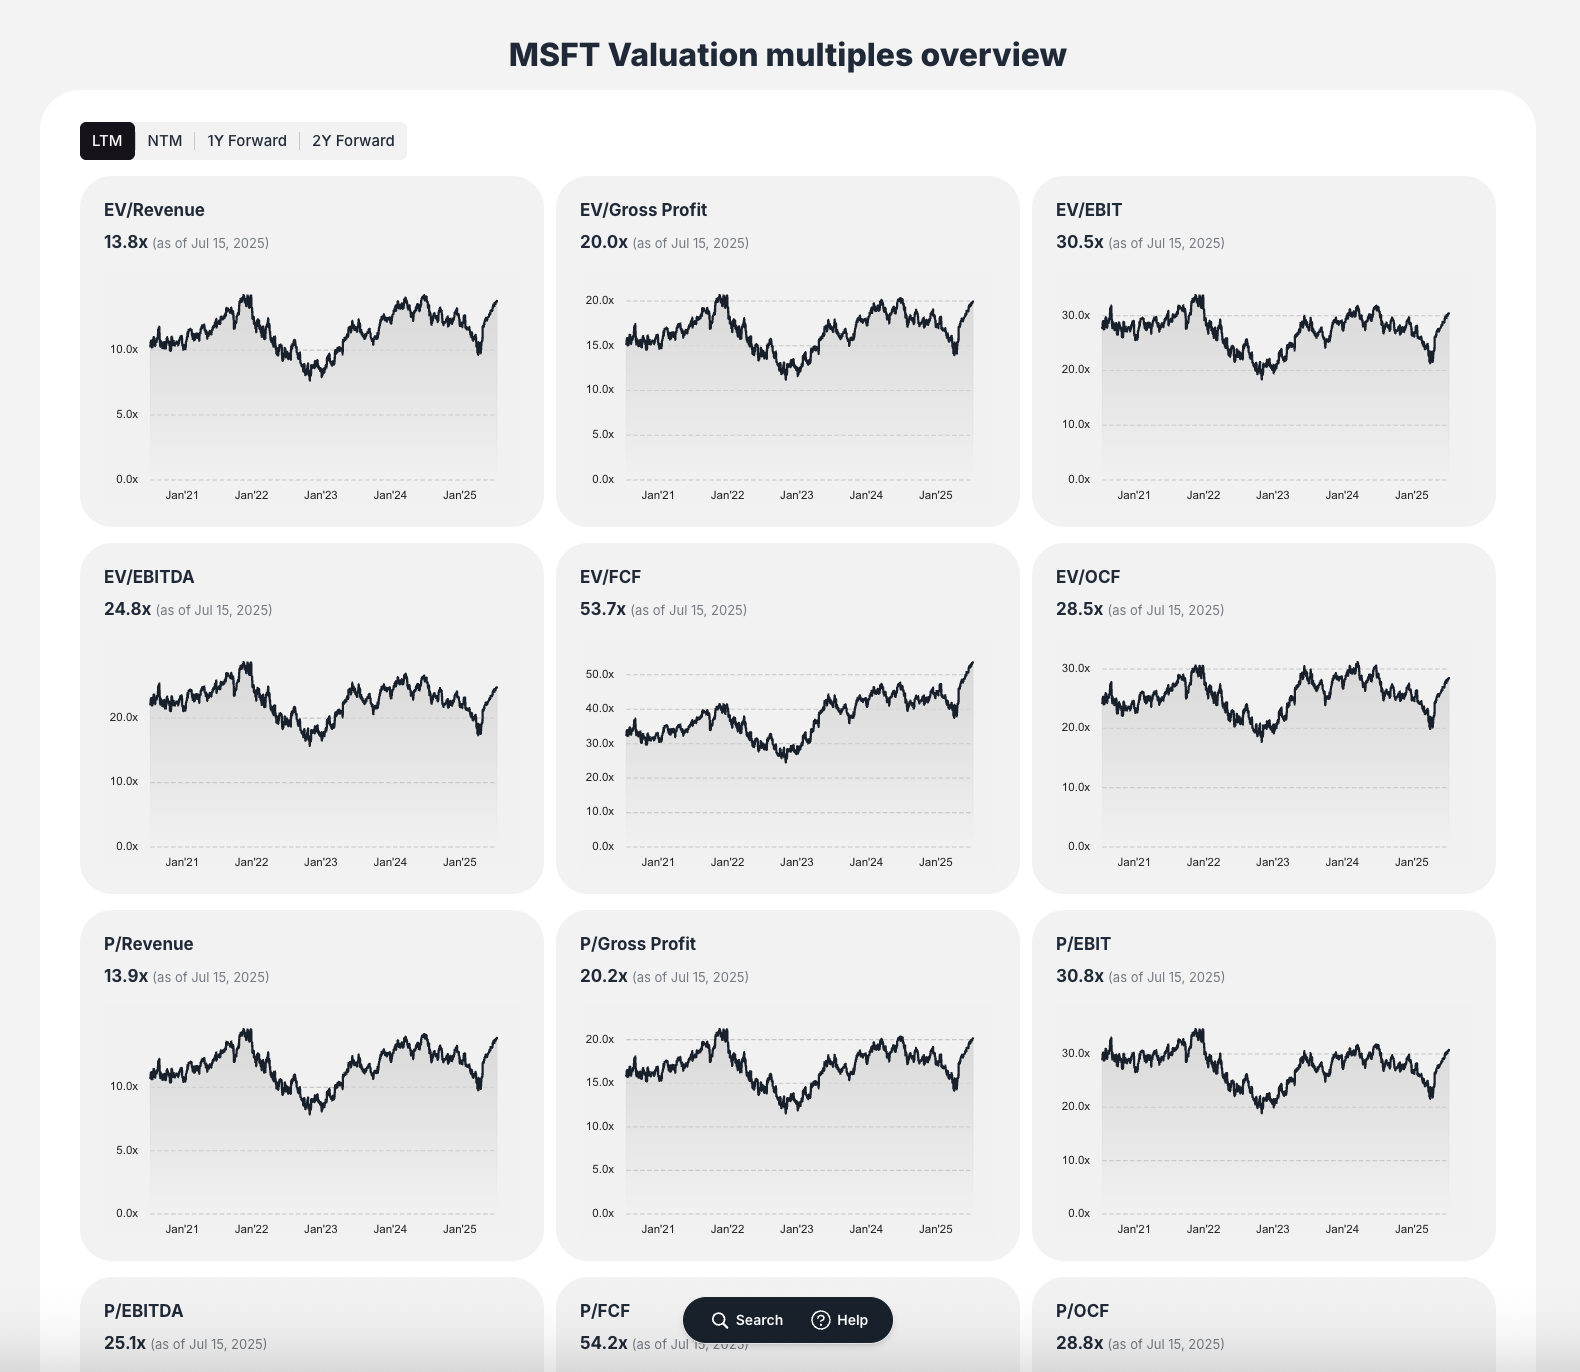
- Grid of small line charts showing historical trends
- Multiple different valuation ratios over ~5 years
- Quick visual assessment of valuation patterns
Historical Comparison Chart
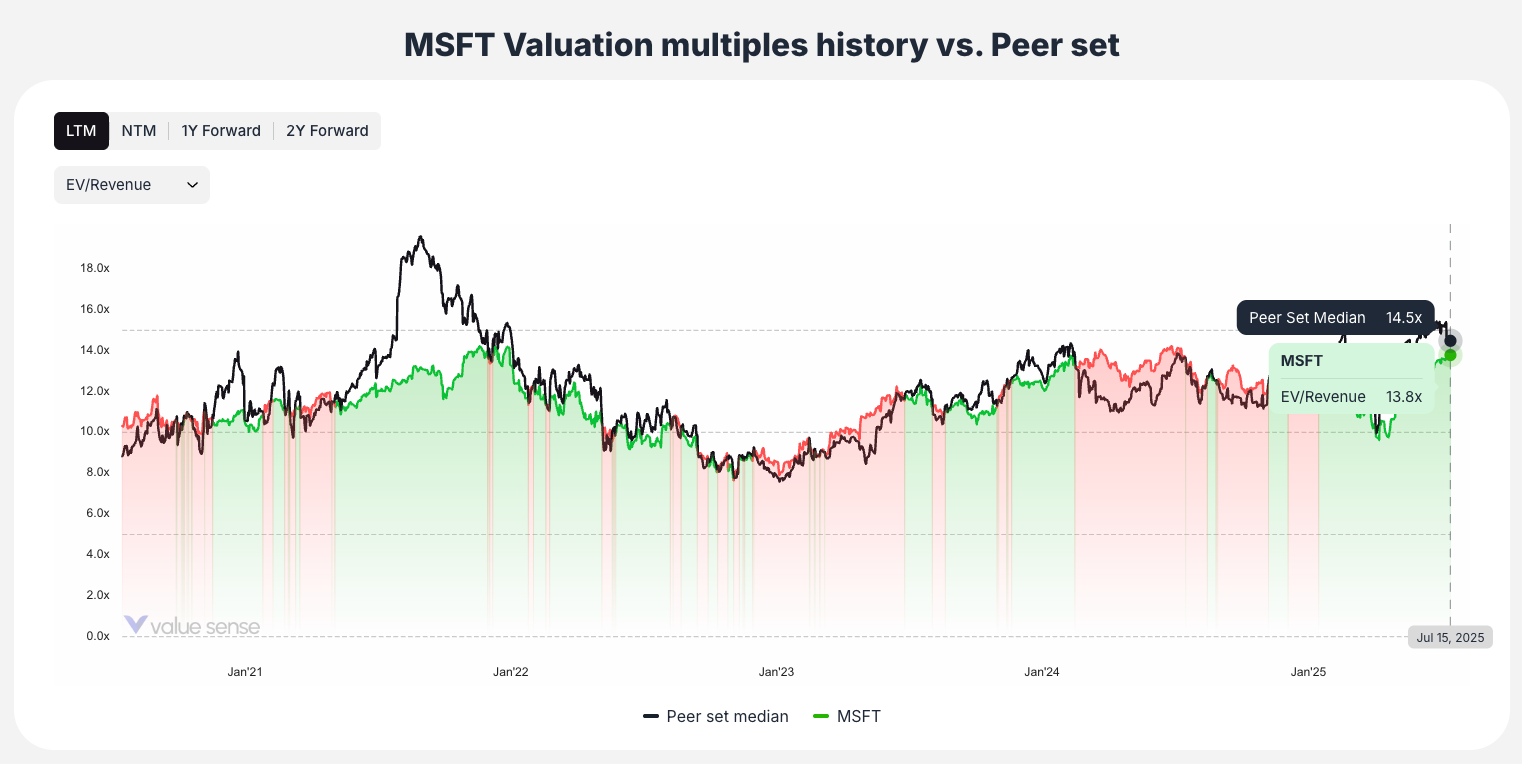
- Detailed line chart plotting company's multiple vs. peer set median over time
- Color-coded analysis:
- Green areas: Company multiple below peer median (relatively cheap)
- Red areas: Company multiple above peer median (relatively expensive)
Interactive Features
Real-Time Customization
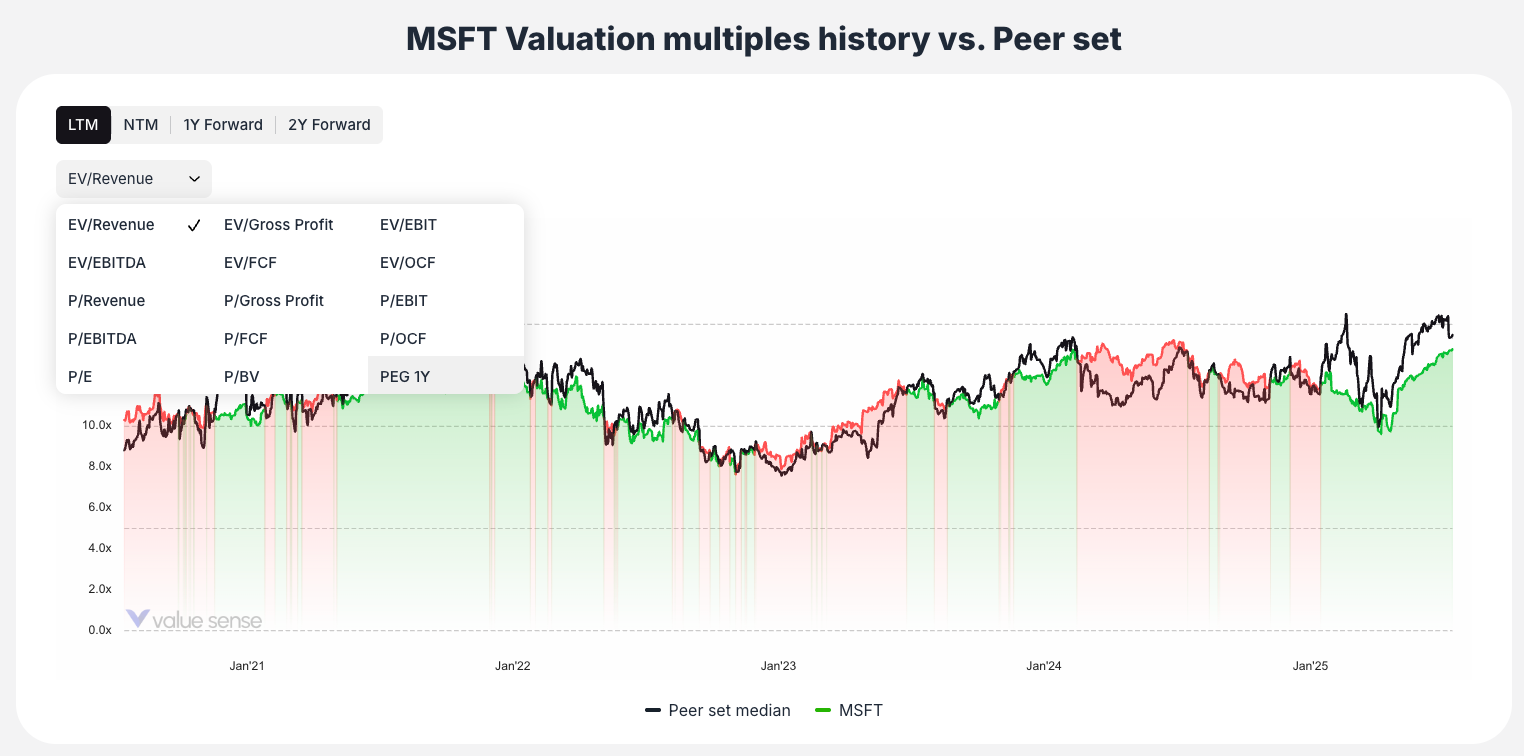
- Change valuation multiples and see instant updates
- Toggle between time periods (LTM, 1Y Forward, 2Y Forward)
- All charts and tables update automatically
Methodology and Assumptions
Peer Set Comparison
- Carefully curated comparable companies
- Industry-specific peer selection
- Median peer calculations for benchmarking
Multiple-Based Valuation
- Comprehensive range of valuation multiples
- Not reliant on single metric
- Holistic view across different valuation approaches
Blended Approach
- Weighted average of peer comparisons and historical ranges
- Appropriate weightings applied to each metric
- Synthesis of multiple analytical perspectives
Forward-Looking Integration
- Incorporates analyst estimates for future periods
- Balances historical data with forward projections
- Accounts for expected changes in business performance
How to Interpret Results
Primary Interpretation
- Compare Relative Value to Current Price
- Higher Relative Value = Undervalued on relative basis
- Lower Relative Value = Overvalued on relative basis
- Analyze the Percentage Difference
- Significant undervaluation may indicate opportunity
- Significant overvaluation may indicate risk
Historical Context
- Use the historical comparison chart to understand trends
- Identify if current valuation is at historical extremes
- Assess whether premium/discount to peers is normal for this stock
Peer Analysis
- Review peer comparison table for justification
- Higher multiples may be justified by superior growth or margins
- Lower multiples may indicate company-specific challenges
Sanity Check
- Compare relative value to intrinsic value methods
- Look for consistency across different valuation approaches
- Consider industry-specific factors affecting multiples
Key Workflow Steps
Step 1: Access and Select
Navigate to the tool and select your target stock
Step 2: Initial Assessment
Review top-level cards for quick relative value assessment
Step 3: Holistic View
Examine price comparison bar chart to see relative vs. intrinsic valuation
Step 4: Peer Analysis
Study the peer comparison table to understand valuation differences
Step 5: Customize Analysis
Change valuation multiples to view from different perspectives
Step 6: Historical Context
Analyze historical chart to understand long-term valuation trends
Step 7: Form Conclusion
Synthesize peer comparisons and historical context for investment decision
Best Practices
Multiple Perspective Analysis
- Don't rely on single valuation multiple
- Test different multiples (P/E, EV/EBITDA, etc.)
- Consider industry-appropriate metrics
Historical Context
- Always check historical valuation ranges
- Understand if current levels are normal or extreme
- Consider cyclical patterns in valuation
Peer Group Validation
- Review peer group for appropriateness
- Understand why your stock might trade differently
- Consider business model differences
Combined Approach
- Use relative value alongside intrinsic value methods
- Look for consistency across different valuation approaches
- Consider both relative and absolute valuation perspectives
Key Questions the Tool Answers
- "Is this stock cheap compared to its peers?"
- Peer comparison table provides direct answer
- "Is this stock trading at historical highs or lows?"
- Historical chart shows valuation trends over time
- "What's a fair price based on peer valuations?"
- Relative Value calculation provides specific dollar target
- "Should I use P/E or EV/EBITDA for this analysis?"
- Multiple dropdown options allow testing different approaches
The Relative Value Calculator provides essential context for investment decisions by showing how stocks are valued relative to their competitive environment and historical patterns, helping you identify when market prices diverge from relative fair value.