ValueSense Intrinsic Value Tools - Reverse DCF
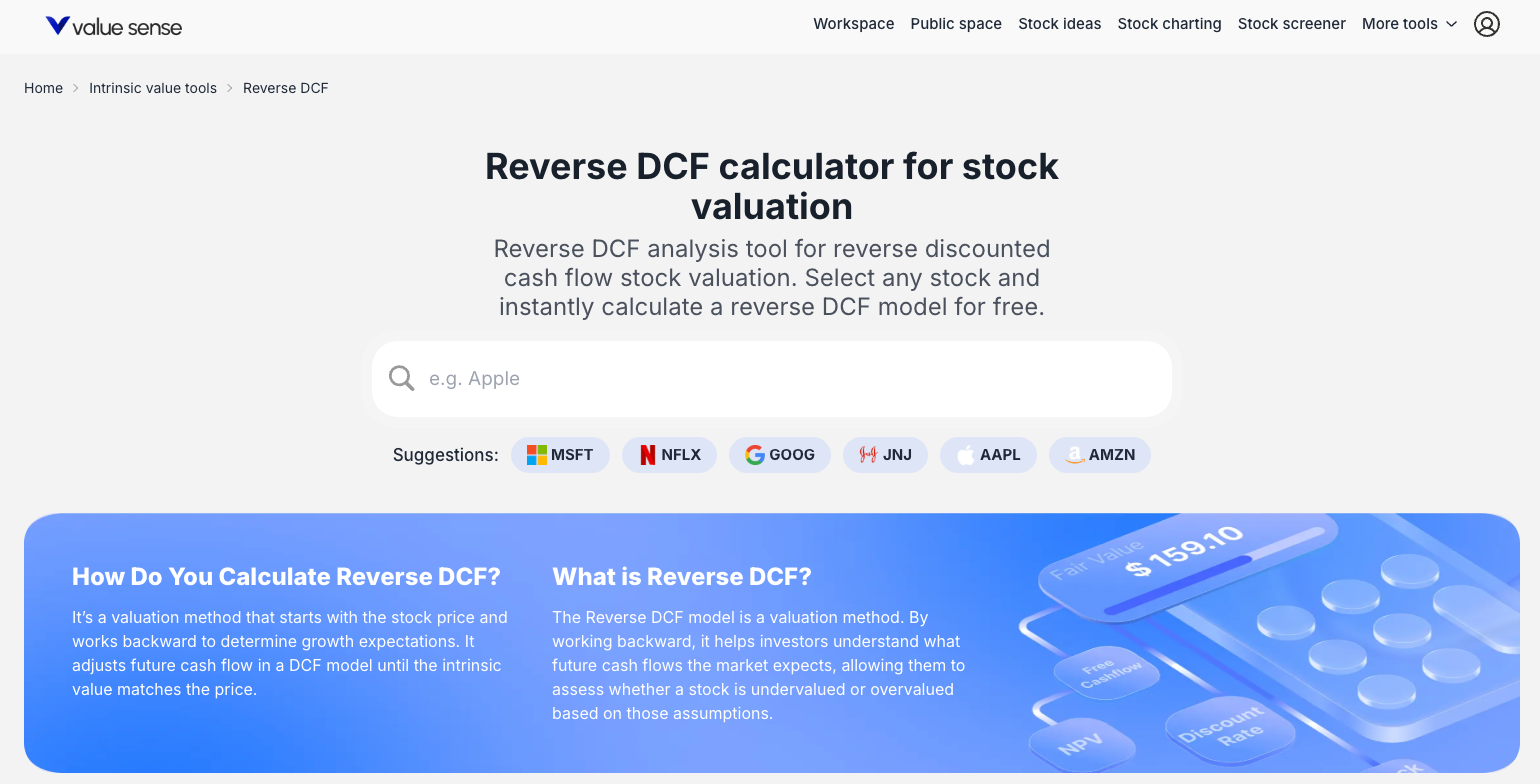
The Reverse DCF Calculator is a powerful valuation tool that helps you understand what growth expectations are embedded in a stock's current price. Instead of calculating what a stock should be worth, it works backwards from the current price to reveal the growth rate the market is implicitly expecting, helping you evaluate whether those expectations are realistic.
Accessing the Reverse DCF Calculator
From the Intrinsic Value Tools Hub
- Navigate to the Intrinsic value tools hub (
valuesense.io/intrinsic-value-tools) - Locate the "Reverse DCF" card
- Click "Find out more →" to access the main calculator page

What the Reverse DCF Calculator Does
Core Purpose
The Reverse DCF starts with a company's current stock price and works backward to determine what future growth rate (in Free Cash Flow or Revenue) the market is implicitly expecting to justify that price.
Key Question It Answers
"What growth rate does the market expect this company to achieve to justify its current stock price?"
Investment Value
This helps you evaluate whether the market's embedded growth expectations are:
- Realistic based on the company's track record
- Too aggressive (suggesting overvaluation)
- Too conservative (suggesting undervaluation)
How to Use the Calculator
Step 1: Select Your Stock
- Type a company name or ticker in the search bar (e.g., "Apple")
- Or click on suggested companies (MSFT, NFLX, GOOG)
- This loads the company's specific Reverse DCF analysis
Step 2: Review Default Results
The calculator immediately shows:
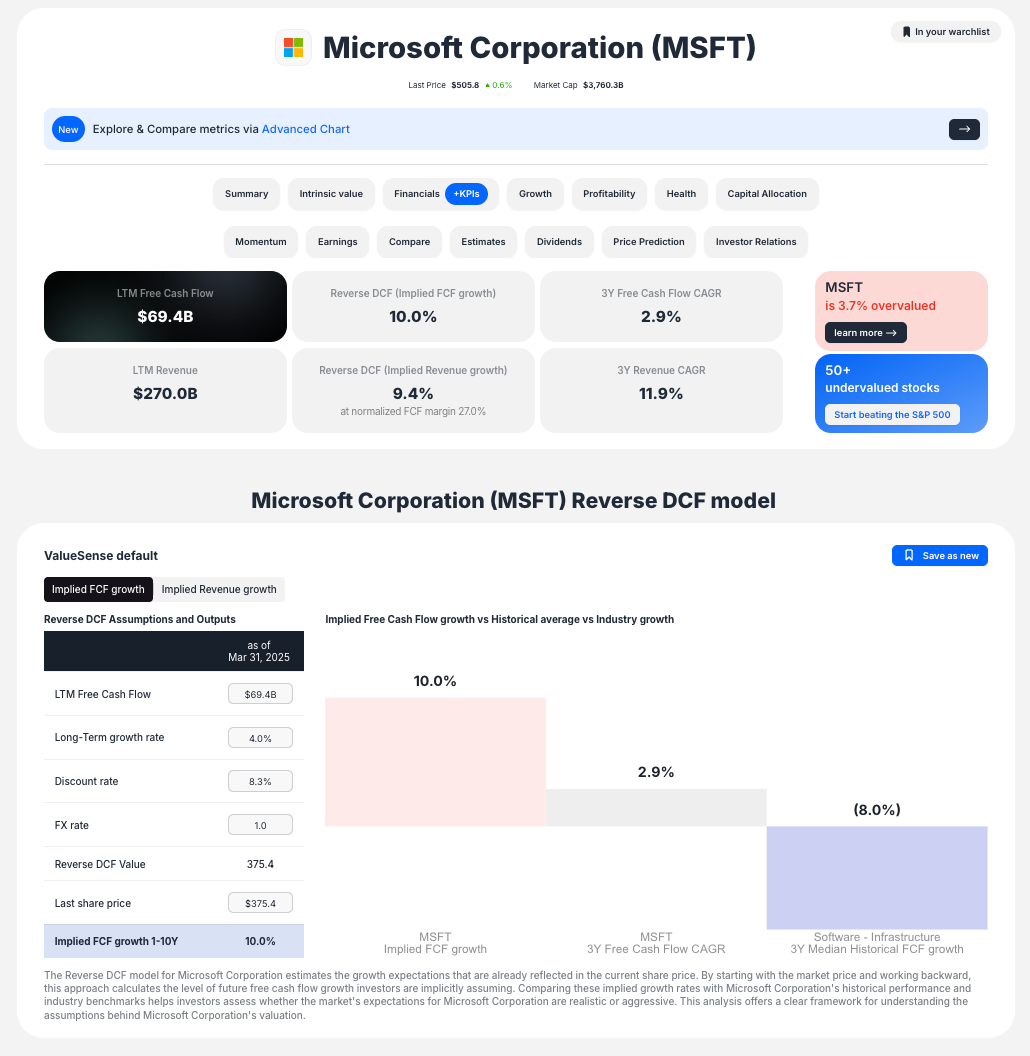
- Implied Growth Rate: The growth rate required to justify current price
- Comparison Chart: Your company vs. historical performance and industry median
- Summary Dashboard: Key metrics and valuation conclusion
Step 3: Customize Your Assumptions
Adjust key parameters to reflect your own analysis:
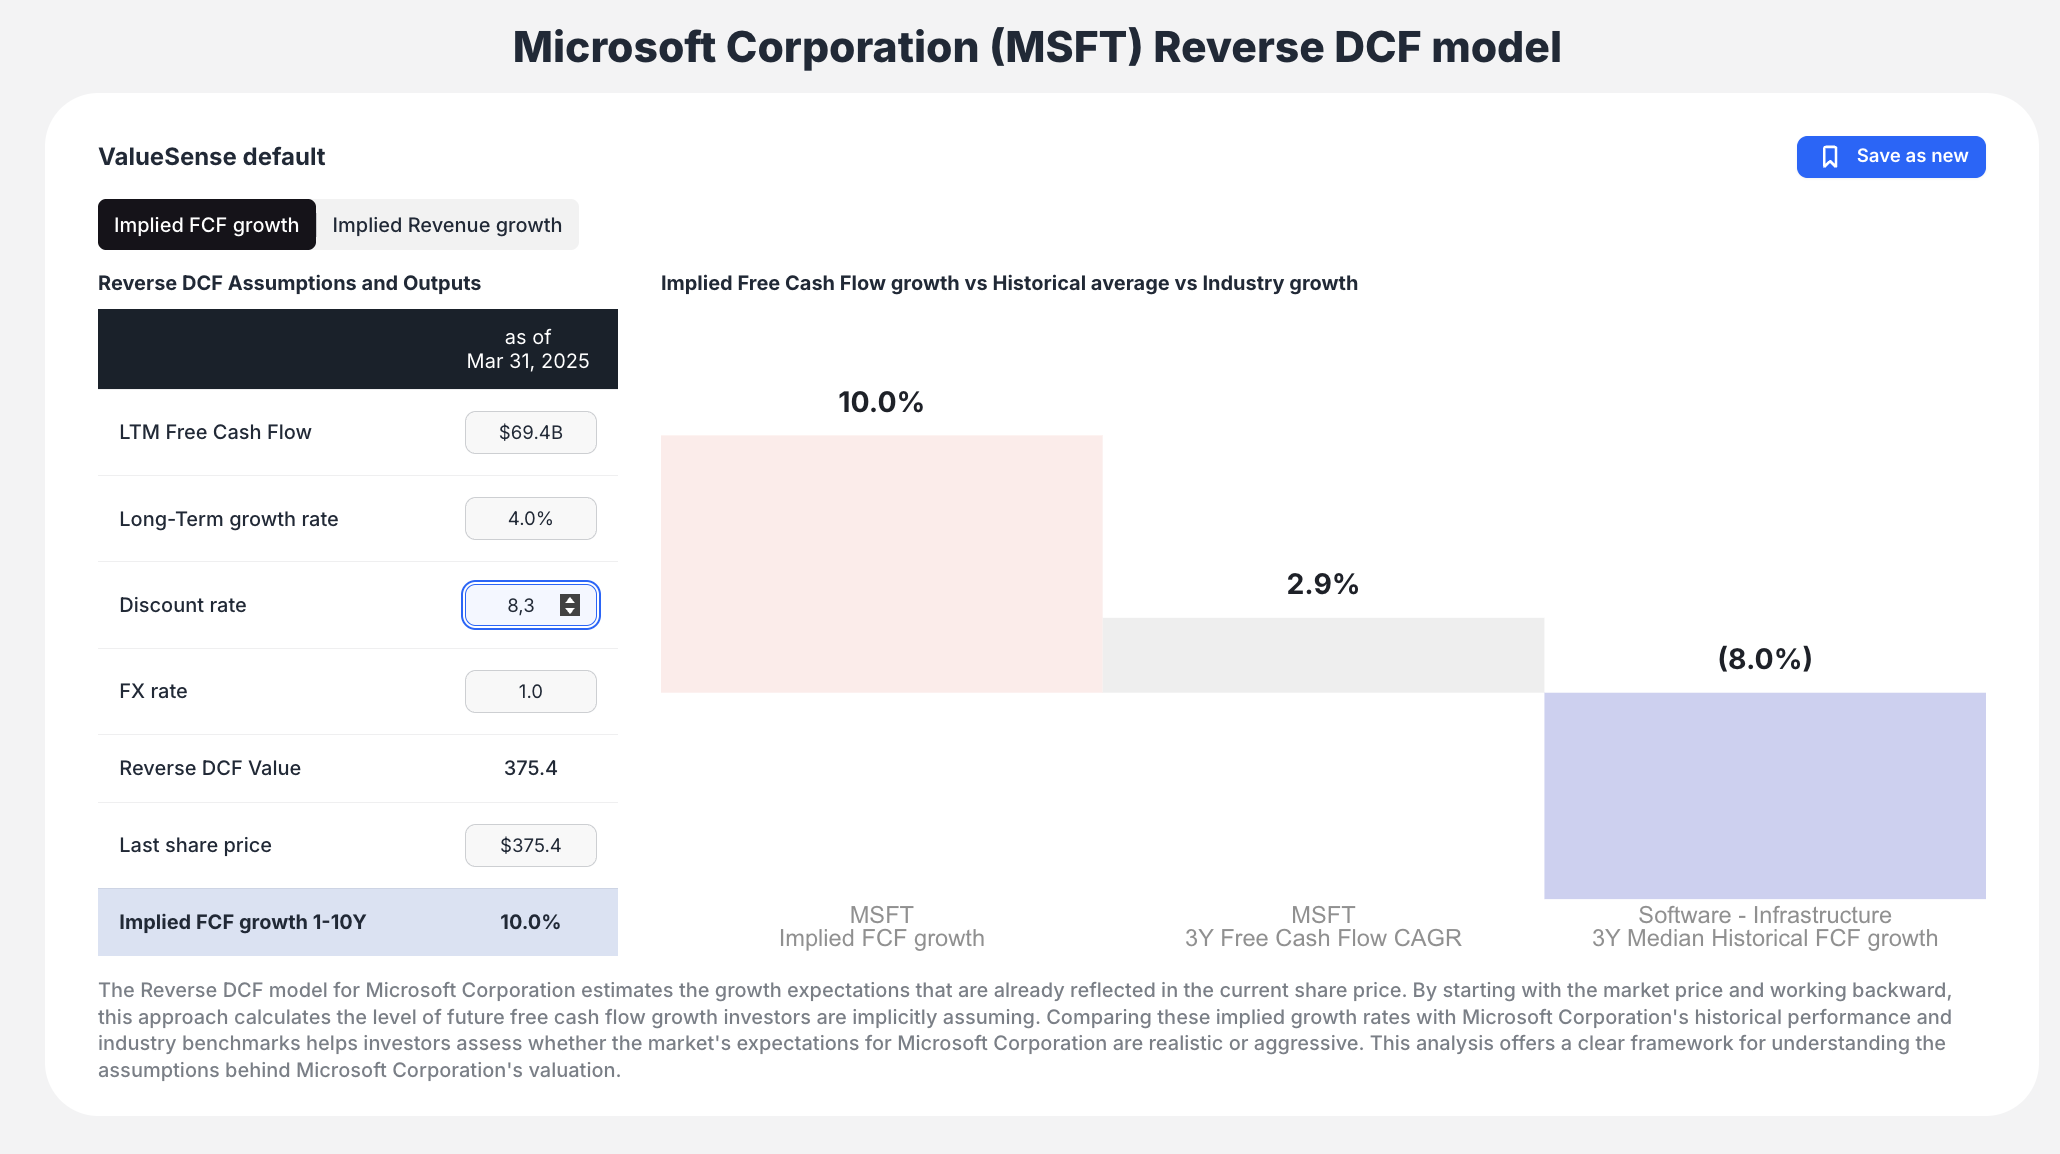
- Discount Rate: Change from default (e.g., 8.3% to 10.5%)
- Long-term Growth Rate: Terminal growth rate assumption
- Normalized FCF Margin: For revenue-based analysis
- F/X Rate: Currency considerations
Key Features and Outputs
Primary Output: Implied Growth Rate
- Implied FCF Growth 1-10Y: Free cash flow growth required
- Implied Revenue Growth 1-10Y: Revenue growth required
- Real-time updates as you modify assumptions
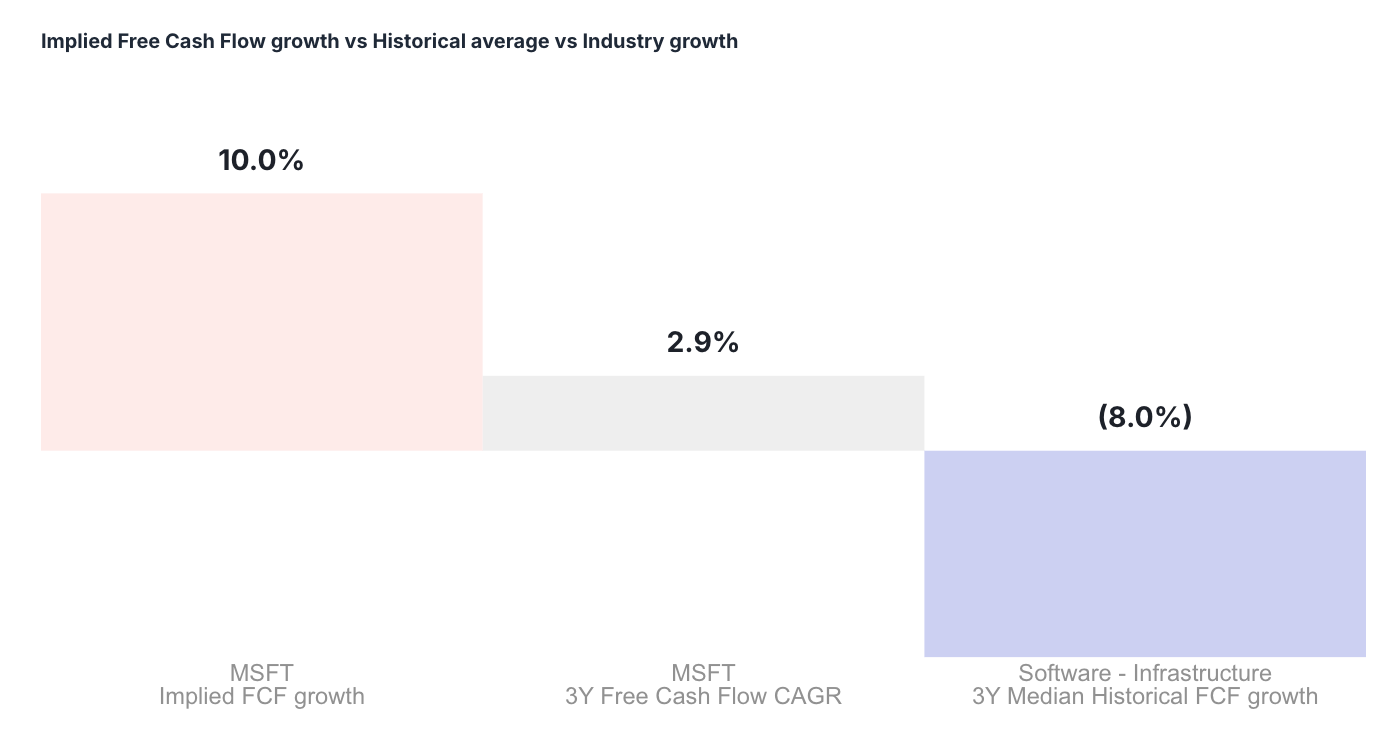
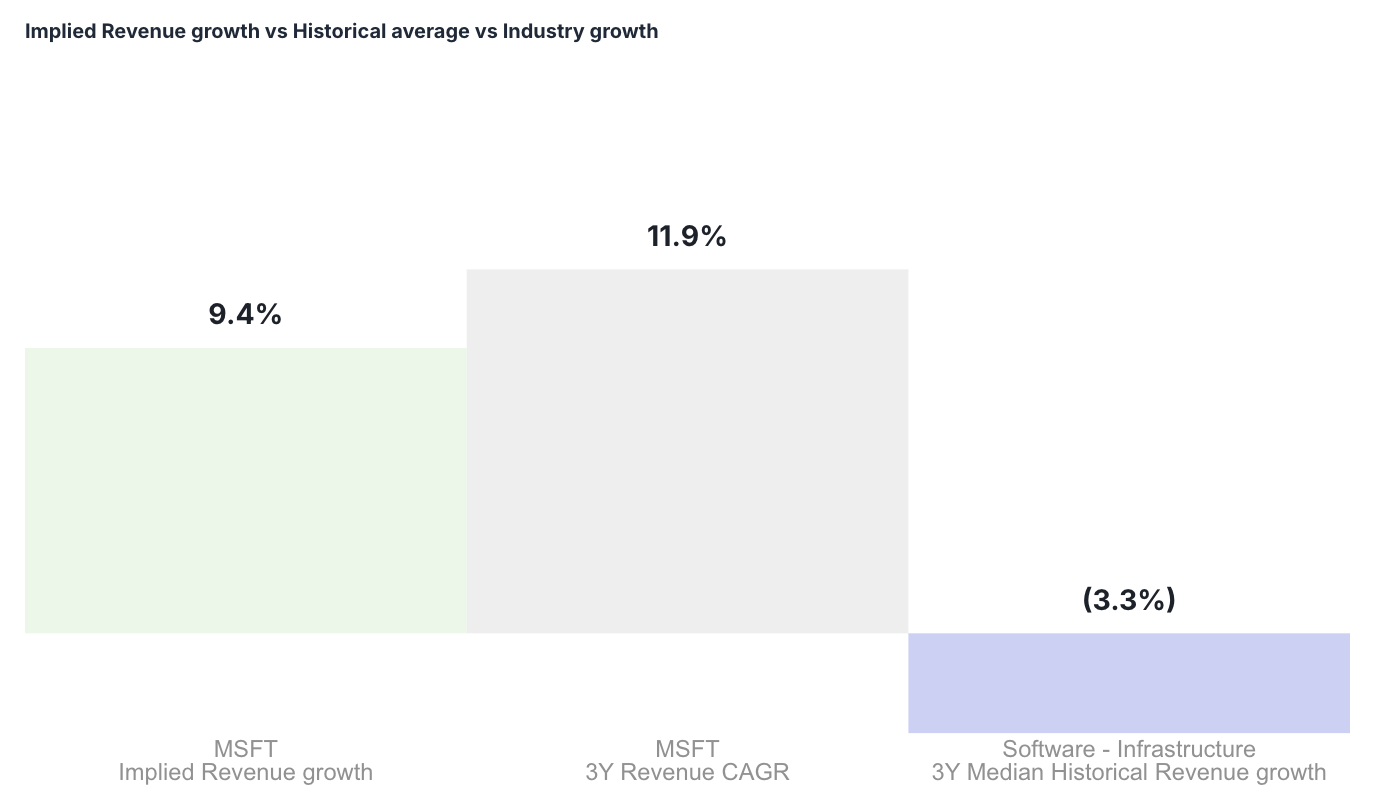
Visual Comparison Chart
Critical feature that benchmarks the implied growth against:
- Company's Historical Growth: e.g., "MSFT 3Y Free Cash Flow CAGR (2.9%)"
- Industry Median Growth: e.g., "Software - infrastructure 3Y Median Historical FCF growth (8.0%)"
Summary Dashboard
- LTM Free Cash Flow
- Reverse DCF implied growth
- Valuation conclusion (e.g., "MSFT is 3.7% overvalued")
Peer Comparison Table
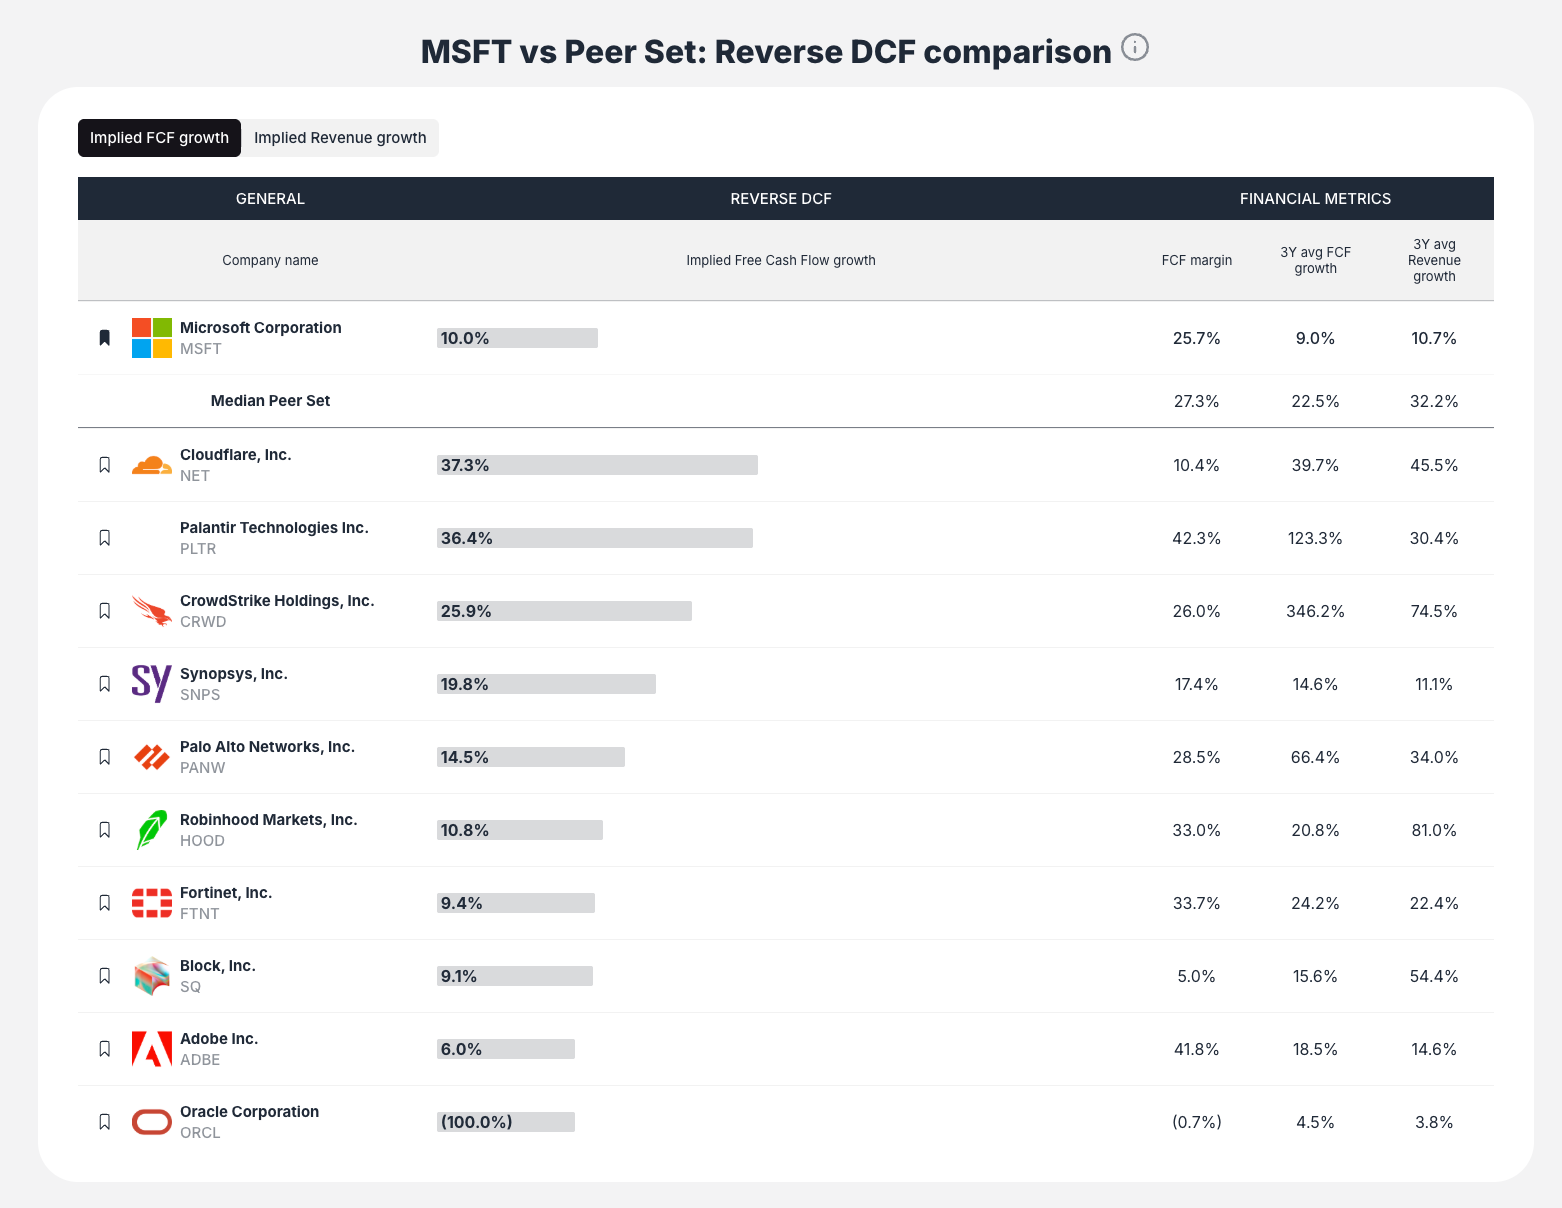
- Compare implied growth rates across peer companies
- FCF margins and historical growth comparisons
- Industry context for your analysis
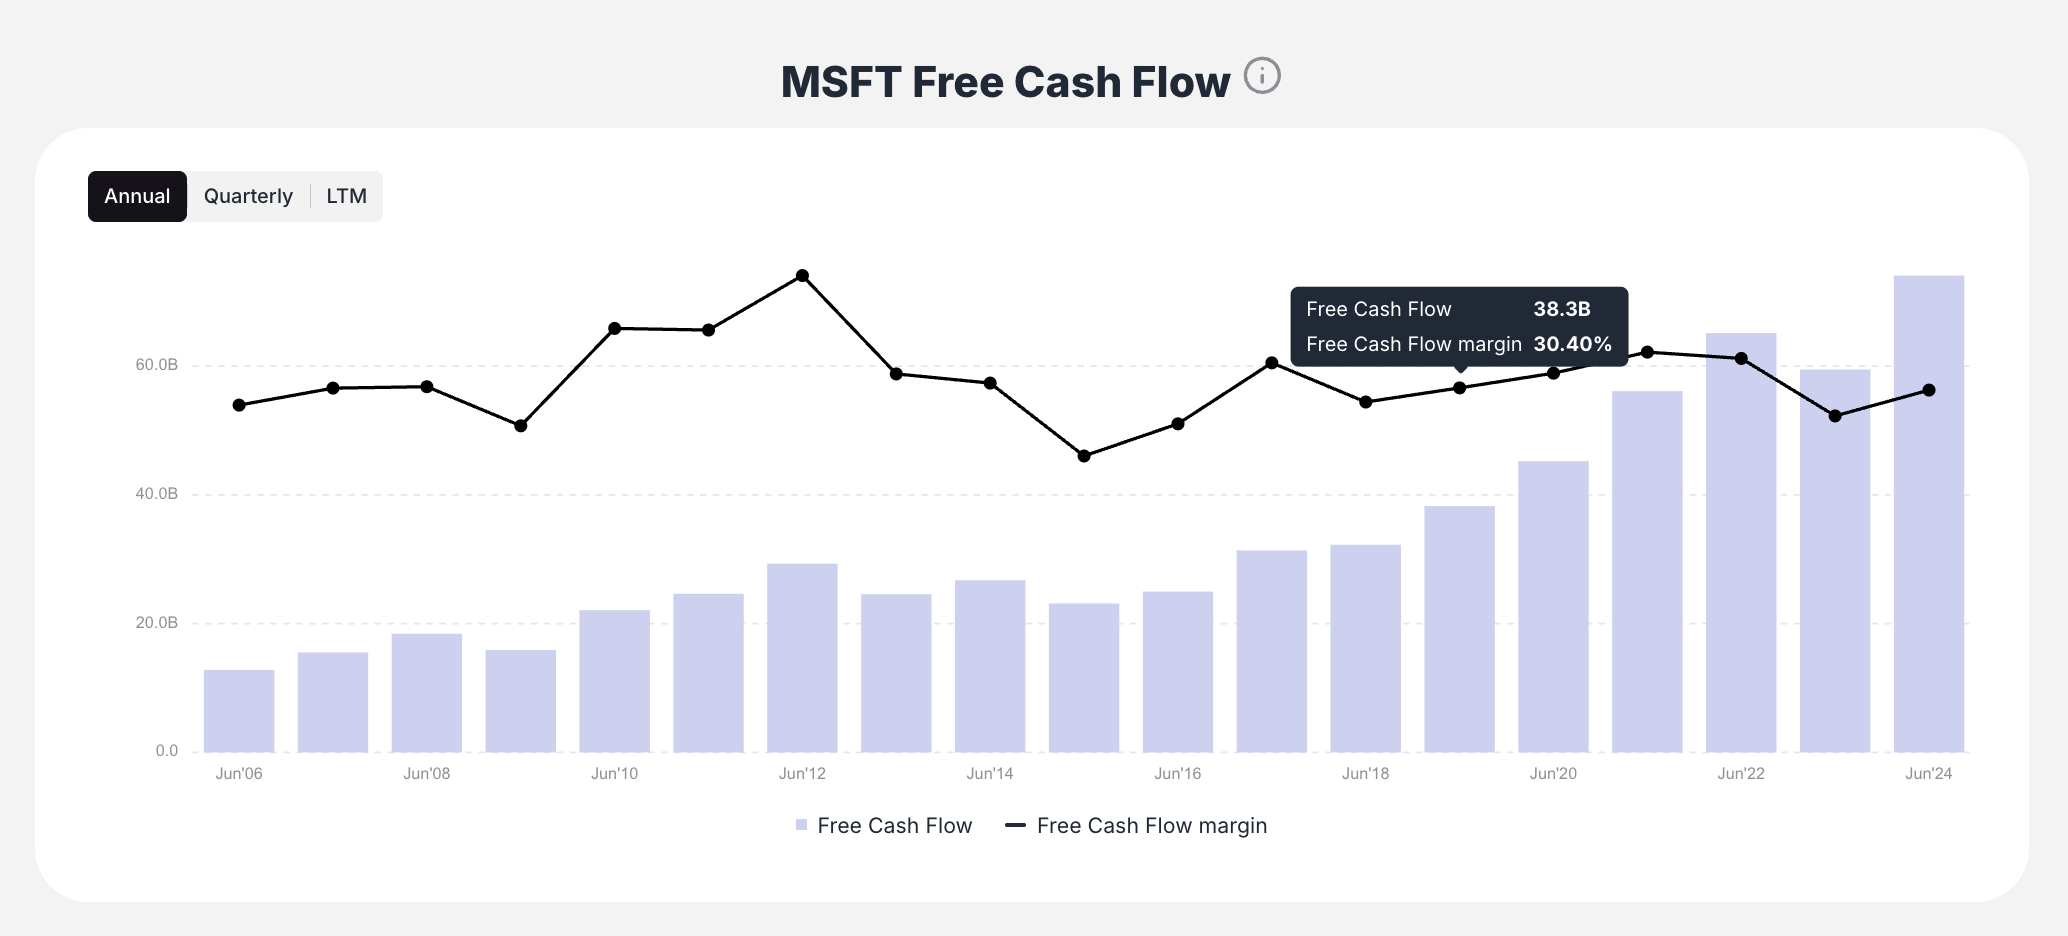
Historical Context Charts
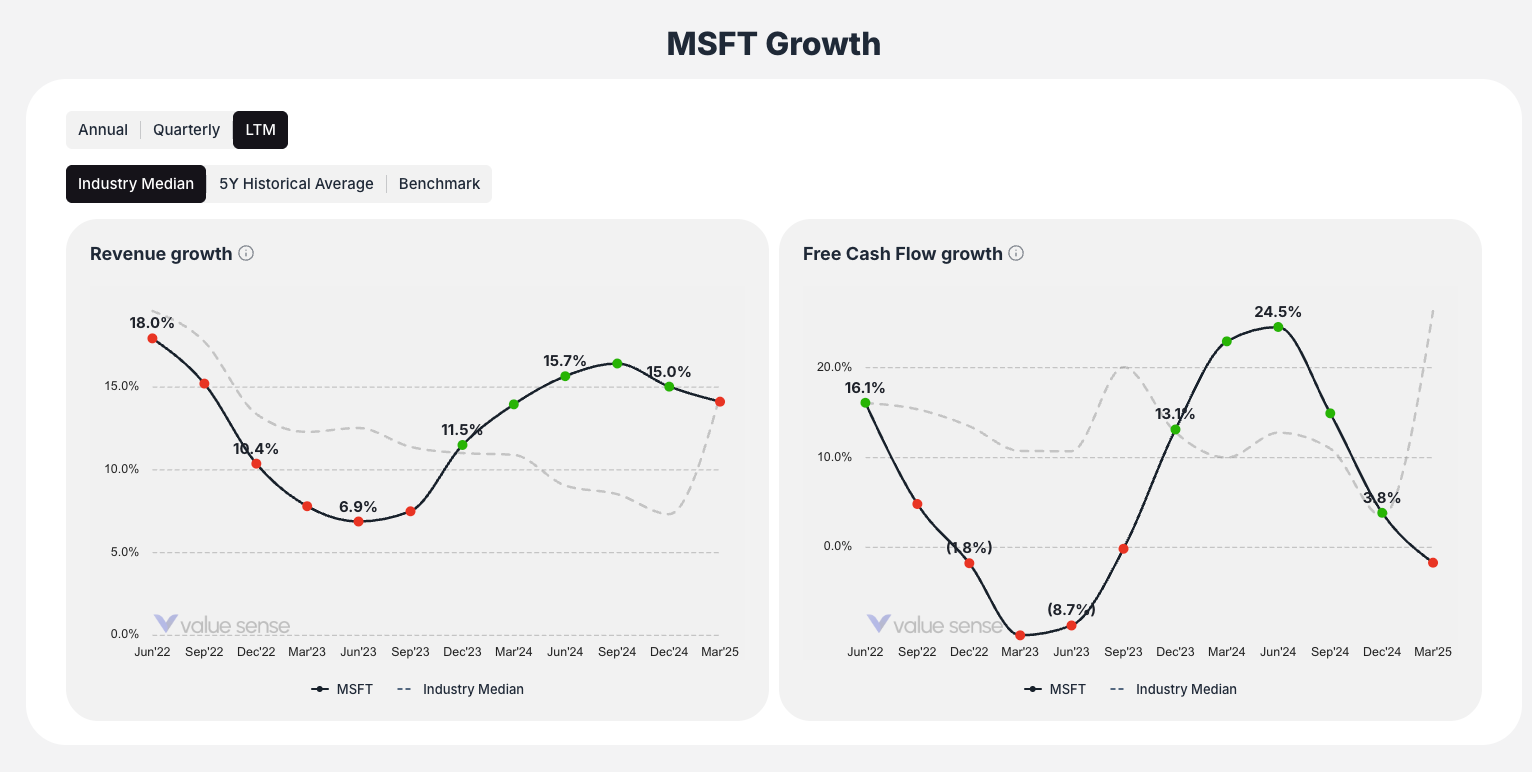
- Historical Free Cash Flow trends
- Growth patterns (Revenue and FCF)
- Visual context for your assumptions
Dual-Mode Analysis
Implied FCF Growth Mode
- Focuses on free cash flow growth requirements
- Best for companies with predictable cash conversion
- Direct cash flow projection methodology
Implied Revenue Growth Mode
- Focuses on revenue growth requirements
- Converts to FCF using normalized margin assumptions
- Useful for growth companies or margin expansion stories
Understanding the Methodology
Core Assumptions
- LTM Free Cash Flow: Starting point for projections
- Discount Rate (WACC): Cost of capital for discounting
- Long-term Growth Rate: Terminal growth assumption (typically 4.0%)
- Current Share Price: Fixed target for the calculation
Calculation Process
- Takes current stock price as the target present value
- Uses your discount rate and growth assumptions
- Calculates what growth rate in FCF/Revenue is needed
- Compares this to historical and industry benchmarks