ValueSense features - Stock screener
ValueSense's Stock Screener is a powerful tool that helps you find investment opportunities by filtering stocks based on fundamental criteria. Whether you're looking for undervalued companies, dividend champions, or growth stocks, the screener provides both quick-start options and detailed customization capabilities.
Getting Started with Stock Screener
Access the Feature
Navigate to "Stock screener" in the main navigation menu at the top of the page.
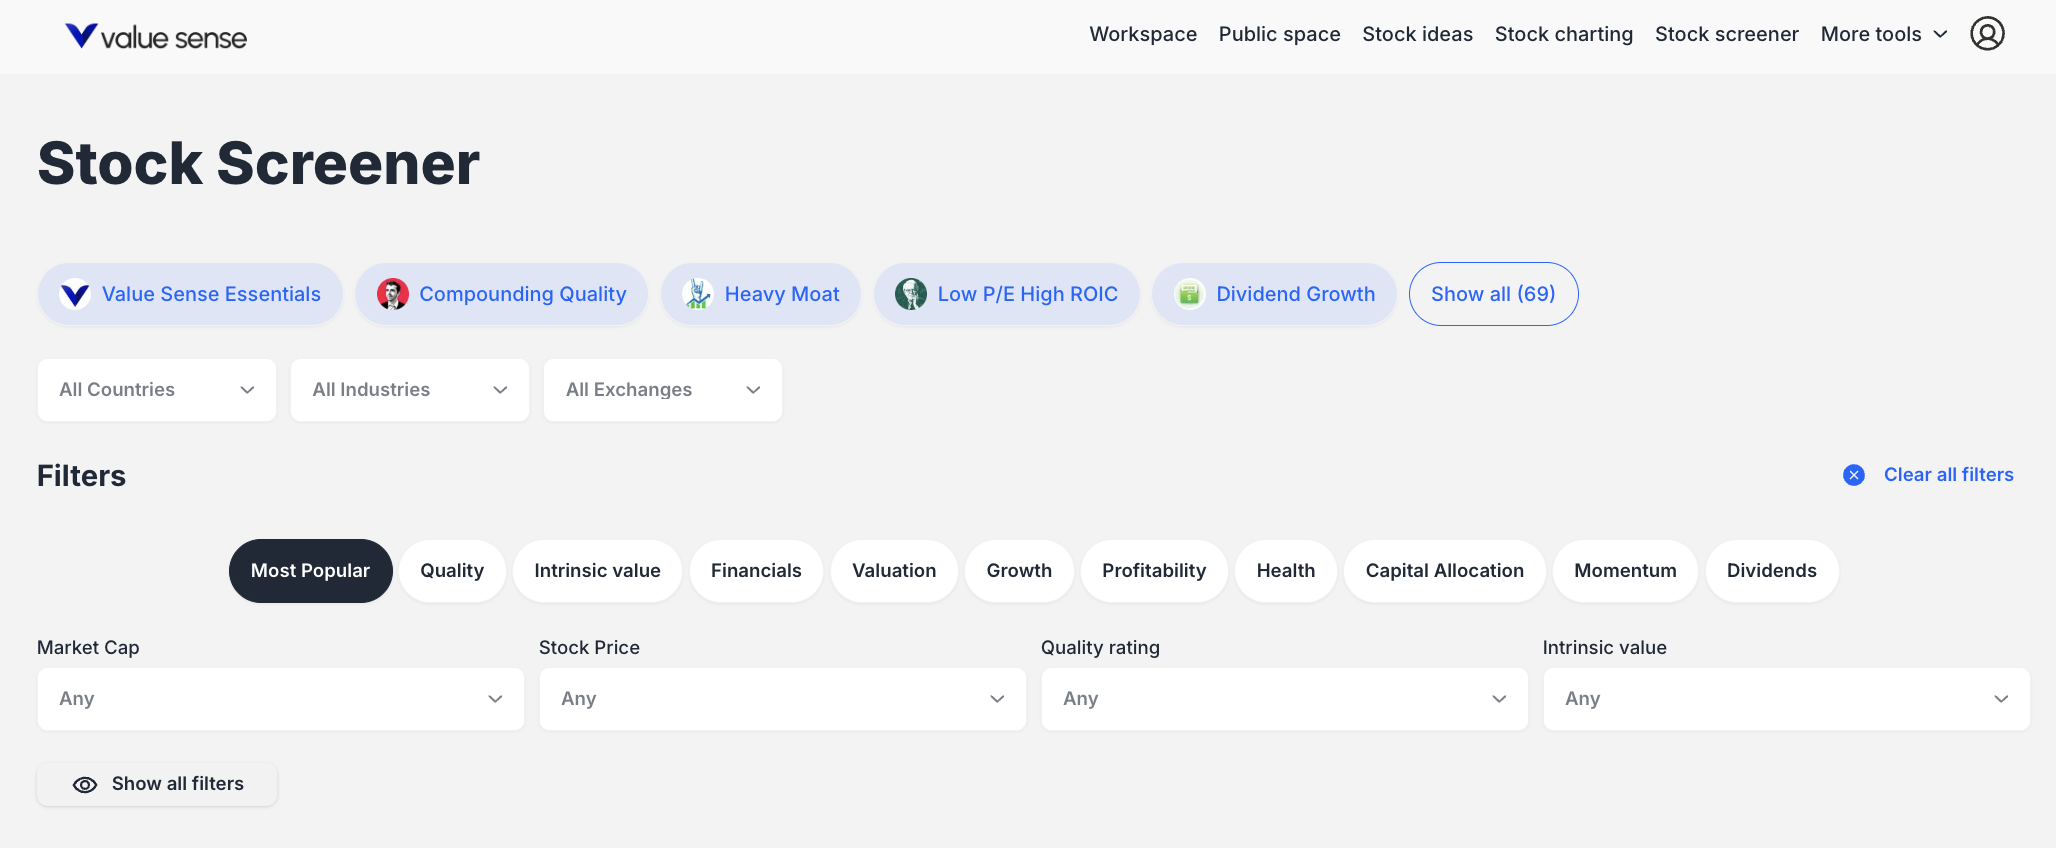
Two Ways to Screen Stocks
1/ Pre-set Screeners: Choose from 69+ professionally curated screens organized by categories:
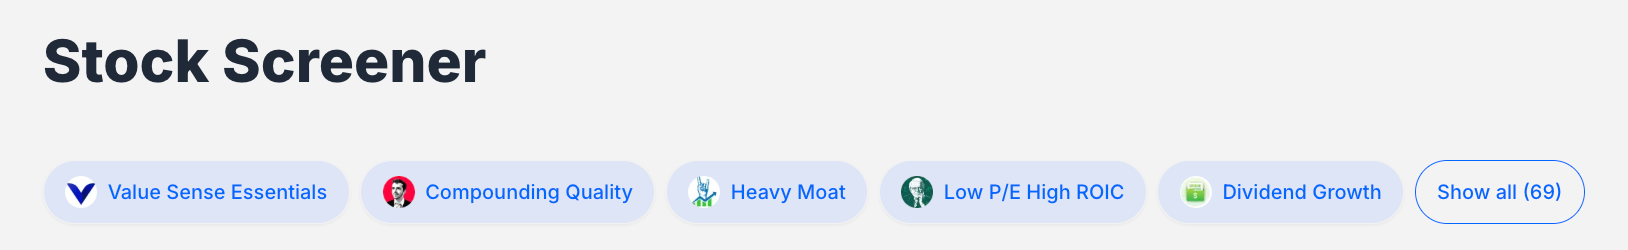
- Quality: Value Sense Essentials, Compounding Quality, Heavy Moat
- Value: Value Stocks, Low P/E Ratio Stocks
- Dividend: Dividend Growth, High Dividend Yield Stocks
- Market Cap: Large Cap, Small Cap Growth Stocks
- Budget-Friendly: Stocks Under $5, Stocks Under $10
- Momentum: Best Performing Stocks YTD, 52 Week High Stocks
- Beginner-Friendly: Best S&P 500 Stocks, Safe Stocks for Beginners
2/ Custom Filters: Build your own screen using organized filter categories:
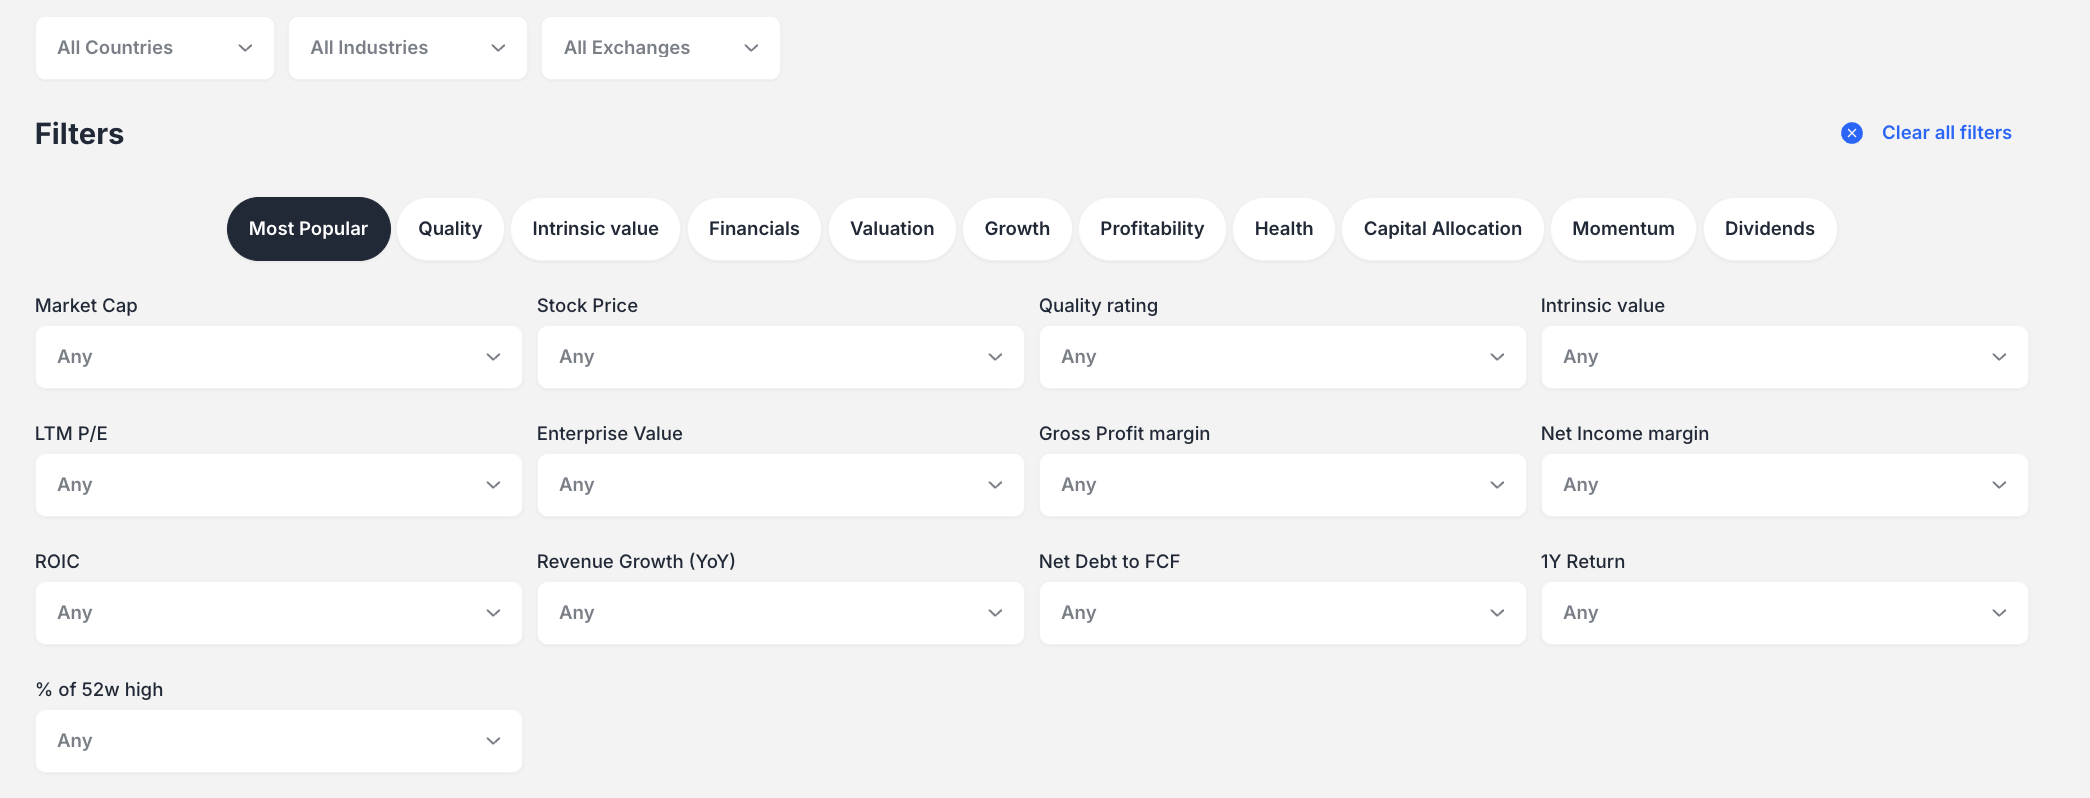
- Most Popular: Market Cap, Stock Price, Quality rating, Intrinsic value
- Quality: Quality rating, ROIC, Gross Profitability
- Intrinsic Value: Undervalued percentages, DCF Value, Ben Graham fair value
- Financials: Revenue, Free Cash Flow, Net Debt
- Health: Health rating, Current ratio, Quick ratio
- And more categories for Valuation, Growth, Profitability, Dividends
How to Create a Custom Screen
- Select Filter Categories: Click on tabs like "Most Popular," "Quality," or "Health"
- Set Criteria: Use dropdowns to select specific values (e.g., "Mid Cap ($2B to $10B)")
- Apply Multiple Filters: Add criteria from different categories as needed
- Update Results: Click "Update screener results" to run your screen
- Save Your Work: Use "Save to workspace" to preserve your custom screen
Analyzing Your Results
Data Table Views Switch between different data perspectives using result tabs:
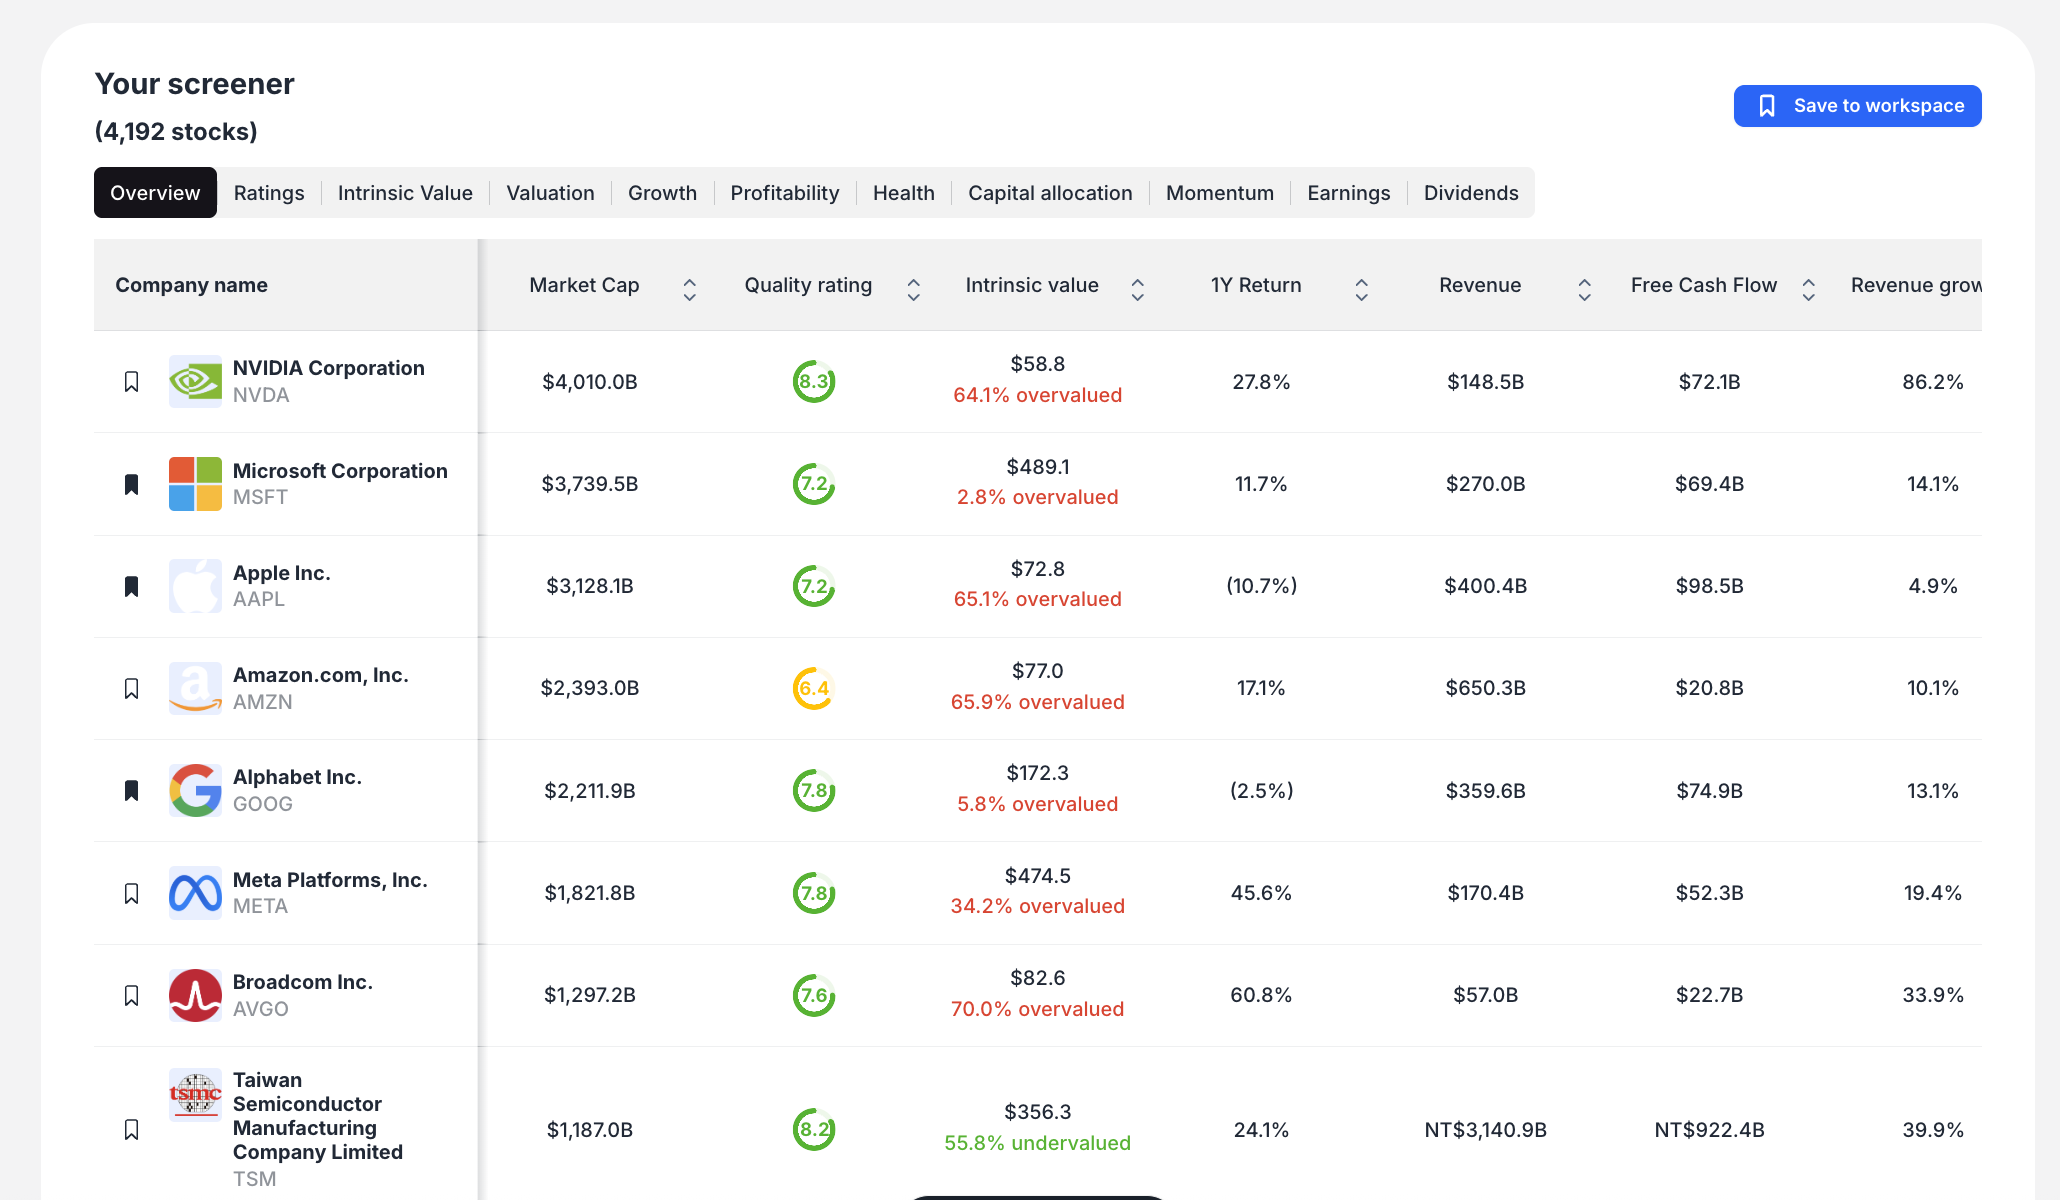
- Overview: Basic company information and key metrics
- Ratings: ValueSense quality, growth, and health ratings
- Intrinsic Value: Valuation analysis and fair value estimates
- Growth: Revenue and earnings growth metrics
- Profitability: Margin analysis and return metrics
- Health: Financial stability indicators
Visual Analysis Tools
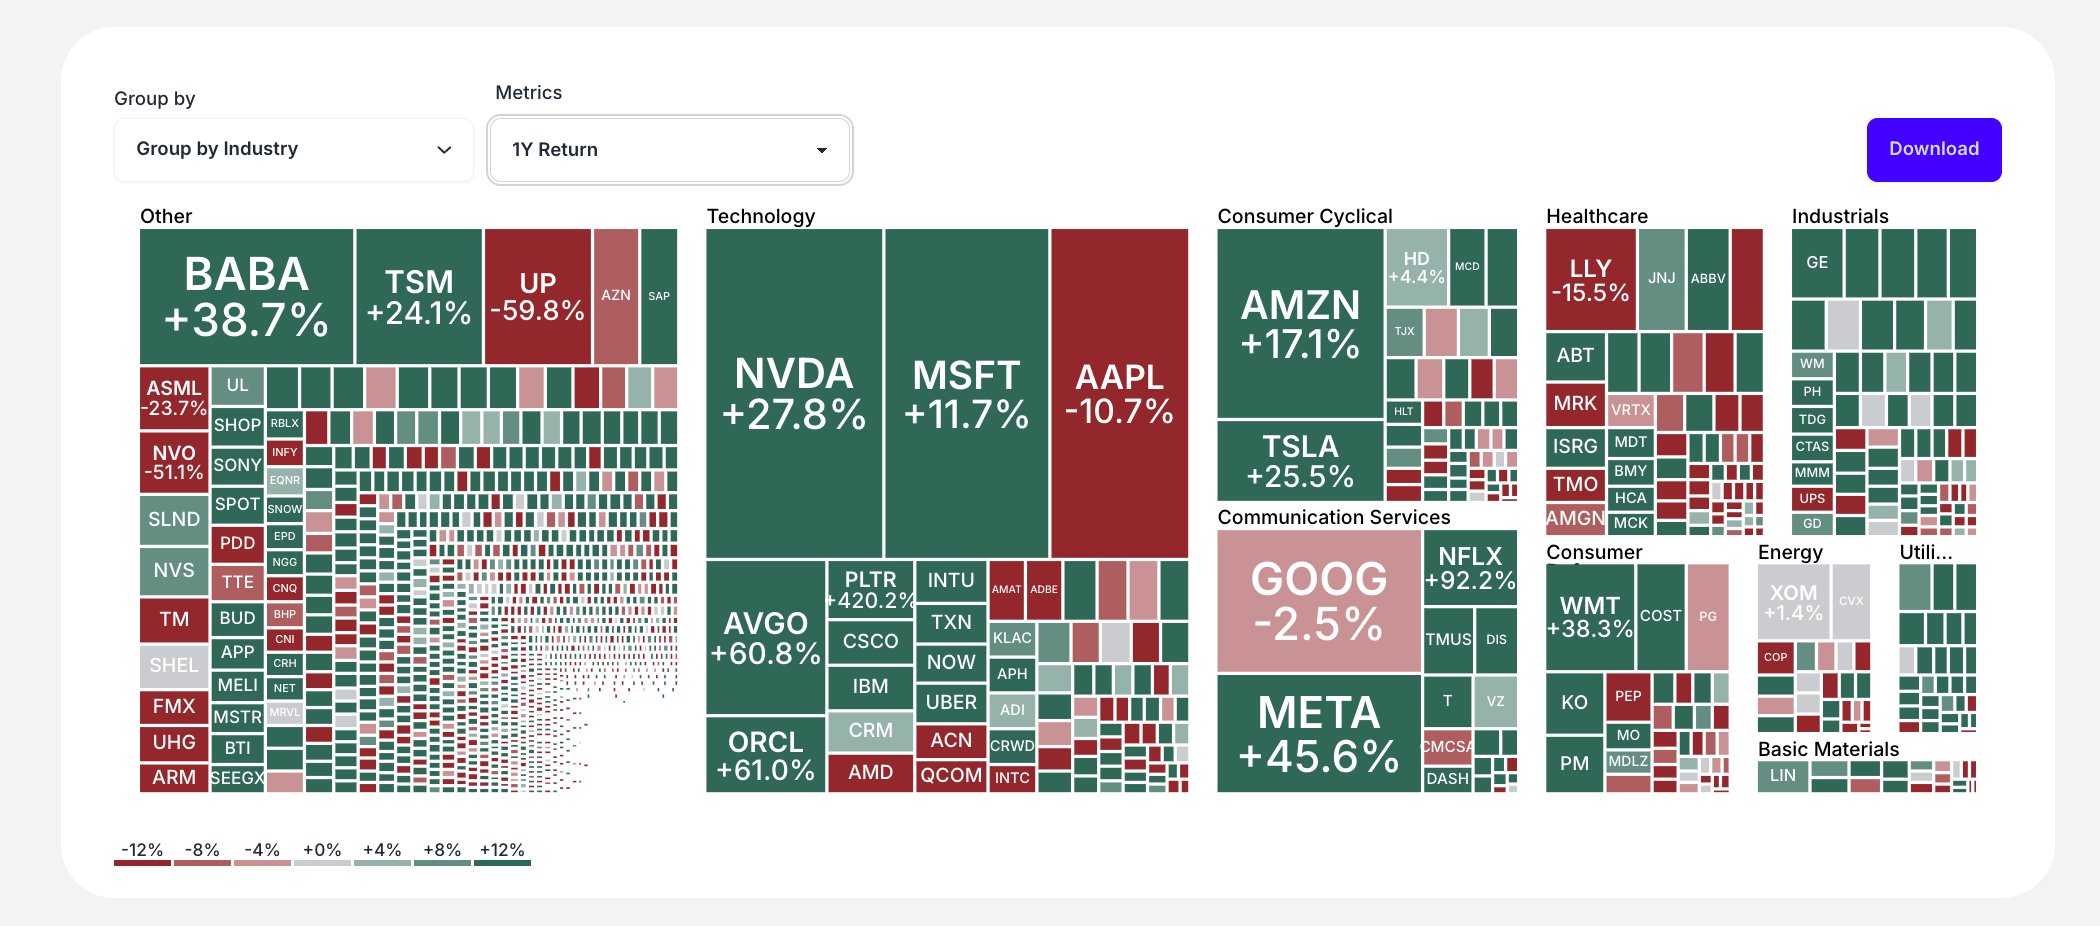
- Heat Map: Color-coded performance visualization grouped by industry
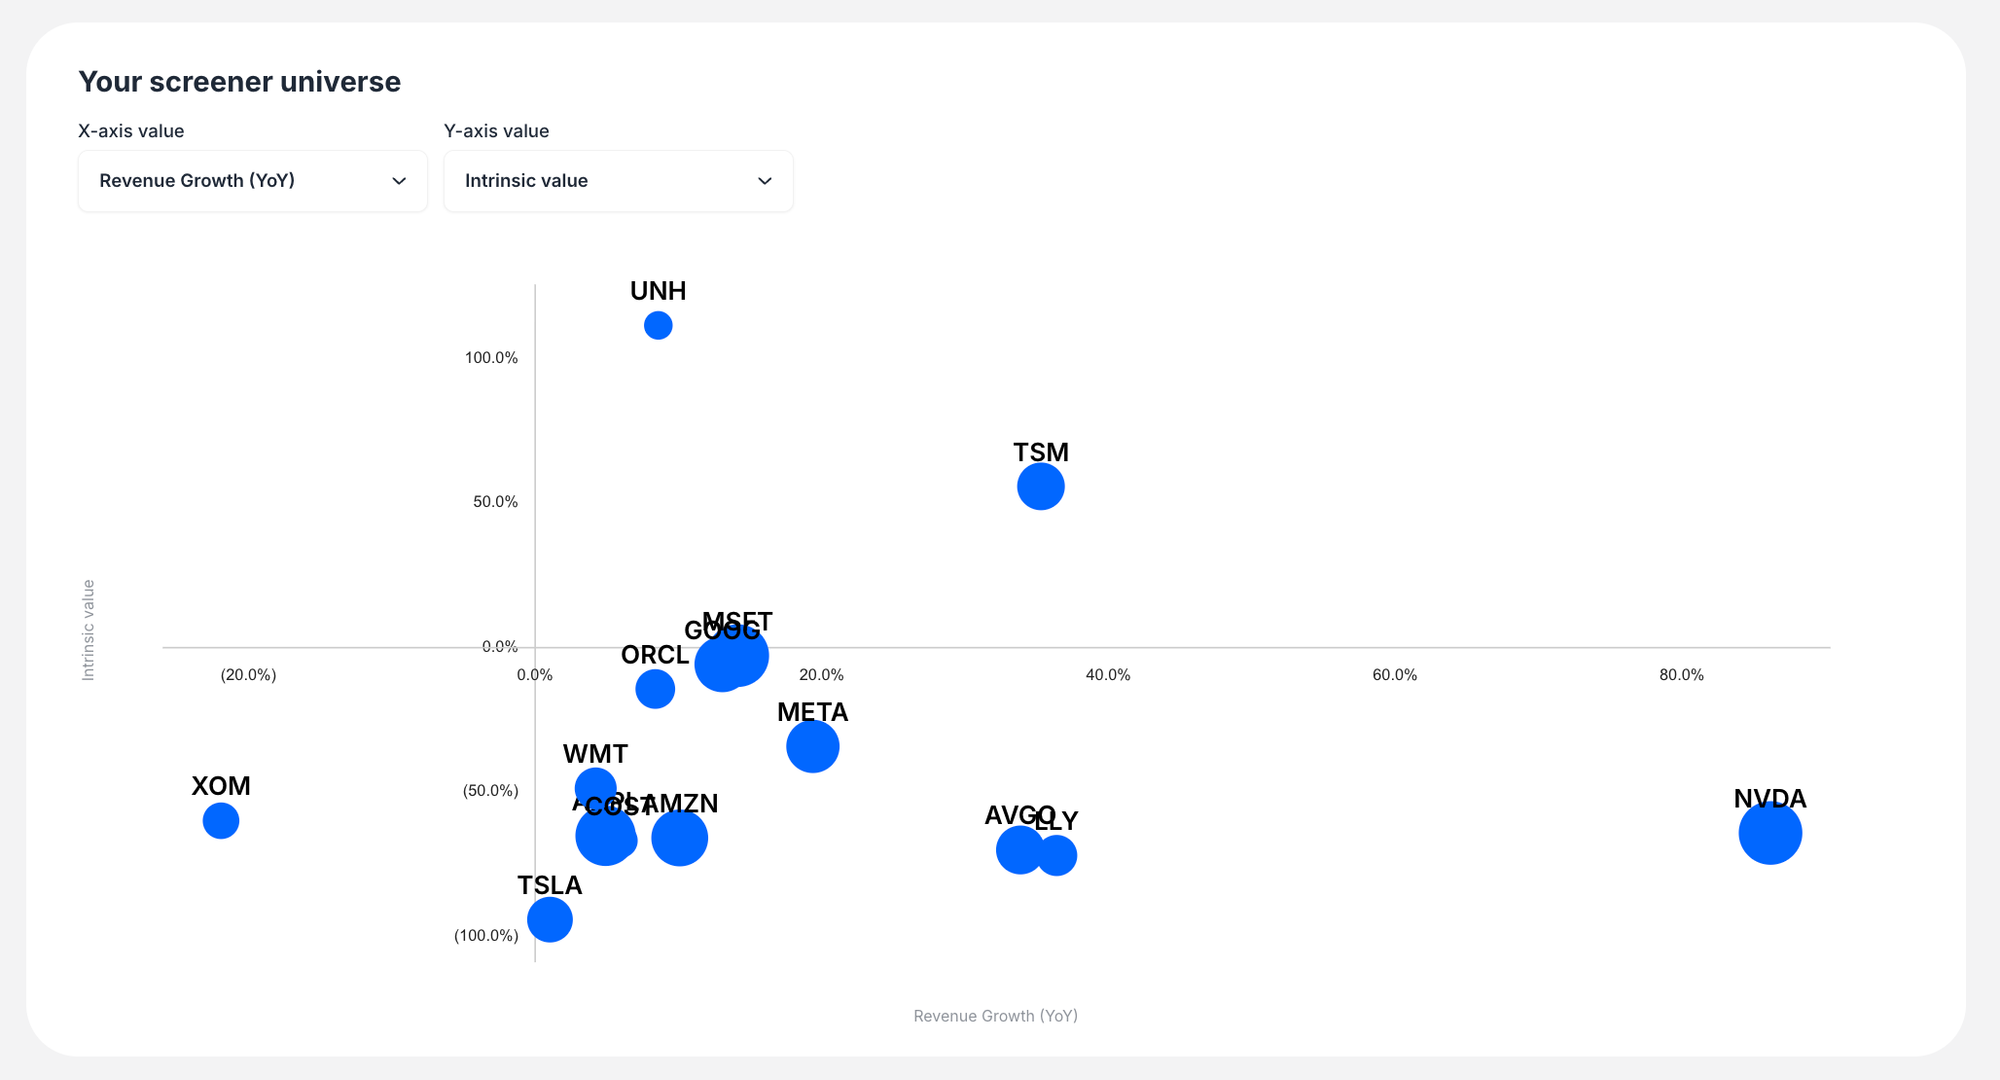
- Scatter Plot: Two-dimensional analysis to identify relationships between metrics
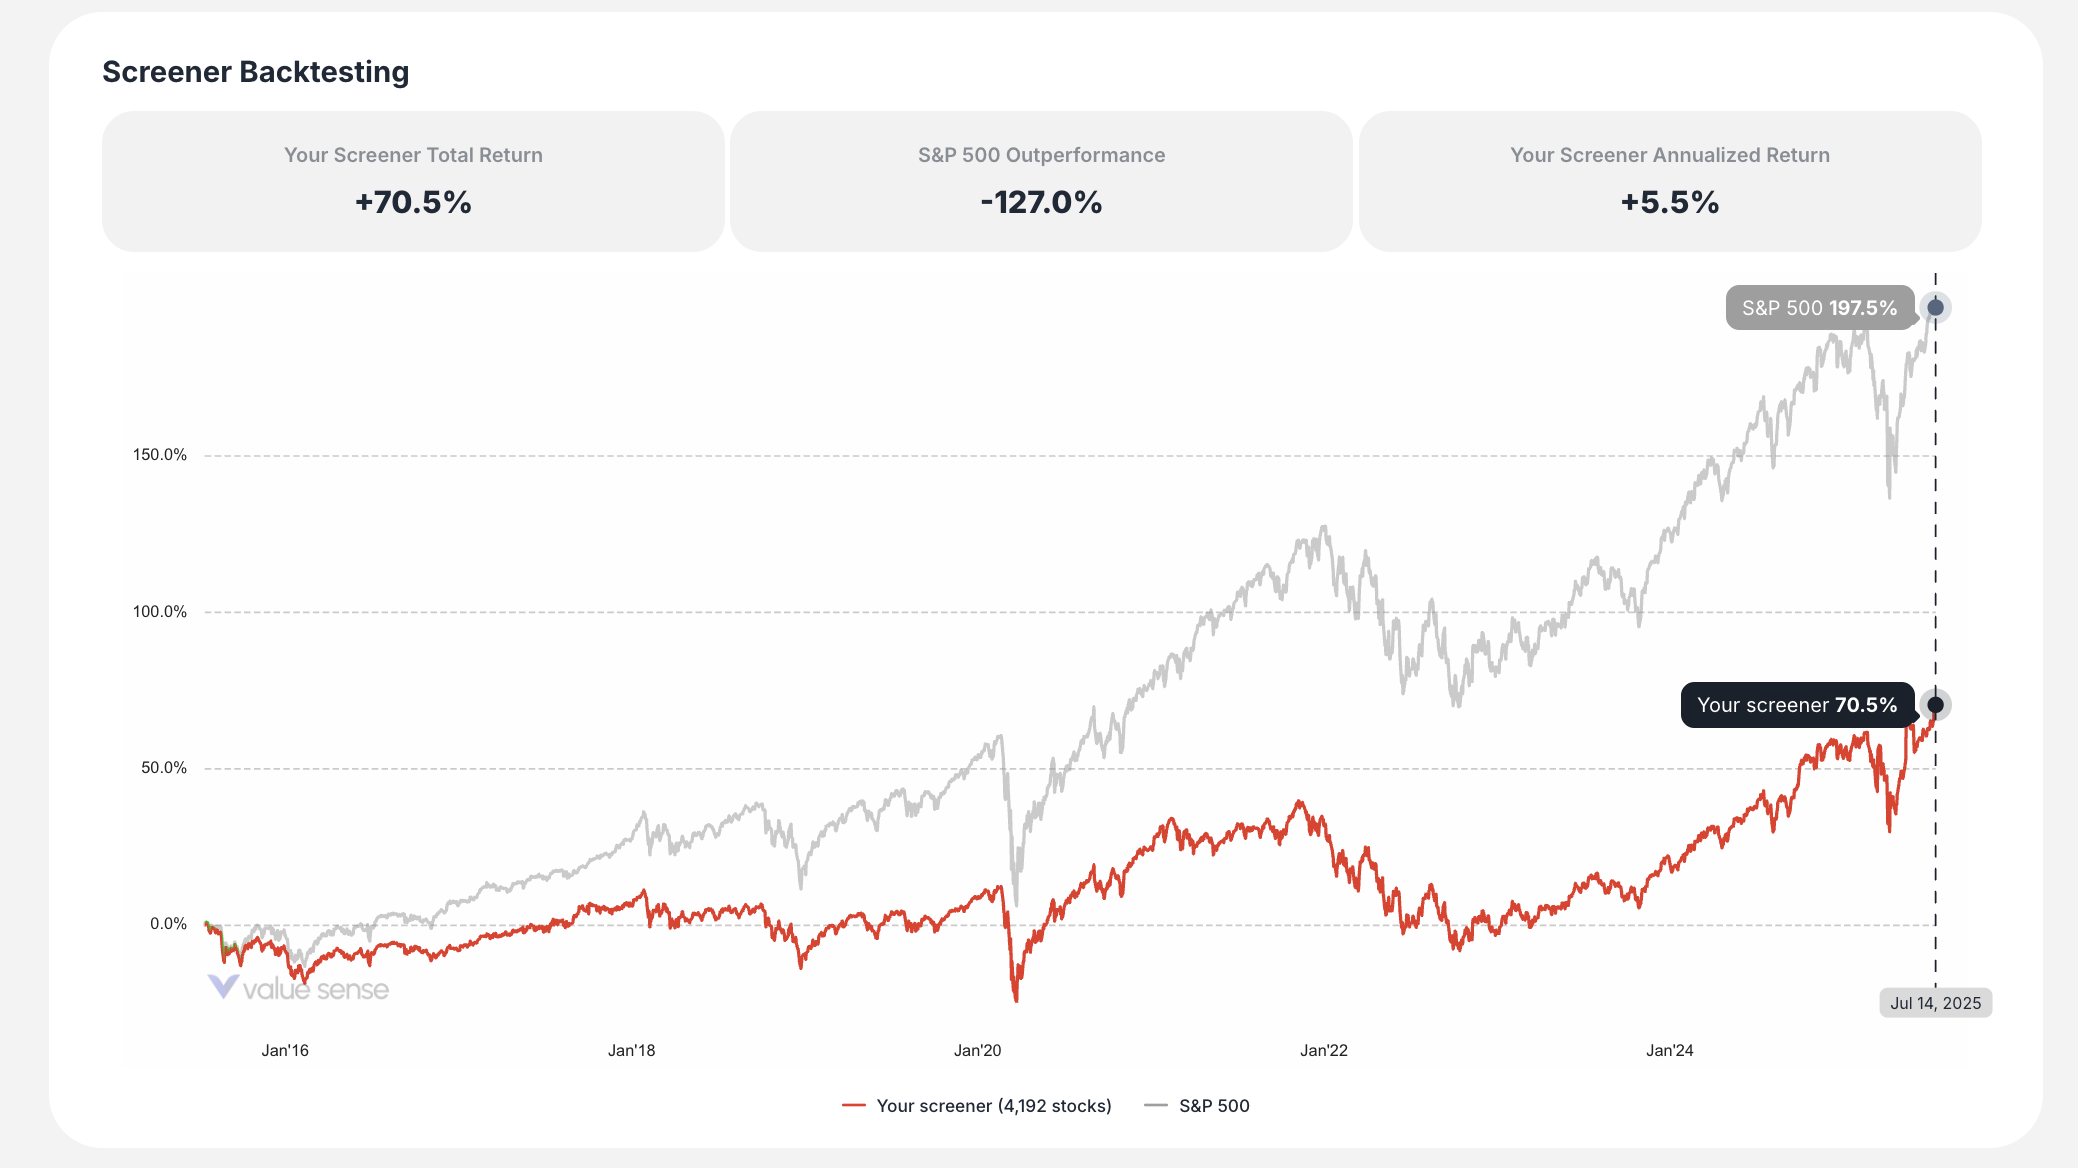
- Backtesting Chart: Historical performance comparison of your screener vs. S&P 500
Key Features
Powerful Backtesting: Every screen automatically shows how that investment strategy would have performed historically compared to the S&P 500, helping you validate your screening criteria.
Multi-Dimensional Results: Beyond simple lists, explore your results through customizable data tables, visual heat maps, and scatter plots to uncover insights and correlations.
Save and Reuse: Save your custom screeners to workspace for future monitoring and analysis.
Global Filters: Apply broad filters for Country, Industry, and Exchange before diving into specific fundamental criteria.
Example Workflow
- Navigate to Stock Screener
- Set custom filters:
- Market Cap: Mid Cap ($2B to $10B)
- Intrinsic Value: Undervalued (10% to 50%)
- Health Rating: Good (4-6)
- Click "Update screener results"
- Review the filtered results in the data table
- Analyze the heat map grouped by industry
- Check the backtesting performance
- Save the screen to your workspace
The Stock Screener transforms complex fundamental analysis into an intuitive, visual experience that helps you discover investment opportunities aligned with your specific criteria.