
Viking Global Investors Portfolio Q3'2025: Top Holdings & Recent Changes
Welcome to the Value Sense Blog, your resource for insights on the stock market! At Value Sense, we focus on intrinsic value tools and offer stock ideas with undervalued companies. Dive into our research products and learn more about our unique approach at [valuesense.io]
Explore diverse stock ideas covering technology, healthcare, and commodities sectors. Our insights are crafted to help investors spot opportunities in undervalued growth stocks, enhancing potential returns. Visit us to see evaluations and in-depth market research.
Viking Global Investors, led by founder Andreas Halvorsen, showcases its signature high-conviction, dynamic approach in the latest 13F filing. The firm's $38.5B portfolio for Q3 2025 reveals aggressive expansions in financial services giants and select technology names, with turnover at 38.5% signaling active position management amid market volatility.
Portfolio Snapshot: Financial Power Plays Dominate
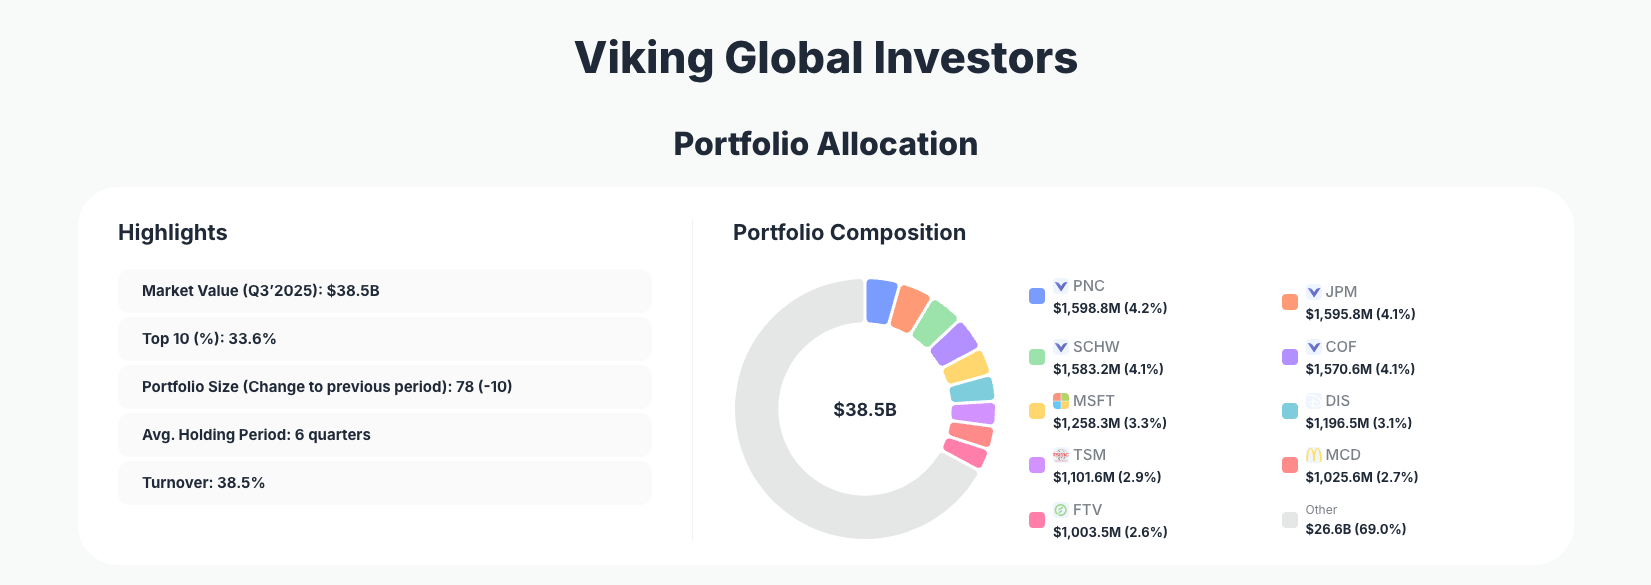
Portfolio Highlights (Q3’2025): - Market Value: $38.5B - Top 10 Holdings: 33.6% - Portfolio Size: 78 -10 - Average Holding Period: 6 quarters - Turnover: 38.5%
Viking Global's Q3 2025 portfolio maintains a diversified yet focused structure across 78 positions, down 10 from the prior quarter, indicating deliberate trimming of underperformers. The top 10 holdings represent 33.6% of the portfolio, reflecting a balanced concentration that avoids over-reliance on any single name while prioritizing high-conviction bets. With an average holding period of 6 quarters and elevated turnover of 38.5%, the firm demonstrates disciplined rotation—exiting 10 positions while scaling into financials and tech amid economic uncertainty.
This strategy aligns with Viking's long-standing approach of blending growth and value, heavily weighting sectors resilient to interest rate shifts and digital transformation. The reduction in portfolio size suggests risk management, pruning smaller stakes to fund larger convictions like banking leaders. Investors tracking Viking via ValueSense's superinvestor tools can see how these metrics signal adaptability in a high-rate environment.
Top Positions Breakdown: Banking Boom Meets Tech Resilience
Viking's portfolio pivots heavily toward financial services, with standout increases across major banks and related firms. Leading the changes is PNC at 4.2% after an explosive Add 234.93%, holding $1,598.8M in shares. Close behind, JPM (4.1%, Add 25.16%, $1,595.8M) and SCHW (4.1%, Add 5.13%, $1,583.2M) underscore a banking sector conviction, followed by COF (4.1%, Add 30.28%, $1,570.6M).
Technology and consumer staples round out the activity, with MSFT surging to 3.3% on a massive Add 255.22% $1,258.3M, signaling big tech optimism. DIS (3.1%, Add 78.69%, $1,196.5M) and APD (2.6%, Add 70.23%, $1,000.1M) show consumer and industrial exposure. The lone reduction is TSM at 2.9% (Reduce 8.89%, $1,101.6M), alongside builds in MCD (2.7%, Add 7.98%, $1,025.6M) and FTV (2.6%, Add 28.73%, $1,003.5M). These moves highlight Viking's opportunistic scaling into undervalued financials while maintaining tech anchors.
What the Portfolio Reveals About Viking's Strategy
Viking Global's Q3 moves paint a picture of tactical opportunism in a shifting macro landscape: - Financial Sector Dominance: Over 16% in top holdings like PNC, JPM, SCHW, and COF signals bets on resilient banking amid rate normalization. - Tech and Semiconductors Balance: Massive adds to MSFT and a trim in TSM suggest selective AI/cloud exposure without overcommitting to cyclical semis. - Consumer Staples Stability: Builds in DIS, MCD, and APD provide defensive quality with growth potential. - Risk Management via Turnover: 38.5% turnover and portfolio trim to 78 positions indicate active pruning for concentration in high-conviction areas.
This blend favors quality compounders with strong moats, geographic diversity (U.S. heavy with international like TSM), and no overt dividend chase—prioritizing capital appreciation.
Portfolio Concentration Analysis
| Position | Value | % of Portfolio | Recent Change |
|---|---|---|---|
| The PNC Financial Services Group, Inc. (PNC) | $1,598.8M | 4.2% | Add 234.93% |
| JPMorgan Chase & Co. (JPM) | $1,595.8M | 4.1% | Add 25.16% |
| The Charles Schwab Corporation (SCHW) | $1,583.2M | 4.1% | Add 5.13% |
| Capital One Financial Corporation (COF) | $1,570.6M | 4.1% | Add 30.28% |
| Microsoft Corporation (MSFT) | $1,258.3M | 3.3% | Add 255.22% |
| The Walt Disney Company (DIS) | $1,196.5M | 3.1% | Add 78.69% |
| Taiwan Semiconductor Manufacturing Company Limited (TSM) | $1,101.6M | 2.9% | Reduce 8.89% |
| McDonald's Corporation (MCD) | $1,025.6M | 2.7% | Add 7.98% |
| Fortive Corporation (FTV) | $1,003.5M | 2.6% | Add 28.73% |
The table reveals Viking's measured concentration, with no single position exceeding 4.2% but the top 10 commanding 33.6% of the $38.5B portfolio. Financials dominate with four of the top five spots, all via significant adds, totaling over 16%—a clear sector rotation play. Tech like MSFT provides growth balance, while the sole reduction in TSM suggests profit-taking amid valuation concerns. This structure mitigates risk through even sizing while amplifying exposure to perceived undervalued leaders.
Investment Lessons from Viking Global Investors
Viking's Q3 portfolio exemplifies principles honed by Andreas Halvorsen: - Aggressive Scaling in Conviction Ideas: Triple-digit adds like PNC 234.93% and MSFT 255.22% show commitment to ideas with improving fundamentals. - Sector Rotation Over Static Bets: Pivoting to financials amid rate peaks demonstrates macro awareness without abandoning tech. - Turnover as Discipline: 38.5% turnover and trimming 10 positions enforce constant reevaluation, avoiding "diworsification." - Balanced Concentration: Top 10 at 33.6% across 78 holdings balances firepower with diversification. - Quality Moats in Volatile Times: Focus on banks, tech giants, and staples prioritizes resilient cash flows.
Looking Ahead: What Comes Next?
Viking's positioning sets up well for a potential soft landing, with heavy financial exposure poised to benefit from lower rates boosting lending and M&A. The portfolio's 38.5% turnover implies dry powder from exits, likely targeting further financial dips or AI-adjacent tech. Watch for expansions in consumer recovery plays like DIS if sentiment improves. In uncertain markets, this setup favors quality financials and tech, with the firm's 6-quarter hold average suggesting patience for realizations.
FAQ about Viking Global Investors Portfolio
Q: What drove Viking's massive adds to financial stocks like PNC and JPM in Q3 2025?
A: The aggressive builds—PNC up 234.93%, JPM 25.16%—reflect bets on banking resilience post-rate hikes, with strong deposit growth and undervalued multiples amid expected Fed cuts.
Q: Why is Viking's top 10 concentration only 33.6% despite big positions?
A: This balanced approach across 78 holdings allows high-conviction bets (e.g., 4.2% max in PNC) without excessive risk, aligning with their dynamic strategy of 38.5% turnover.
Q: What does the TSM reduction signal about Viking's semiconductor view?
A: The 8.89% trim in TSM (still 2.9%) suggests profit-taking at peaks, contrasted by the huge MSFT add, favoring U.S. software over cyclical semis.
Q: How can I track Viking Global Investors' portfolio?
A: Follow quarterly 13F filings on the SEC site or use ValueSense's superinvestor tracker at https://valuesense.io/superinvestors/viking-global for real-time analysis, historical changes, and visualizations—note the 45-day reporting lag.
Explore More Investment Opportunities
For investors seeking undervalued companies with high fundamental quality, our analytics team provides curated stock lists:
📌 50 Undervalued Stocks (Best overall value plays for 2025)
📌 50 Undervalued Dividend Stocks (For income-focused investors)
📌 50 Undervalued Growth Stocks (High-growth potential with strong fundamentals)
🔍 Check out these stocks on the Value Sense platform for free!