
Why we are not in a bubble... yet
Welcome to the Value Sense Blog, your resource for insights on the stock market! At Value Sense, we focus on intrinsic value tools and offer stock ideas with undervalued companies. Dive into our research products and learn more about our unique approach at valuesense.io
Explore diverse stock ideas covering technology, healthcare, and commodities sectors. Our insights are crafted to help investors spot opportunities in undervalued growth stocks, enhancing potential returns. Visit us to see evaluations and in-depth market research.
• The equity bull market and the continued ascent of leading technology companies have led many to worry that we are in a bubble. History suggests that bubbles are often driven by exuberance that builds around a transformative technology, attracting investors, capital and new entrants.
Typically, bubbles exhibit rapidly rising asset prices, extreme valuations and significant systemic risks driven by increased leverage.
• There are elements of investor behaviour and market pricing currently that rhyme with previous bubbles, including the rise in absolute valuations, high market concentration, increased capital intensity of leading companies and the emergence of vendor financing.
• However, we see key differences: First, the appreciation of the technology sector has, so far, been driven by fundamental growth rather irrational speculation about future growth. Second, the leading companies that have seen the strongest returns have unusually strong balance sheets. Third, the AI space has, so far, been dominated by a few incumbents; most bubbles form in a period of huge competition as both investors and new entrants flock into the space.
• Importantly, bubbles tend to develop when there is a combined surge in stock prices and valuations to an extent that the aggregate value of companies associated with the innovation exceed the future potential cash flows that it is likely to generate. Valuations of the technology sector are becoming stretched (here we look at P/E ratios versus other bubbles, PEG ratios, P/B vs. ROE and a DDM) but not yet at levels consistent with historical bubbles.
• While it appears we are not in a bubble yet, high levels of market concentration and increased competition in the AI space suggest investors should continue to focus on diversification.
The rise in equity markets this year has, to many, represented a classic case of hope over reality. The geopolitical environment remains volatile, tariffs have increased by more than most had expected only a few months ago, uncertainty abounds and gold prices have surged, yet most risk assets have continued to rise to record highs. Part of the explanation for this lies with the relatively benign macro landscape and the prospects for ongoing growth in the global economy coupled with the resumption of interest rate cuts in the US. In general, when these two factors combine, equity prices tend to rise.
Nevertheless, signs of excess are starting to emerge. IPO and M&A activity is accelerating and the starting day premiums for new issues has reached an average of 30% in the US, the highest since the technology bubble in the late 1990s. Our US strategists, who monitor retail buying, have also seen signs of speculation.
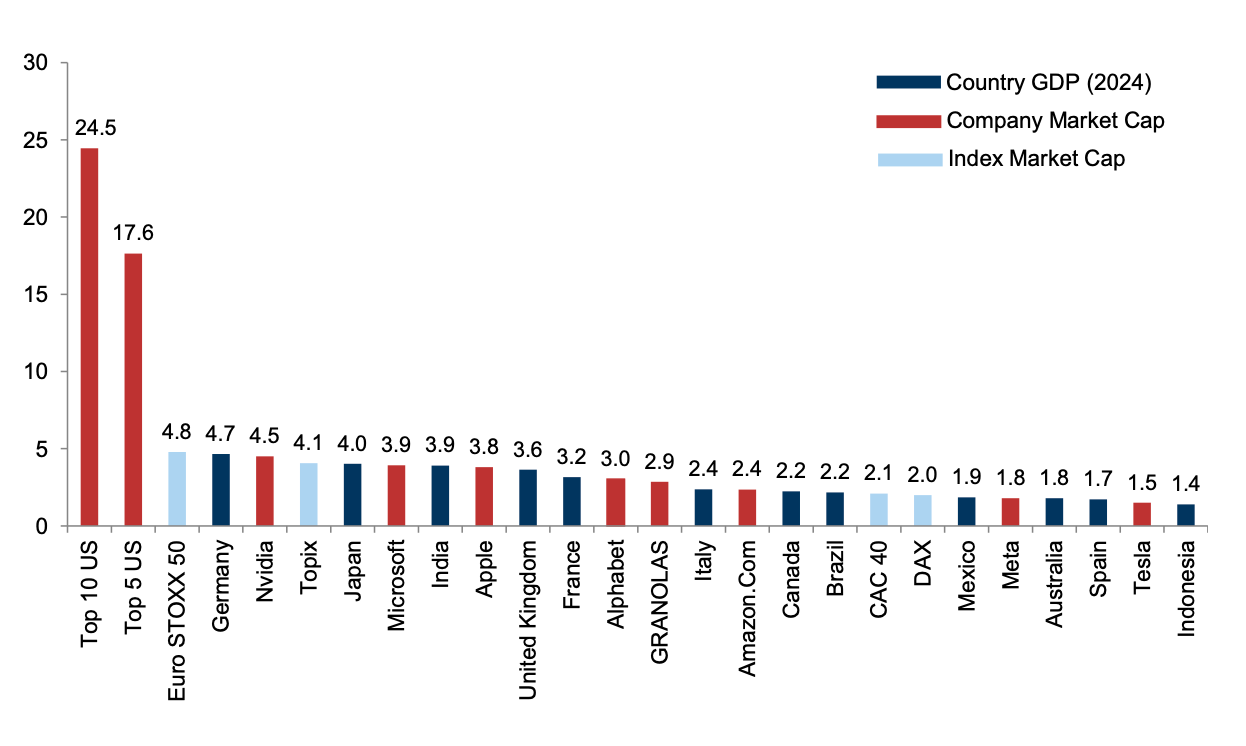
Company transcripts are commonly referring to their AI strategies, while the biggest US technology companies maintain their lead: the biggest 5 technology companies in the US now have a collective value that exceeds the combined size of the Eurostoxx 50, the UK,
India, Japan, and Canada. Put another way, these 5 companies are worth around 16% of the entire global public equity market. The biggest 10 US stocks (8 of which are technology-related) account for nearly 25% of the global equity market, and are worth almost $25 trillion (Exhibit 1). Many investors have started to ask whether all of this is rational or if we are seeing the classic signs of an unsustainable bubble.
Exhibit 1: The top 10 US companies dominate the world equity market
2024 GDP, market prices as of last close; USD trn
Q1: Does the rise in technology stocks, and excitement about AI, look similar to previous bubbles?
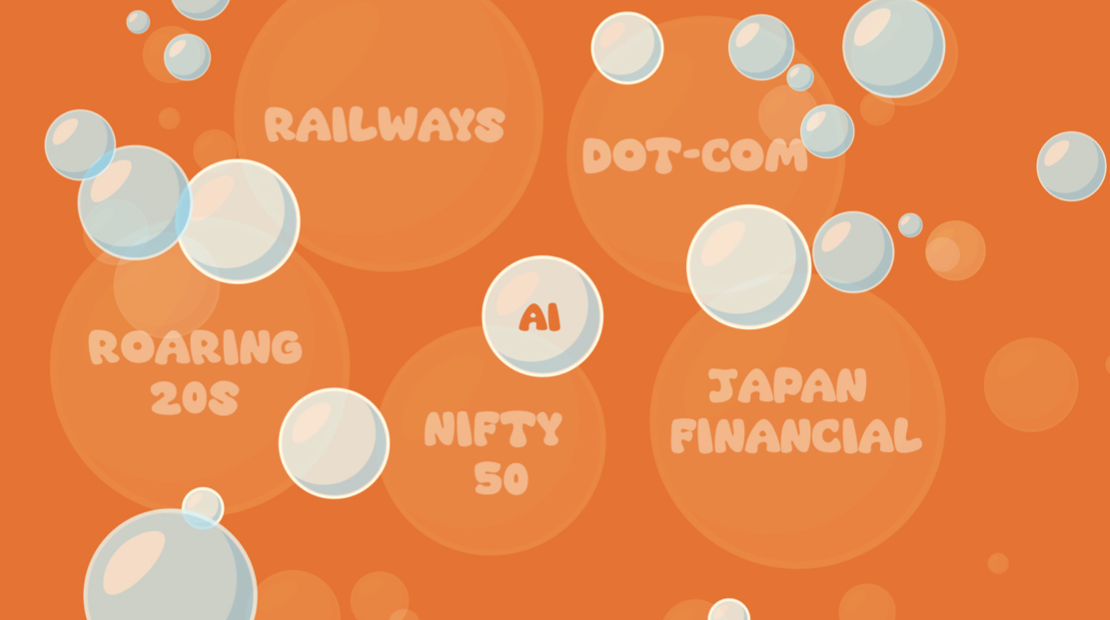
A: While the success of dominant technology companies is clear to see, this doesn’t necessarily mean that there is a bubble in the market that is in imminent danger of bursting. Many bubbles in the past were not associated with market leaders or dominance (that typically came much later after the bubble burst); rather, they were driven by frenzied speculation about which company might eventually enjoy the spoils associated with a new engine of growth. There have been many examples of famous financial bubbles that ended with significant market collapses (and many others that are less well-known). In most cases these were driven by rapidly rising valuations and, when they did eventually burst, they triggered other problems in economies as rapidly falling valuations drove de-leveraging which, quite often, resulted in problems in the banking and financial sector. We list some, although by no means all, here:
1630s – Tulip Mania in Holland
1790s – The Canal Mania in the UK
1840s – The Railway Bubble in the UK
1873 – The Railway Bubble in the US
1920s – The Stock Market Boom in the US
1980s – The Land and Stock Bubble in Japan
1990s – The Technology Bubble, Global
2007 – The Housing / Banking Bubble in the US (and Europe)
Each of these bubbles was driven by a specific focus, but they shared some similar characteristics. Most centred around a new technology or innovation that attracted growing excitement among investors, which drove significant investment by both existing and new companies. One academic study 1 found that, in a sample of 51 major innovations introduced between 1825 and 2000, bubbles in equity prices were evident in 73% of the cases. They also found that the magnitude of these bubbles increased with the radicalness of innovations, with their potential to generate indirect network effects and with their public visibility at the time of commercialisation.
In this context, several of the factors that drove previous technology-led bubbles, as well as the dot-com bubble of the late 1990s, resonate with the current interest and enthusiasm for AI and its related technologies. A sea change in technology seems to be at a critical point of commercialisation, just as we experienced with the early commercialisation of the internet, bringing the potential for higher future growth. The problem now, as then, is threefold. First, how does one value the size of the future market? Second, how long will it take to commercialise and scale? Third, who will be the main beneficiary of the future growth? Given the uncertainty around these questions in the early stages of the technologies’ evolution, there is a tendency for investors to buy ‘options’ in many companies in the hope of being an early investor in what might become a dominant player. As the excitement grows, the value of the whole becomes bigger than the sum of the parts. Ultimately, bubbles develop as the aggregate value of companies that may be involved in the innovation exceeds the future potential cash flows that they are likely to generate; many investors have bought an option on the future and they will not all pay off.
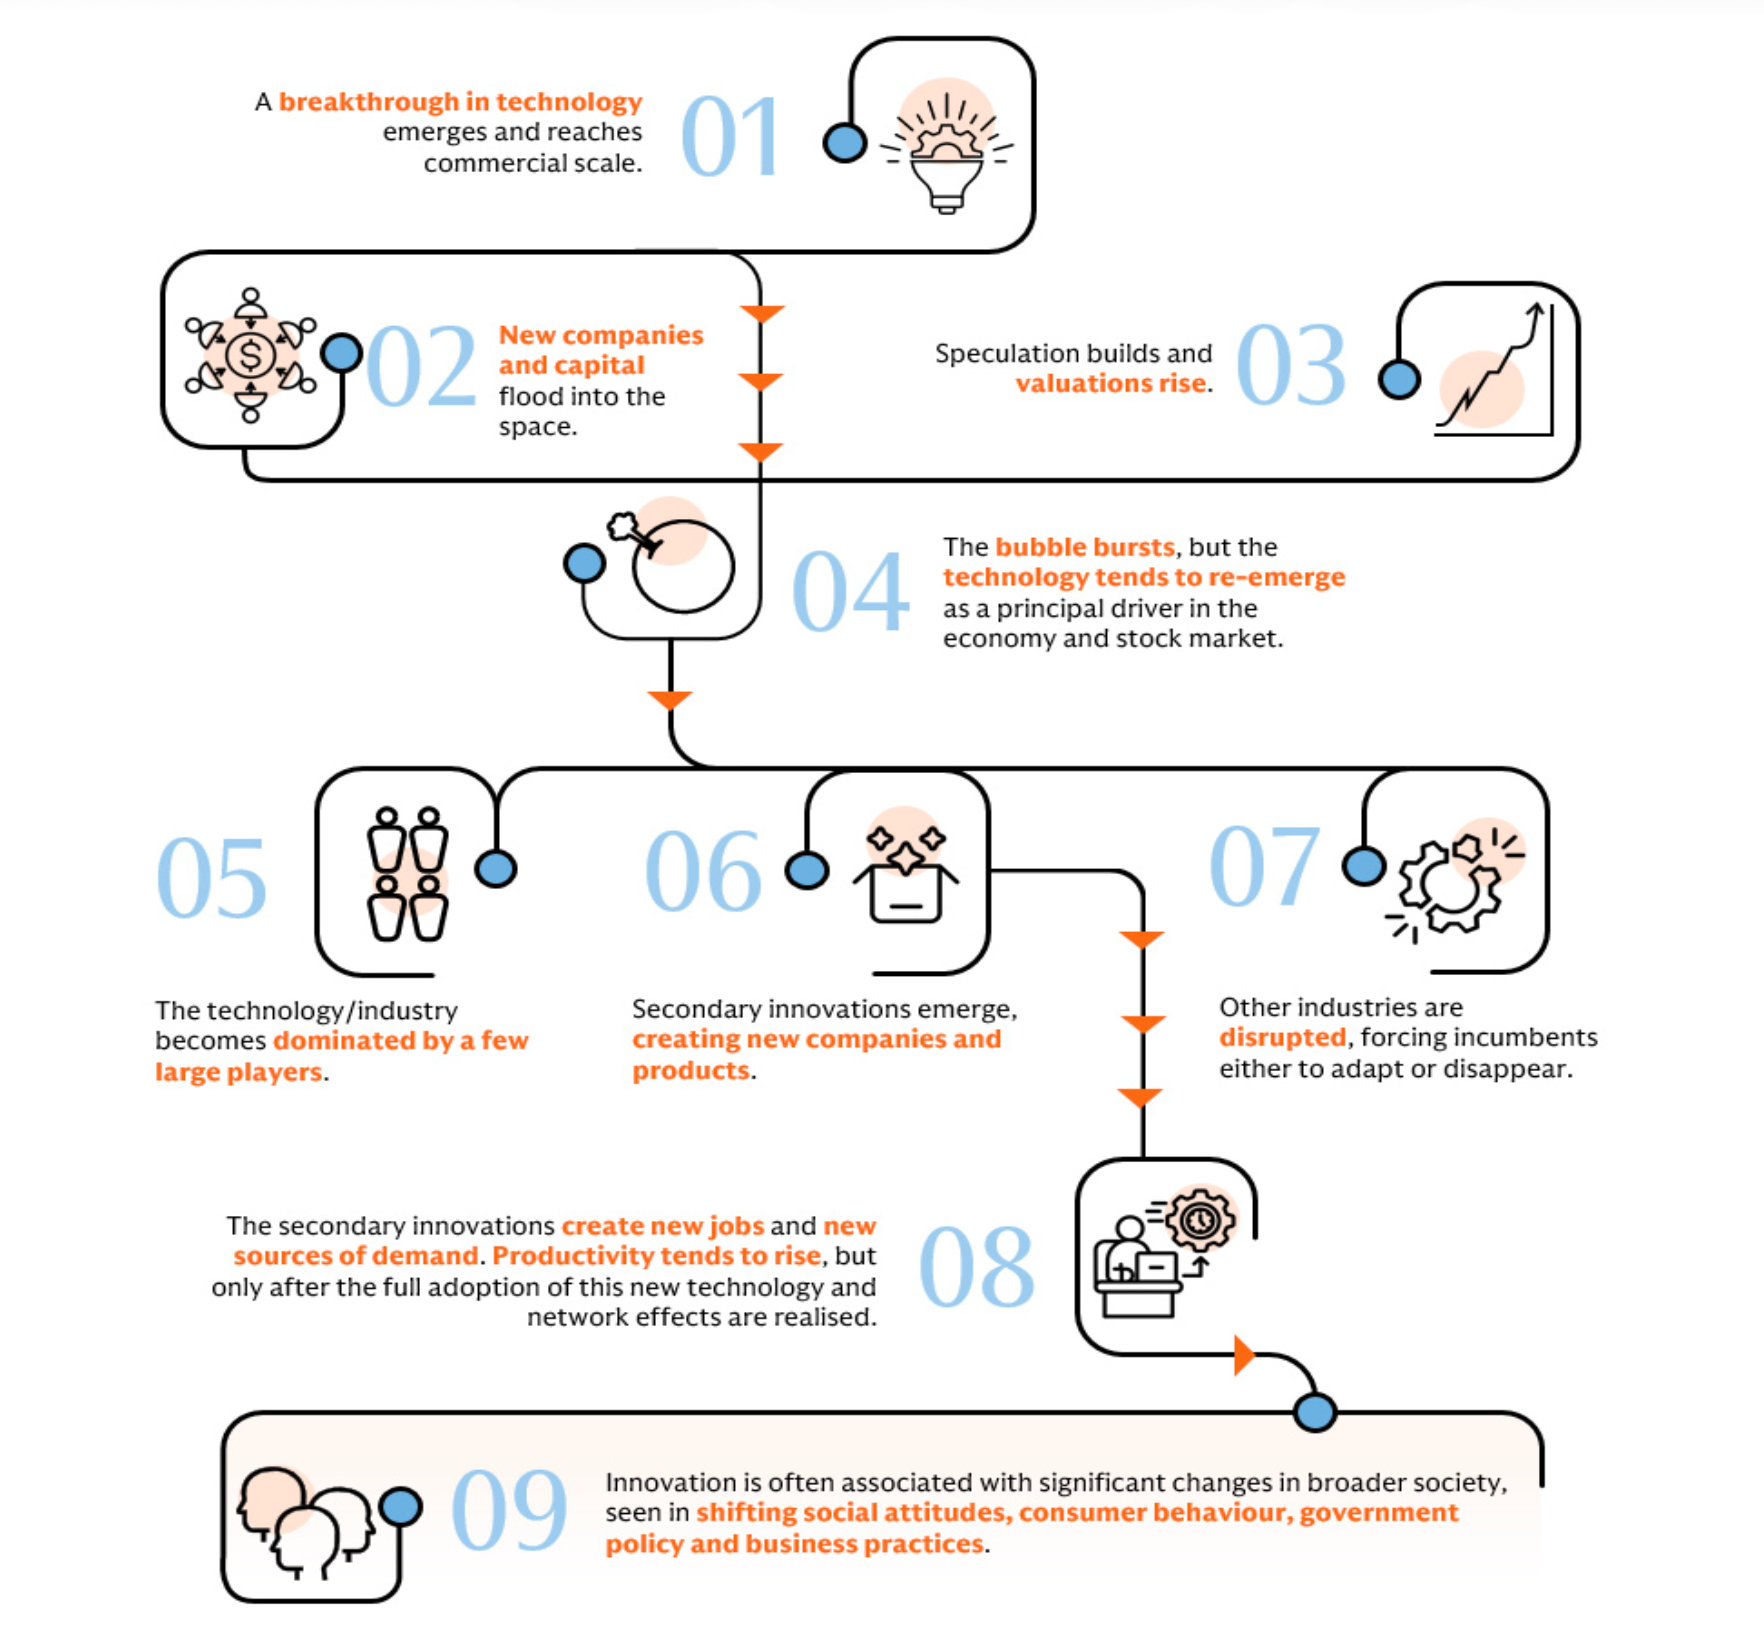
Looking at history (see Global Strategy Paper: Why Technology is not a bubble; lessons from history, 4 June 2018), we can make several observations regarding the pattern that develops in technology-driven speculative bubbles. It is possible that the current stage of innovation is consistent with the early stages of bubbles that we have experienced at other times in history (Exhibit 2).
Exhibit 2: Bubbles tend to follow a ‘typical pattern’ both in the build-up and after they burst
Q2: Does it have many of the hallmarks of a classic bubble?
A: While there is no agreed definition of a financial bubble, there are typically three important components: rapidly rising asset prices, extreme valuations and rising significant systemic risks driven by increased leverage. Most bubbles are grounded in the excitement that builds around a compelling narrative – often as a result of a new technological breakthrough that raises expectations about new sources of growth and profitability. While the dominance in the technology sector, particularly in the US, has led the rise in equity markets, there are some important differences with the rise in markets and technology stocks today and previous bubbles before they burst.
First, price appreciation is only one part of the story. We have seen extraordinary rises in the valuation of many assets over the past couple of years but less concern about a bubble because valuations are much lower. Defence stocks have generated significant returns this year for example, while European banks have even outperformed US technology stocks over the past couple of years, but without the associated fears of a bubble. Price action itself, therefore, is not a sufficient condition for a bubble. Ultimately, bubbles develop when there is a combined surge in stock prices and valuations to an extent that the aggregate value of companies associated with the innovation exceeds the future potential cash flows that they are likely to generate.
The biggest bubbles in history have been associated with rampant rises in stock prices as well as valuations:
- The innovation of canals for transportation was an important component of the First Industrial Revolution. The first canals built generated strong returns for investors, attracting new inflows of capital that pushed up prices, and during the 1790s a bubble developed in canal stocks on the London Stock Exchange. The boom in canal stocks reached a peak in 1793. By the 1800s, the return on capital in canals had fallen from a pre-bubble peak of 50% to just 5%, and a quarter of a century later only 25% of canals were still able to pay a dividend. Nevertheless, the canal infrastructure became instrumental in reorganising industries and factories, which, in turn, spawned the growth of many new industries, businesses and products.
- The rise in railway speculation in the nineteenth century resulted in a similar surge in stock prices as investors (and new companies) rushed into the sector. In the UK, for example, the rapid ascent of railway stock prices in the 1840s was followed by an equally dramatic collapse as capacity increased and returns collapsed by an average of 85% from their peak by the 1850s, and the total value of these shares had fallen to less than half the capital spent on them.[2] As with the canals, the legacy of the infrastructure became pivotal to growth in other industries.
- The twentieth century brought sequential waves of new technologies. The periods after World War I and World War II saw massive demand for consumer products that attracted waves of investment as new entrants emerged. In 1920 US broadcast radio was dominated by KDKA but, by 1922, 600 radio stations had opened across the US and, as with the adoption of television technology, this increased the scope for advertising and the adoption of other products as they came to market. The value of shares in the Radio Corporation of America (RCA), for example, rose from $5 to $500 in the 1920s but collapsed by 98% between 1929 and 1932, and most radio manufacturers failed.
- The personal computer (PC) revolution fueled a similar boom in both the number of companies and valuations of new entrants in the market. While IBM facilitated the widespread commercialisation of the personal computer, hundreds of companies entered the market in the 1980s. In 1983, however, several companies in the sector announced losses, including Atari, Texas Instruments and Coleco. A collapse in PC share prices followed and many PC manufacturers went out of business, including Commodore, Columbia Data Systems and Eagle Computer. While many of the surviving businesses took many years to recover, the industry matured and became dominated by just a few companies.
- This pattern was repeated during the internet bubble of the late 1990s. Speculation grew rapidly as investors began to see the potential of the internet. When search engine company Yahoo! had its Initial Public Offering, its stock rose from $13 to $33 in a single day. 13 major large-cap stocks increased in value by over 1,000%, and another seven large cap stocks each rose by over 900% in 1999. The Nasdaq index increased fivefold over the period between 1995 and 2000. In just a month after its peak in 2000, the Nasdaq had fallen 34% as hundreds of companies lost 80% or more of their value. The Nasdaq itself had fallen by nearly 80% by the time it troughed in October 2002.
Second, while stock prices have appreciated strongly, up until now, these have been reflected by powerful and sustained profit growth rather than excessive speculation about the future; see Global Strategy Paper: Why AI is not a bubble, 5 September 2023. As Exhibit 3 shows, the rise in EPS of the technology sector has been extraordinary relative to the EPS of all other sectors; the gap has particularly widened since the financial crisis. This pattern is unusual in the context of bubbles when the companies at the epicentre of the fervour are typically driven by expectations of future growth and market dominance rather than those that have already achieved it. Of course, this does not guarantee that the dominant companies are not overvalued or vulnerable to competition, but rather their performance up until now has been a reflection of sustained fundamental success rather than excessive speculation about the future.
Exhibit 3: Tech earnings have outstripped those of the global market
12m trailing EPS (USD). Indexed to 100 on Jan-2009
This is true both for the technology sector and the dominant companies within it. Most of the profits in the technology sector have been generated by companies in the US (largely explaining the success of the US equity market over the past fifteen years), but the dominant companies have enjoyed staggering profit growth over the past fifteen years and have particularly strong balance sheets.
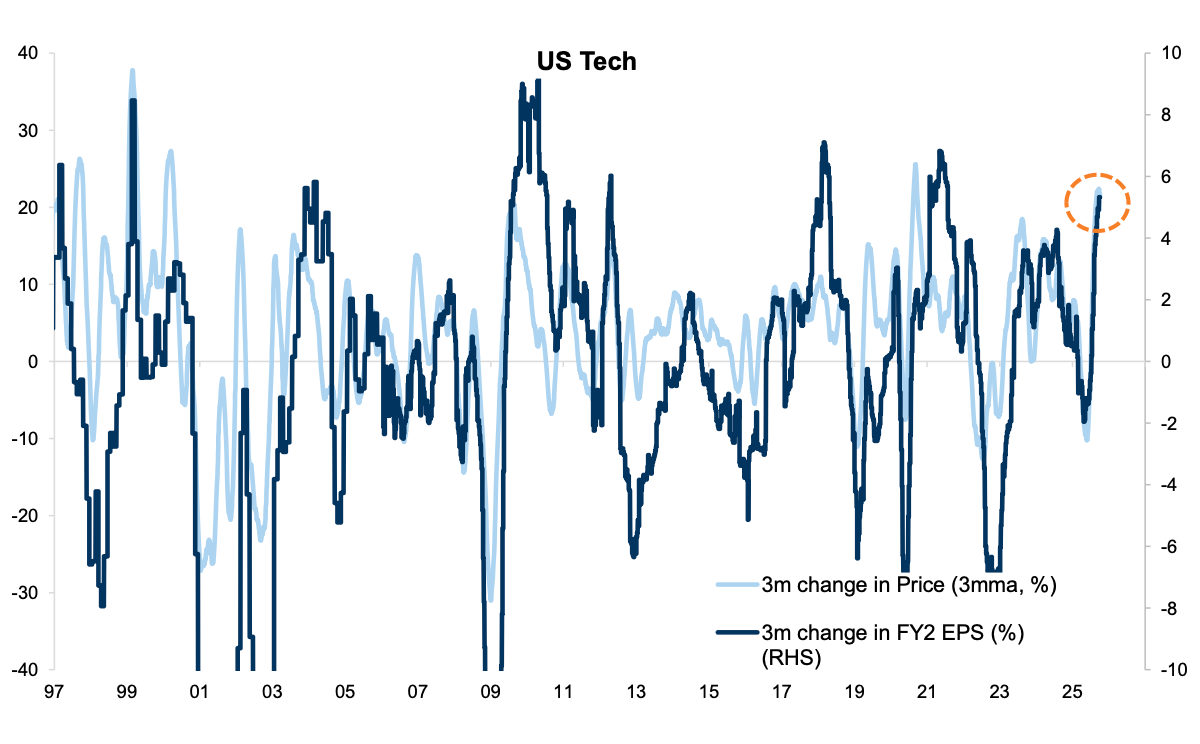
Indeed, earnings momentum has been a large driver of recent prices, which is both reassuring (it is justified) but also suggests that the current rally is greatly dependent on continued earnings performance (Exhibit 4).
Exhibit 4: US technology EPS and performance have been highly correlated
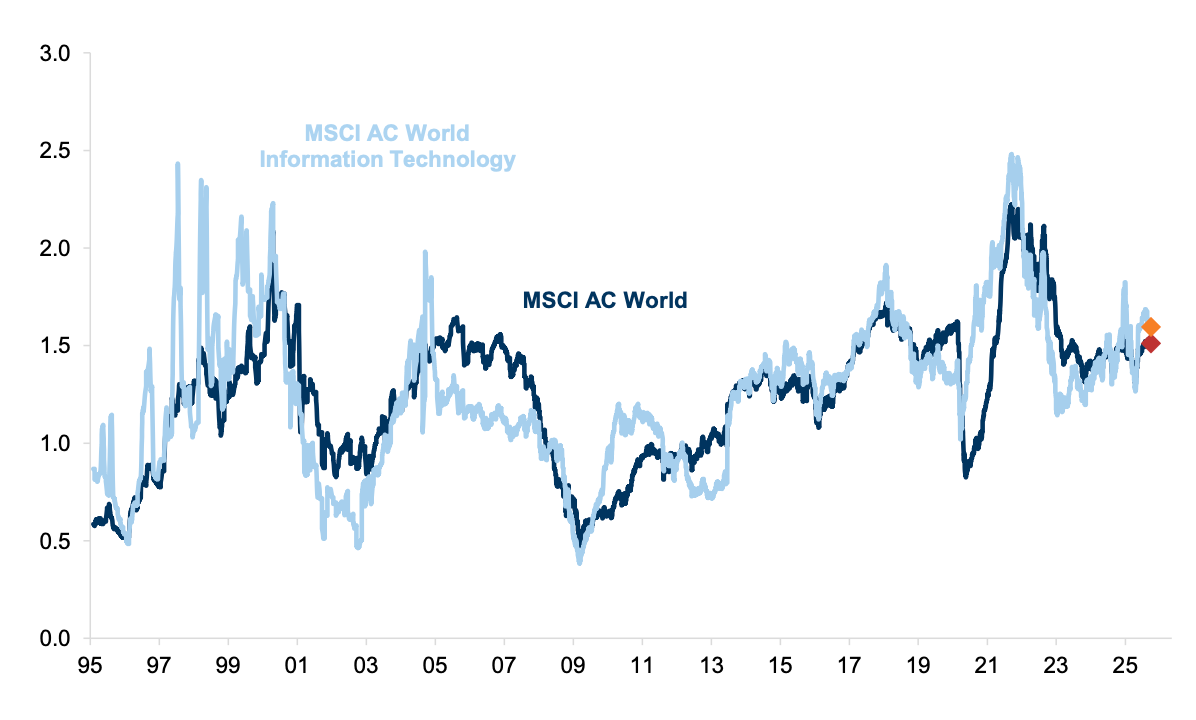
Q3: But haven’t valuations gone up alongside the strong price performance?
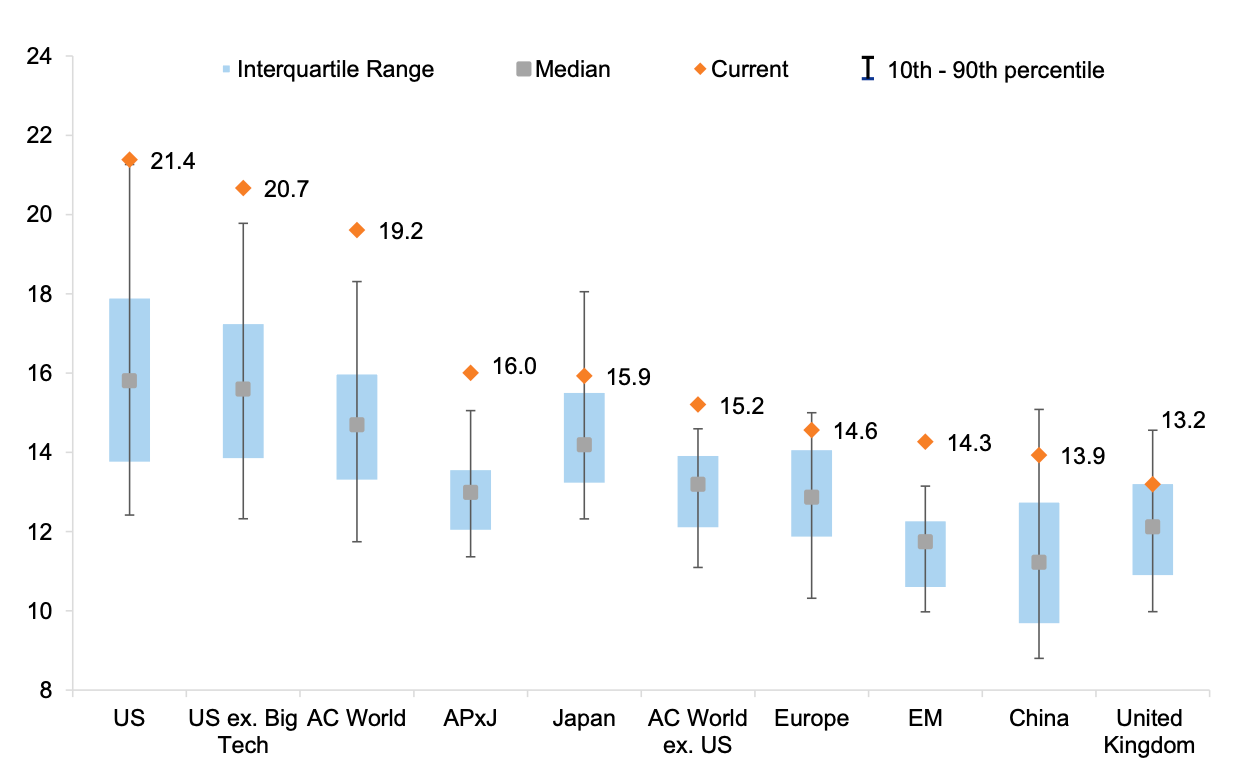
A: It is true that valuations in equity (and credit) markets are at high levels relative to their history. The most extreme is the US where current P/E ratios are above their previous 20-year high (Exhibit 5). That said, most equity markets are now on high valuations versus their respective histories and credit markets also look expensive across the board. This is therefore less about a bubble in technology and more about the general conditions of low interest rates, high global saving and an extended economic cycle that has pushed up the value of all risk assets. This does leave them vulnerable to a correction if confidence in growth fades, but this is less likely to be driven solely by a bubble bursting in the technology space.
Exhibit 5: The US market is experiencing the most extreme valuations, in both absolute and relative terms
12m fwd P/E multiple. MSCI Regions, STOXX 600 for Europe and S&P 500 for USA. Data since 2003
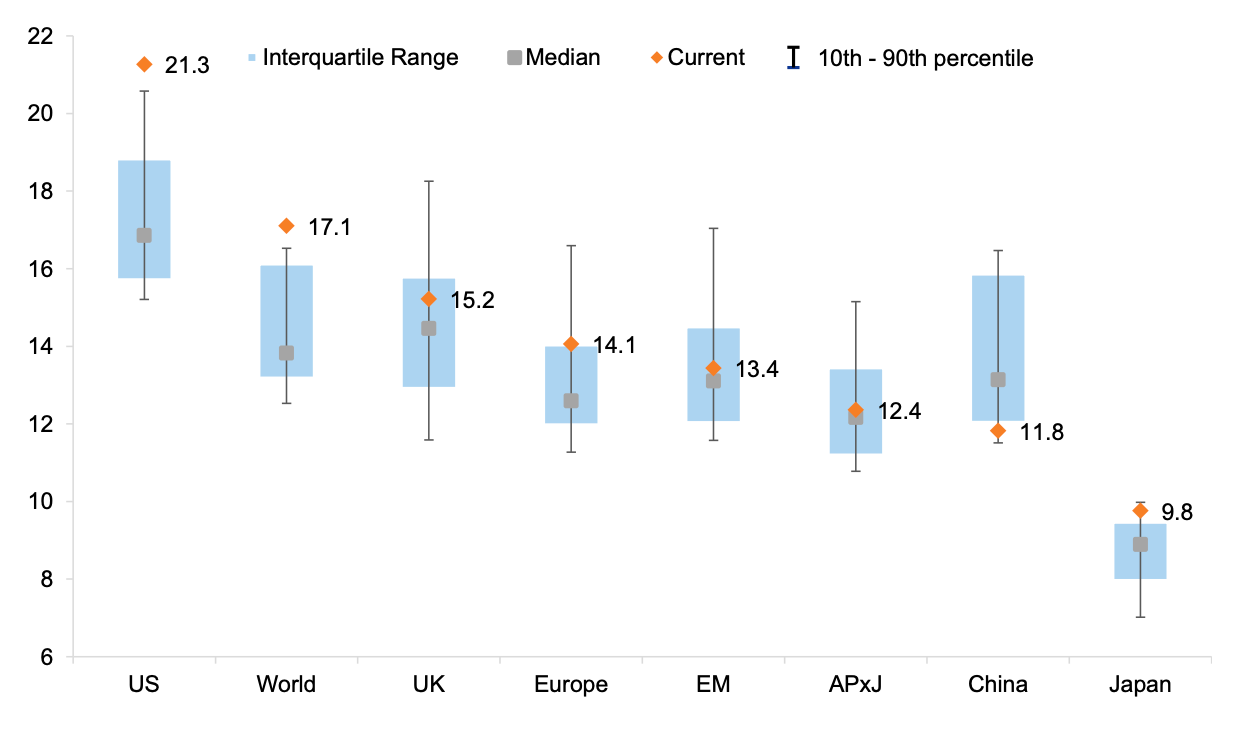
Also, it is underlying profitability and return on equity that has largely explained the rise in valuations. The ROE of the US market – largely driven by the technology sector – is well above its previous 20-year high and well above that achieved in other regions (Exhibit 6).
Exhibit 6: Higher valuations in the US may be justified by higher ROE
12m fwd ROE ranges for different MSCI regions, data for the last 20 years
Q4: Can the valuation of ‘big tech’ be justified?
A: Without knowing what earnings and returns these companies will eventually deliver, this is obviously a difficult question to answer, but one that most investors are currently grappling with. We look at this in several ways: i) a comparison with past bubble valuations, ii) a PEG ratio, iii) a comparison of ROE and price to book, and iv) a DDM. In most cases, the current valuations are high but still some way off the dot-com bubble peaks.
(i) Past bubble comparison:
Exhibit 7 shows that the median 24m forward P/E ratio across the ‘Magnificent 7’ is 27x, or 26x if we exclude Tesla (which has a much higher multiple than the other companies). This is roughly half the equivalent valuation of the biggest 7 companies in the late 1990s, while the dominant companies in Japan (mostly banks) traded at higher valuations still; the current EV to sales ratios are also much lower than those of the dominant companies in the late 1990s. So it is true that valuations are high but, in our view, generally not at levels that are as high as are typically seen at the height of a financial bubble.
Exhibit 7: Dominant companies today are not as expensive as those in previous ‘bubble’ periods in history
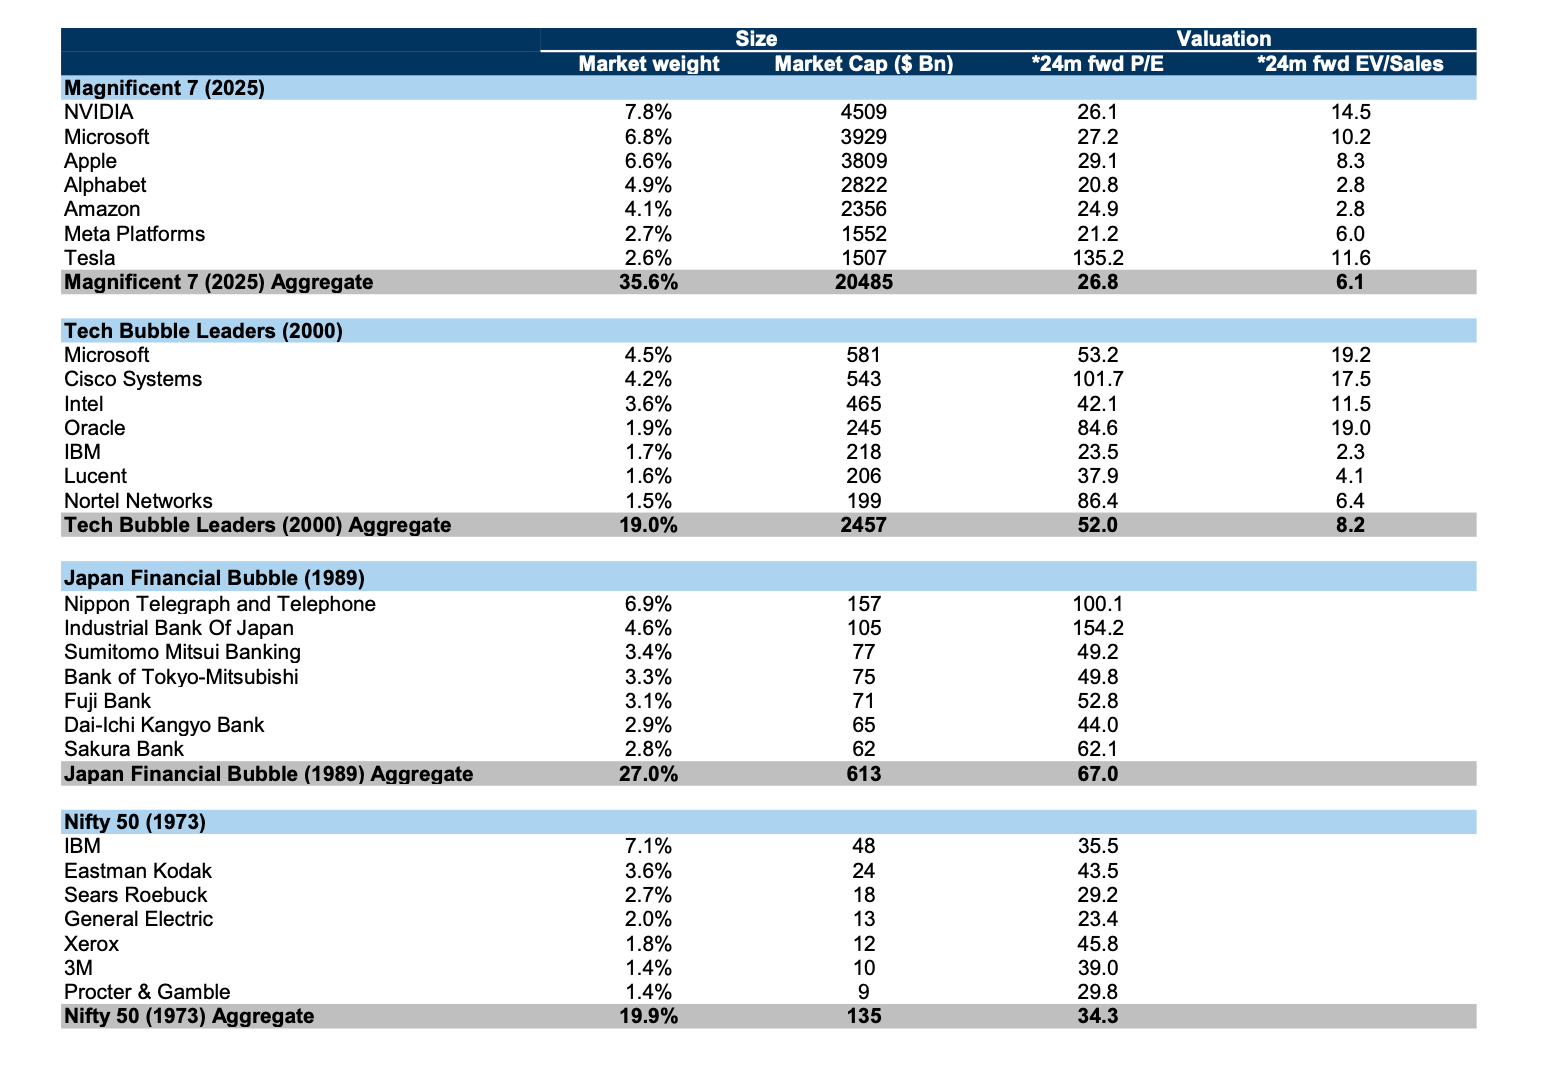
*Actual (LTM) P/E and EV/Sales data from 02/01/1973 for Nifty 50. **LTM P/E data and EV/Sales from 27/12/1989 for Japan Financial Bubble. ***24m fwd P/E and EV/Sales data from 24/03/2000 for Tech Bubble.
(ii) PEG ratio comparison:
While the valuations of technology stocks have increased, their PEG ratio (comparing valuation to earnings growth) remains both the same as other stocks and well below the levels of the late 1990s (Exhibit 8).
Exhibit 8: The PEG ratio for technology remains below its tech-bubble highs
PEG ratio (12m fwd P/E divided by second 12m fwd EPS growth)
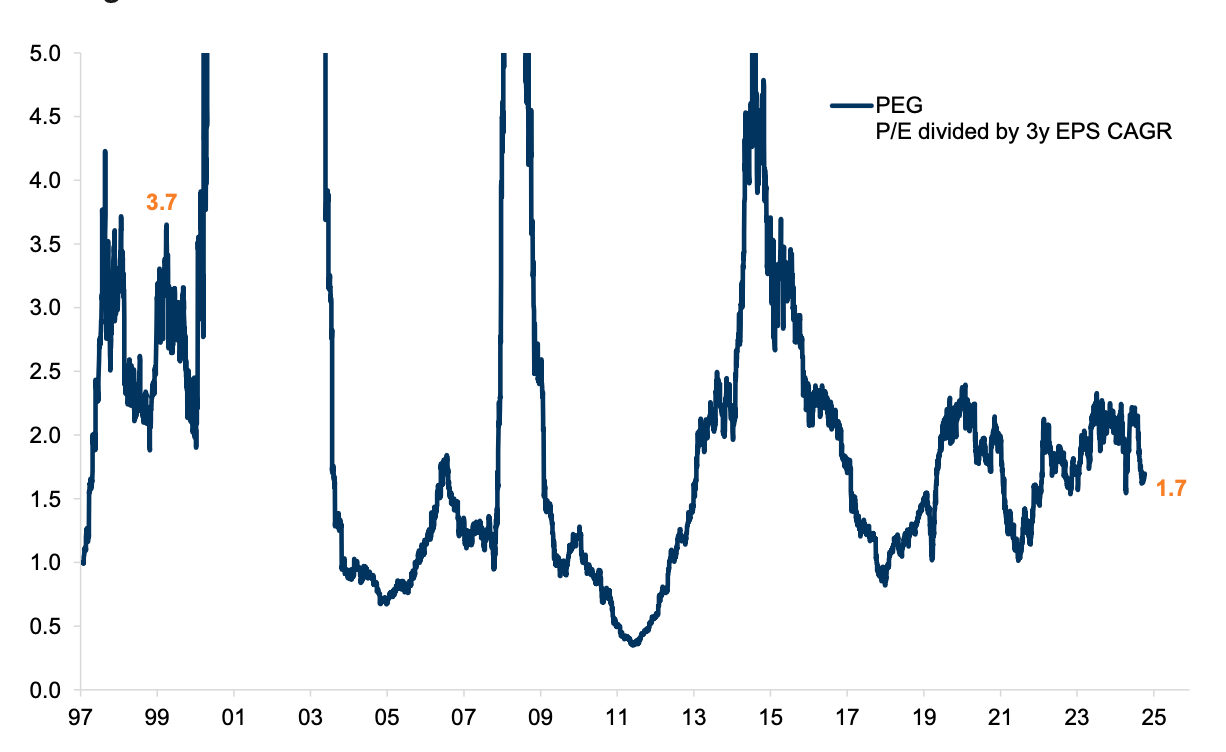
Of course, the deficiency with the standard PEG ratio we apply above is that it uses analysts’ forecasts which may themselves be too optimistic (indeed, very likely so in a bubble). We show in Exhibit 9 the US tech PEG ratio based on a 12-month forward P/E vs. trailing 3-year EPS growth. We are in effect assuming that what has been achieved can be extrapolated forward. The chart is messy – EPS for US tech dipped negative in the early 2000s as companies had to write off assets – but it does avoid the problem of relying on analyst forecasts. At the peak of the dot-com bubble in late 1999/early 2000, the PEG was 3.7x versus 1.7x today, based on trailing earnings. Again, this points to a more conservative pricing picture than in the late 1990s bubble. Indeed, on this basis US tech does not look expensive at all.
Exhibit 9: The US tech sector on a PEG ratio where the valuation is divided by historical earnings
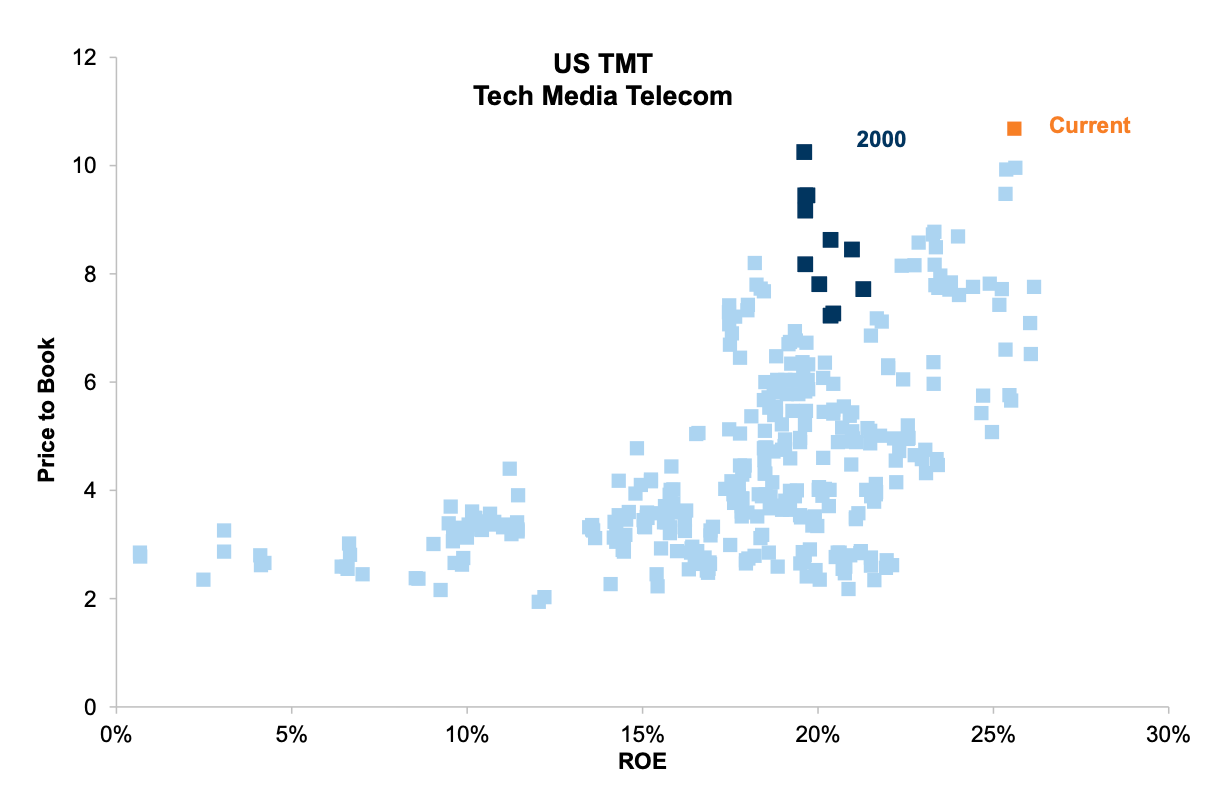
(iii) ROE vs. price to book comparison:
The US technology sector enjoys historically high ROEs, which to some extent does justify a high price to book. That said, the sector is starting to look more stretched on this metric (Exhibit 10). But it is not as stretched as in 1999/2000 – at that point price to book was similar to today but the ROE was much lower.
Exhibit 10: US TMT valuations vs. ROE
Trailing data for ROE and P/B
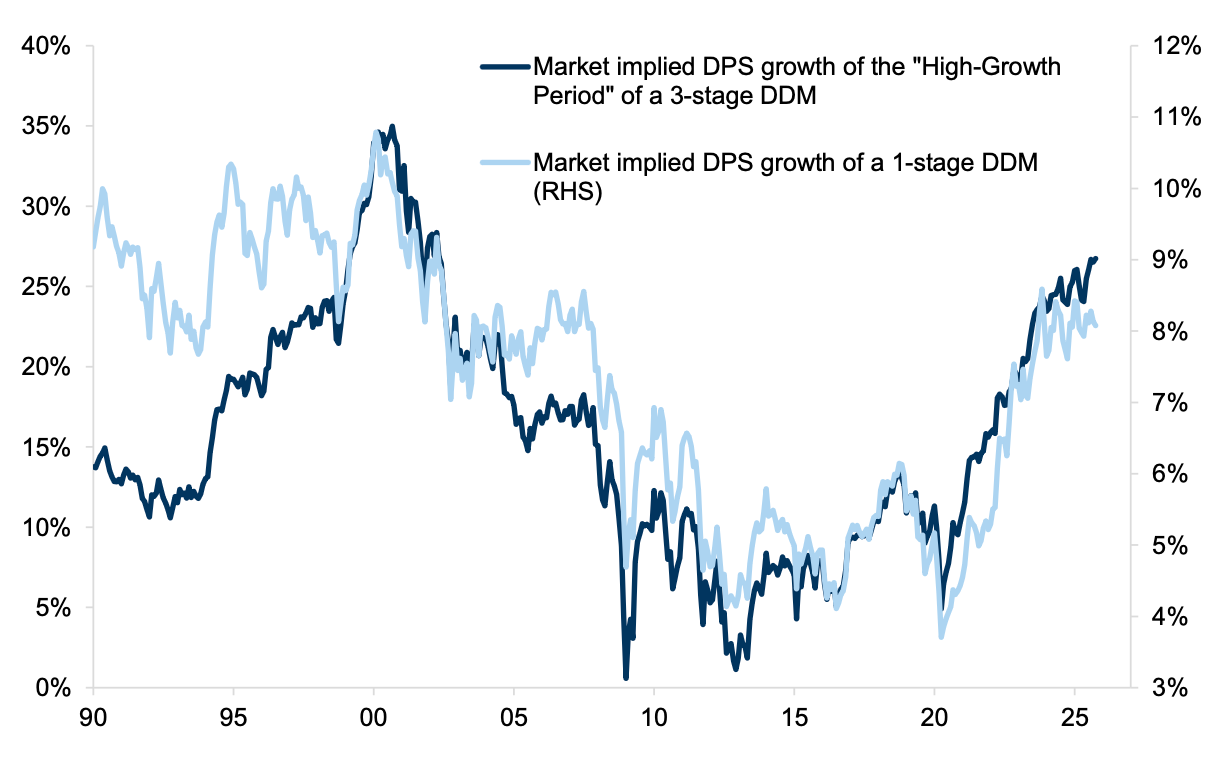
(iv) Dividend discount model – what growth is being discounted?
We approach this in two ways. First, a simple one-stage DDM where we assume an ERP of 4.5% and back out implied growth based on current prices for the US TMT sector (telecoms, media and technology). The into perpetuity growth implied is 8% pa nominal. This is high versus recent years, where it has more typically been 4-5% pa implied growth. It takes us back to the mid-1990s, but is not as high as the 10% pa implied in 1999/2000. We also do a 3-stage model where we have the same ERP, we are looking to back out stage 1 growth (years 1-10), we assume from year 10-20 growth fades and after year 20 dividends grow by long-term nominal GDP growth. This method avoids the problem of the one-stage model whereby no sector should be able to grow in excess of GDP into perpetuity. The current market valuation implies you’d need DPS growth of 25% pa for the next 10 years to justify current prices. Is this high? Yes, versus the 10-year CAGR achieved by US TMT over the past decade. That said, this level is still lower than the 35% growth that was implied at the peak of the dot-com era.
Exhibit 11: Implied DPS growth to justify US TMT valuation is elevated yet still below dot-com
Market-implied dividend growth under 1- and 3-stage DDMs
Perhaps the most compelling argument for why valuations are not yet at bubble levels is to compare returns in this past year – disaggregated between earnings, valuation and dividends – with returns back in the 12-months before the peak in the dot-com bubble. We see from Exhibit 12 that US tech earnings growth was good back in 1999/2000 and certainly was a contributor to returns; but on top of earnings there was also a much greater rise in valuation that dwarfs what we have seen today. And for European telecoms the valuation ascent was even steeper, with returns driven almost entirely by valuation rather than earnings.
Exhibit 12: The performance of tech companies in the early 2000s was more heavily influenced by high valuations than by earnings
12m return, trailing and before Tech Bubble peak, in local currency – S&P peak set to 23rd March 2000
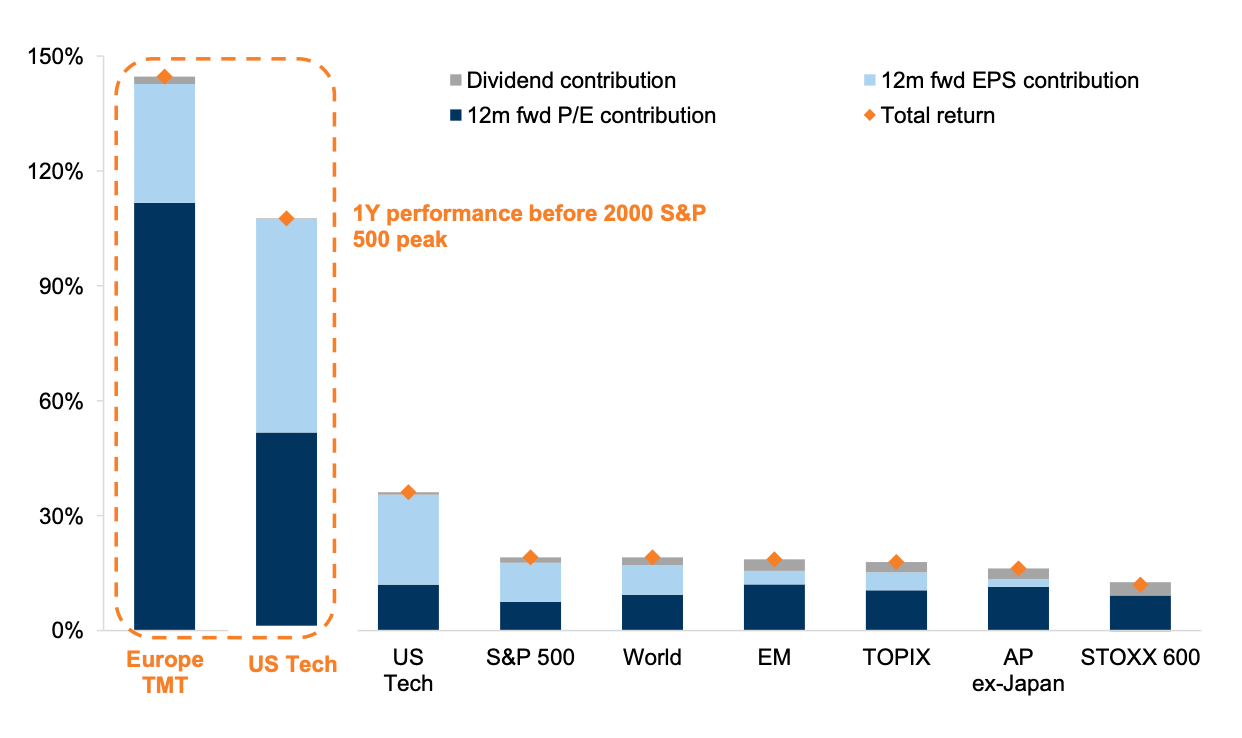
On balance, valuations are looking increasingly stretched but not yet at the levels that were typical in other bubble periods before they burst. The biggest risk is that earnings disappoint and investors start to question the sustainability of their current rates of return. This, at least, could trigger a significant correction (although is less likely to drive a broader collapse as we have seen in other bubble-bursting periods).
Q5: But hasn’t the significant outperformance of technology led to a dangerous degree of market concentration that is akin to a bubble?
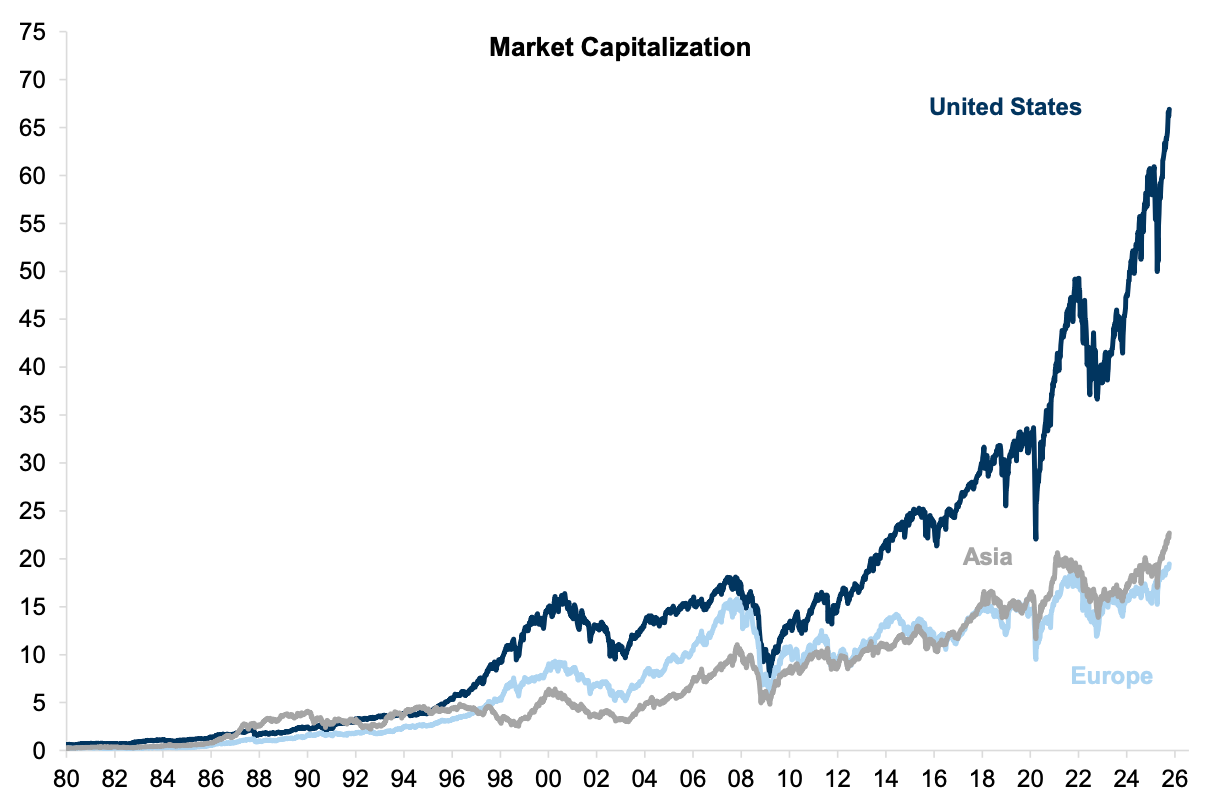
A: It is certainly true that equity concentration has increased dramatically at the geographical, sectoral and stock levels (all of which are related). From a regional perspective, the US has consistently outperformed for most of the past fifteen years and has reached over 60% of the global stock market.
Exhibit 13: The US market has consistently outperformed the rest of the world over the last decade
Market Cap ($ trillion). Asia incl. Japan
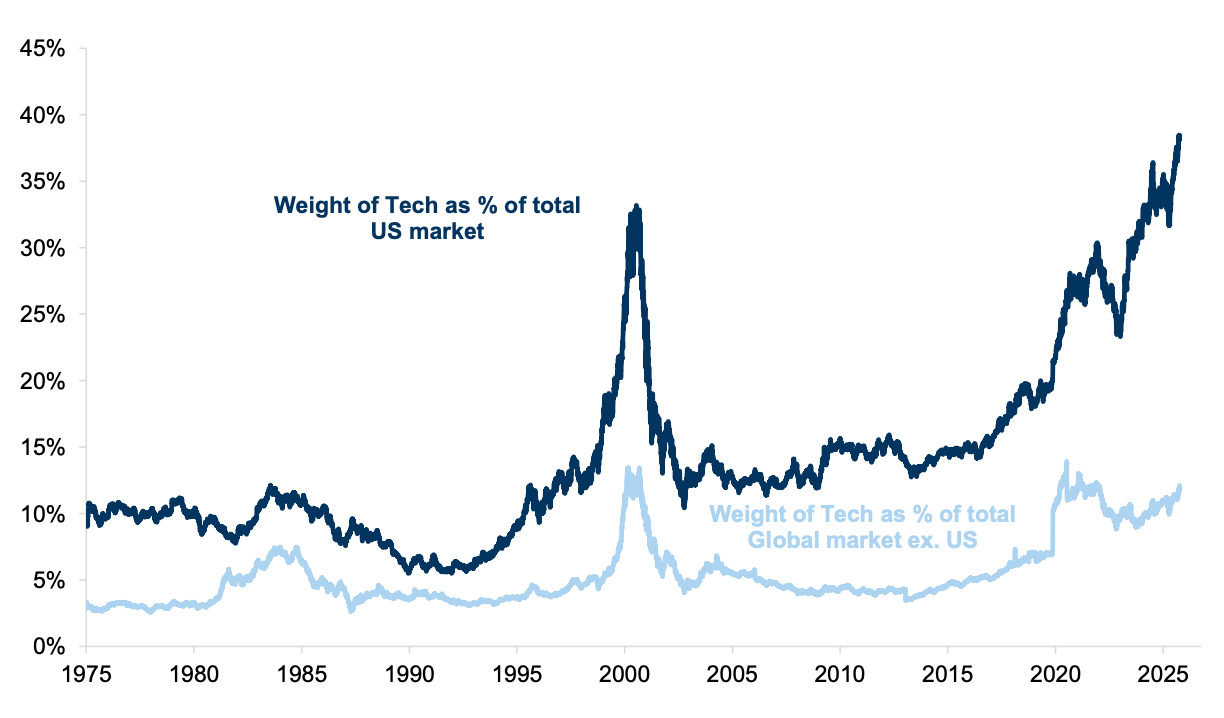
Much of this is explained by the sustained outperformance of the technology sector, which has reached a record share of the US index (although much less in other parts of the world) (Exhibit 14).
Exhibit 14: Technology represents a higher share of the US market than it does in other regions
At the same time, the sustained outperformance of a few companies has also resulted in record market concentration (at least in the US).
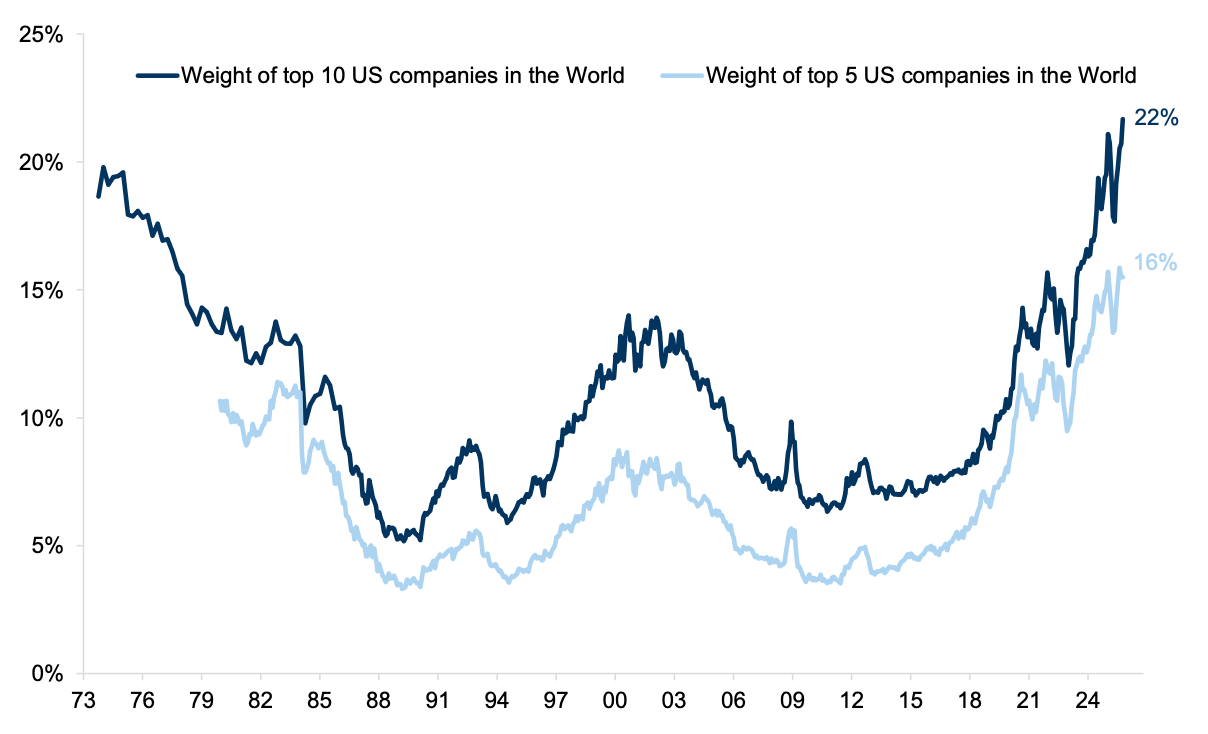
The combination of country, sector and stock concentration has resulted in the 10 biggest US companies making up nearly one quarter of the global public equity market.
Exhibit 15: In the US the biggest 10 companies account for almost a quarter of the value of the global equity market
Weight of biggest US companies in global market cap
This degree of concentration is, in our view, unsustainable and has been central to our view on diversification, but this is not the same as saying that we are experiencing a bubble, that technology cannot remain the dominant sector or, indeed, that the leading companies in technology cannot remain good investments.
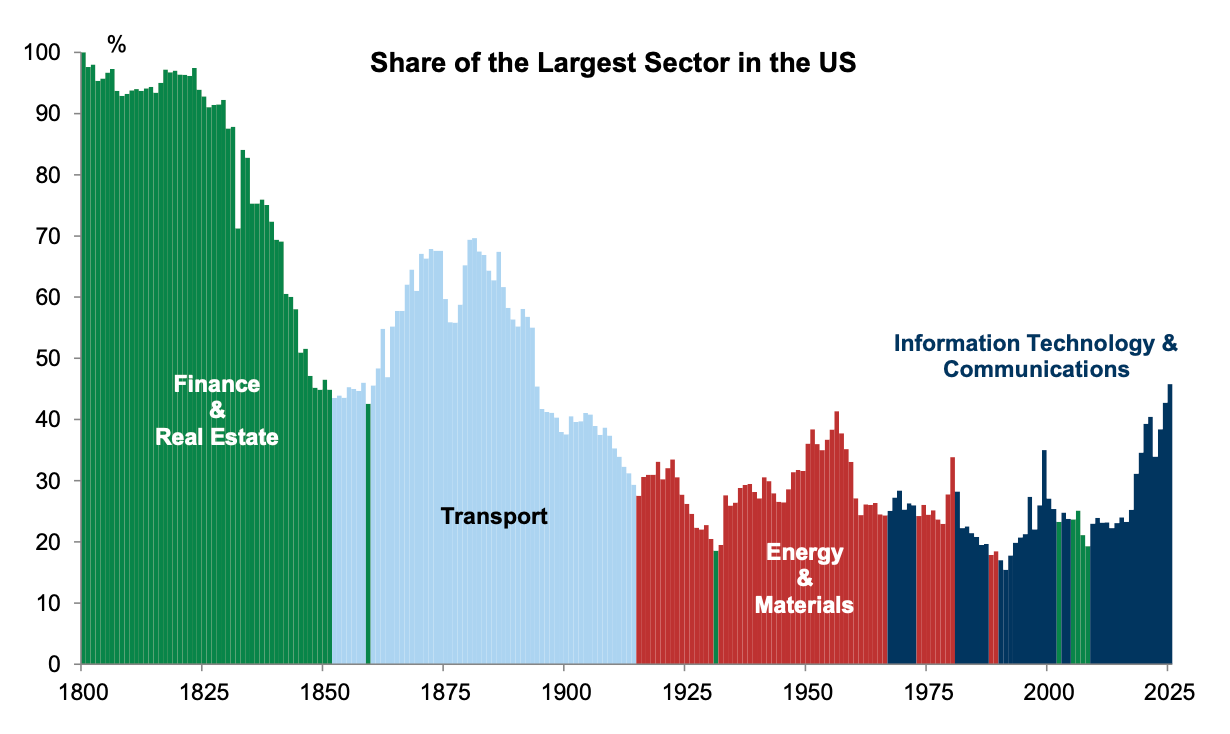
Importantly, there have been many periods of high market concentration in the past that have not ended with a bubble bursting. Indeed, historically the biggest sector has remained dominant for long periods of time, reflecting the key economic driver over time. There have been four long periods of sector dominance since the early nineteenth century punctuated, briefly, by the banks prior to the financial crisis (which did end in a bubble bursting).
1800-1850s: Financials
Over this period banks were the biggest sector. Starting with almost 100% of the equity market, the stock market developed and broadened out. By the 1850s, the sector’s weight had more than halved.
1850s-1910s: Transport
As banks started to finance the thriving railroad system in the US (and elsewhere for that matter), transport stocks took over as the largest in the index. In their boom years, transport stocks reached close to 70% of the index in the US before fading to around one-third of the market capitalisation by World War 1.
1920s-1970s: Energy
With the huge growth of industry, powered by oil rather than steam and coal, energy stocks took over as the biggest sector. This remained the main sector group until the 1990s, although interspersed with brief periods of leadership from the emerging technology sector (in the first wave it was led by mainframes and, subsequently, by software).
1980s-now: Technology
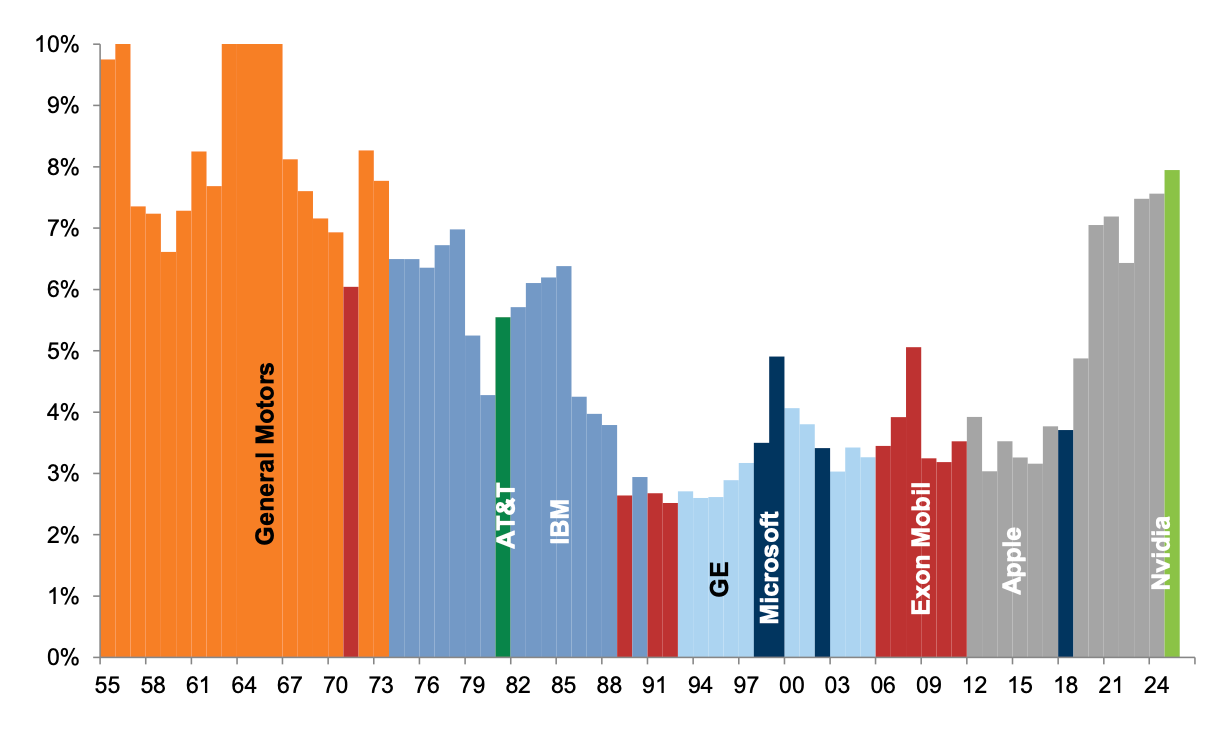
Technology has generally been among the biggest sectors in the US (although not in all other countries) since the emergence of mainframe computing in the 1970s (briefly beaten by the banks sector in the run-up to the financial crisis). Of course, the leaders in the technology space have changed over this period. IBM was the biggest company as mainframes drove the data revolution in the mid-1980s, Microsoft became the biggest company as software became the main driver of technology in the 1990s, and then Apple took over as the biggest company in the 2000s, and it has only recently been overtaken by Nvidia.
There have been cycles, with the run-up to the tech bubble in 2000 and the collapse of tech thereafter. However, as we see in Exhibit 16, technology soon returned as the biggest sector (with the exception of the brief period when banks took over as the biggest sector in the run-up to the financial crisis).
Exhibit 16: The biggest sector accounts for a smaller share as stock markets become more diversified
Share of the biggest sector in the US
Q6: I understand that technology may remain the main driver of returns, but what about the current group of dominant companies?
A: The pattern of market dominance is not unique to the current revolution in technology: several companies in the past have come to dominate their respective industries on the back of a major innovation or technology cycle. The evolution of the technology sector throughout history tends to show how, ultimately, it can be a ‘winner takes all’ market:
- Standard Oil, for example, controlled over 90% of oil production in the US by 1900 and 85% of sales.
- Bell Telecom had reached 90% of US households by 1969. Just before it relinquished control of the Bell Operating Companies and was split into different companies in 1982, it reached 5.5% of the market.
- Between 1955 and 1973, General Motors’ earnings were more than 10% of the S&P 500. At its peak, General Motors had a 50% market share in the US and was the world’s largest automaker from 1931 through to 2007.
- As mainframe computers developed in the 1970s, there was a significant concentration of market share: IBM had over a 60% market share in mainframe computers in 1981.
- As software took over as the main driver of technology, there was yet another shift in domination. By 2000, Microsoft had a 97% share in operating systems given its dominance in the PC and laptop markets.
The largest company in the index has historically belonged to the dominant sector at any time (Exhibit 17). Typically, it has also tended to maintain its size relative to the market until either regulation (anti-trust) intervenes to reduce market dominance or the incumbent company loses out to a nimbler new entrant with a more cutting-edge technology.
Exhibit 17: The largest companies tend to belong to the dominant sector of the time
% Market Cap (% Net Income before 1974)
In the current environment, the risk to the largest companies is more likely to come from increased competition. It has been common historically for new companies to emerge in the technology sector that challenge incumbents and eventually dominate new products and technologies over time, particularly in the US. For example, just over 10% of the Fortune 500 companies have remained on the list since 1955.
Based on this history, it would appear reasonable to assume the Fortune 500 list in 60 years from now will include very few of the current dominant companies — at least in their current form and structure. A plethora of new companies will be formed in emerging industries we cannot even imagine today. None of the 10 largest companies in the S&P 500 in 1985 were still in the top 10 in 2020, and only one from the list in 2000 remained in the top 10 in 2020. This suggests that there are good reasons to diversify portfolio exposures to offset the concentration effect but it does not necessarily point to an excessive bubble.
Q7: But what about the huge rise in capex spending for the dominant companies?
A: Surging investment and capex has certainly been a typical feature of technology bubbles in the past. Companies at the epicentre of a major technological innovation often fail to achieve the returns that their high valuations imply as the marginal cost of the technology falls and capacity increases over time. Equally, a typical overlooked opportunity is that investors understate the returns available to new entrants in an industry that emerge after the initial investments are made, and can piggyback on the capex of others by providing new products and services able to leverage the new embedded technology.
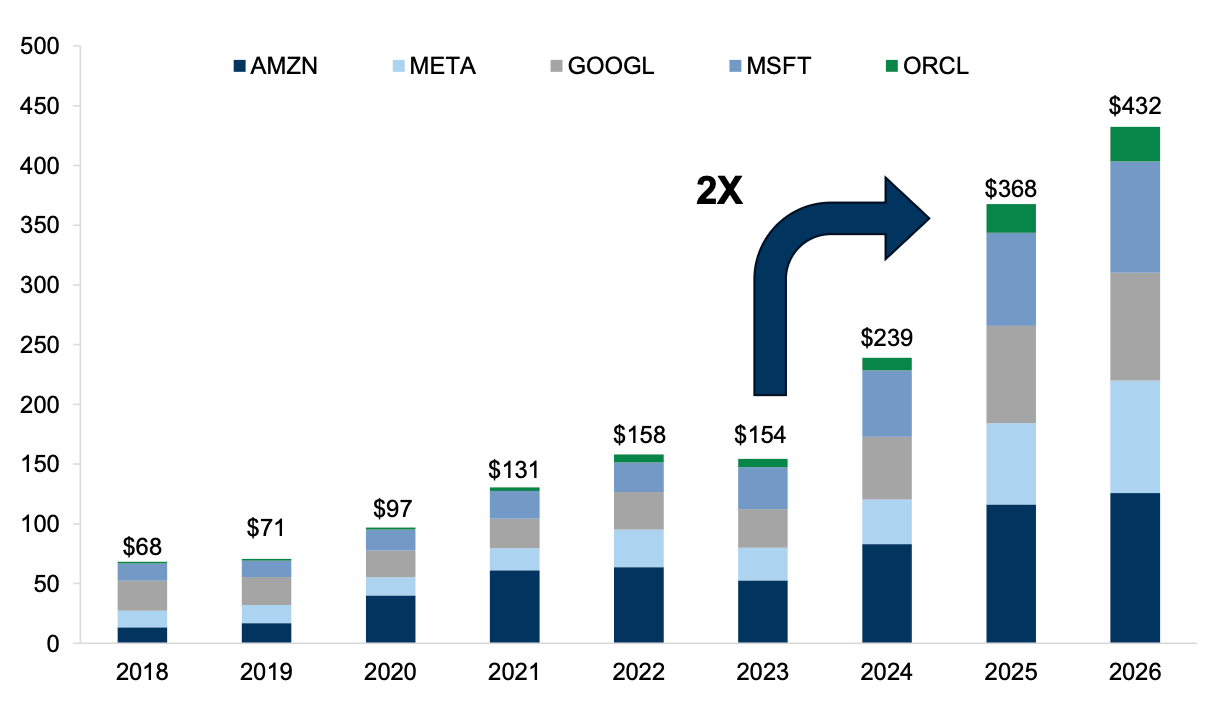
There is a risk of over-investment by the current set of incumbents. They have generated extraordinary profit growth and ROE in recent years while adopting a relatively light capital intensity model, but have been rapidly increasing their capex spend since the emergence of Chat GPT (Exhibit 18), and there is a growing risk that the future returns that they achieve on this capital is less than the market is currently implying.
Exhibit 18: Capex spending has rapidly increased since ChatGPT emerged
Hyperscaler annual capex ($ billion). 2025 and 2026 reflect consensus estimates
The problem of increased competition and overspend by incumbents was evident in the early days of the internet and in the bubble that followed. While there was widespread and broad speculation in any new company that offered potential exposure to the industry, the incumbent winners were generally seen to be the telecom companies, which had the benefit of being well-established companies, in many cases former monopolies or state-run enterprises, with low volatility earnings and an existing and large-scale client base.
They also had tangible assets and owned and developed fibre-optic networks, routers, wireless systems and telecoms equipment that were the underlying infrastructure of the internet. They appeared to be perfectly placed to receive a high share of the future revenues driven by the internet in e-shopping. But the telecom companies were in a ‘in it to win it world’ – each had to spend on capacity to remain in the race with the possibility of winning huge potential rewards.
Ultimately, as with many other technology innovations, too much capacity was built – a problem that mimicked the railway bubbles and canal bubbles of previous periods. According to the Federal Communications Commission, the amount of fibre-optic cable laid in the US went from one million miles in 1996 to 10 million by 2000. Increasingly, competition forced prices down and by 2004 the cost of bandwidth had fallen by more than 90%, despite internet usage doubling every few years. As late as 2005, as much as 85% of broadband capacity in the US was still going unused.
Q8: And how about the financing of the capex?
A: One crucial vulnerability comes via how the capex is financed; debt financing and vendor financing have created the most problems historically. In the 1990s a lot of the investment boom was equity financed, and in some ways we think this is why the bursting of the tech bubble led to relatively little economic/systemic spillover. The equity finance was via a huge boom in share issuance, with both IPOs and additional secondary offerings to the market (Exhibit 19 and Exhibit 20).
Exhibit 19: European Telecoms financed a huge capex boom in the 1990s via equity issuance...
Number of IPOs and secondary offerings on a 12-month sum basis
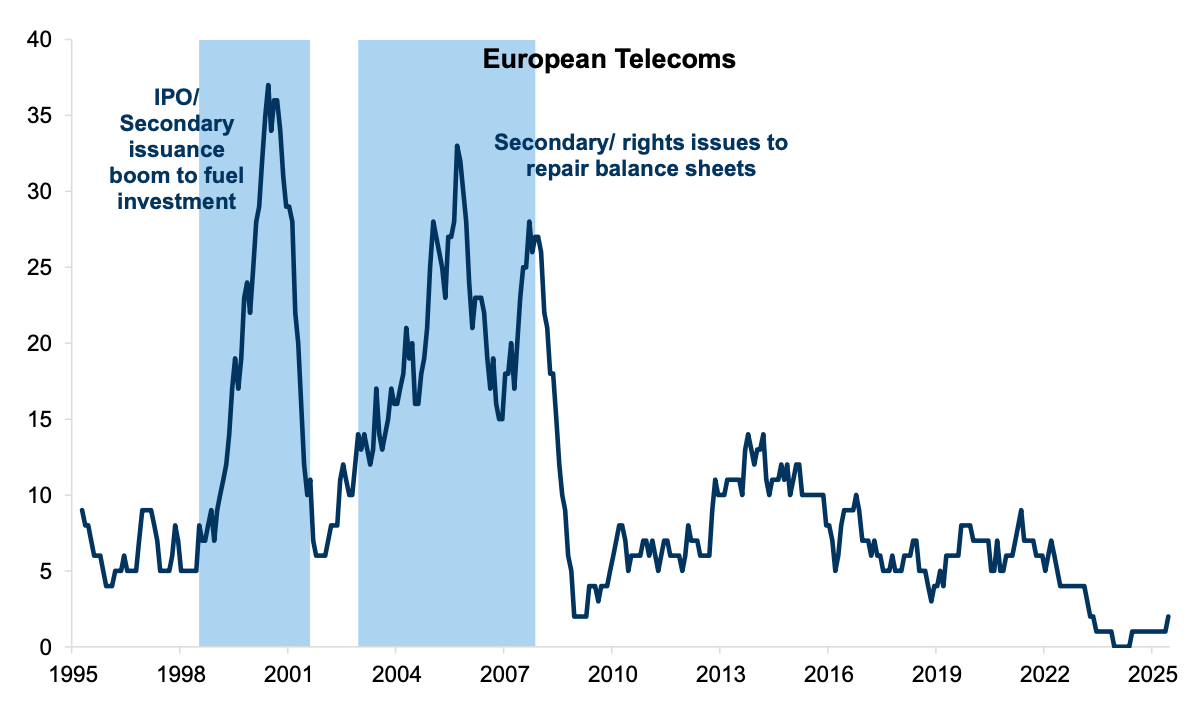
Exhibit 20: ...as did US tech stocks in the 1990s, whereas today US equity issuance has been relatively subduded
Number of IPOs and secondary offerings on a 12-month sum basis
That is not to say there was no debt finance in the 1990s – there were a few examples. When Global Crossing and WorldCom collapsed, they had $25bn and $100bn of debt. In the UK, a spending spree occurred after the government allowed 3G spectrum auctions in April 2000 that generated £22.5bn in revenues for the government, and similar auctions in Germany raised roughly $30bn. Ultimately, however, the capex boom resulted in severe overcapacity in bandwidth for internet usage. While the fixed costs of these new networks were very high, the marginal costs of sending signals over them was very low. Many companies could not repay their significant debts in the US and some of the auctions for 3G licences in 1999 had to be re-run because the original companies that had made the bids defaulted on their bids. When the auction was re-run, the bids were only 10% of the original $4bn raised.
Ultimately, the valuation of these companies collapsed, alongside the broader technology bubble. Between 2000 and 2002, the Dow Jones technology index lost 86% and the wireless communications index dropped 89%, with 23 companies going bankrupt in the US alone, and the failure of WorldCom became the biggest stock market failure in history with a loss of $102bn in July 2002.
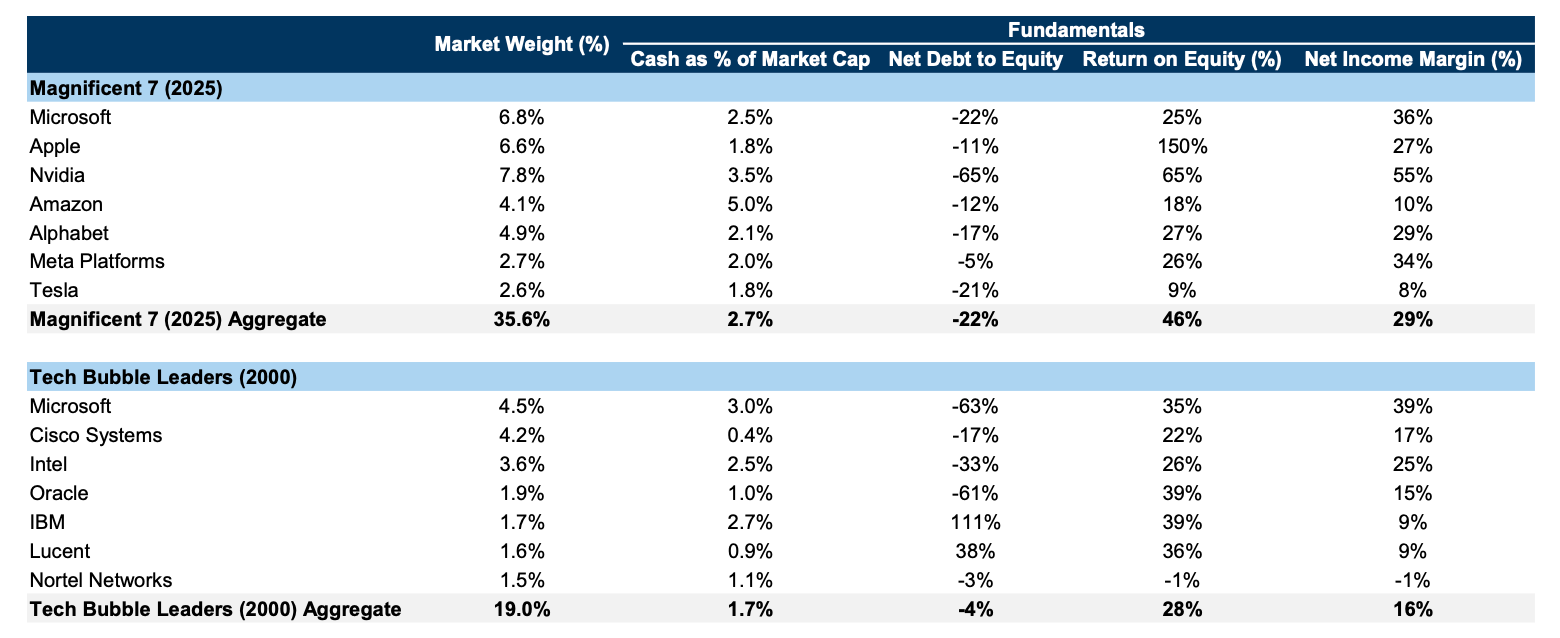
The dominant AI companies today are unusual as most of their capex is financed by free cash flow rather than debt. And their balance sheets remain exceptionally strong (Exhibit 21).
Exhibit 21: The current dominant companies are much more profitable and have stronger balance sheets than those that dominated during the tech bubble
Next 12 month estimate for Big Tech & last 12 months for Tech Bubble
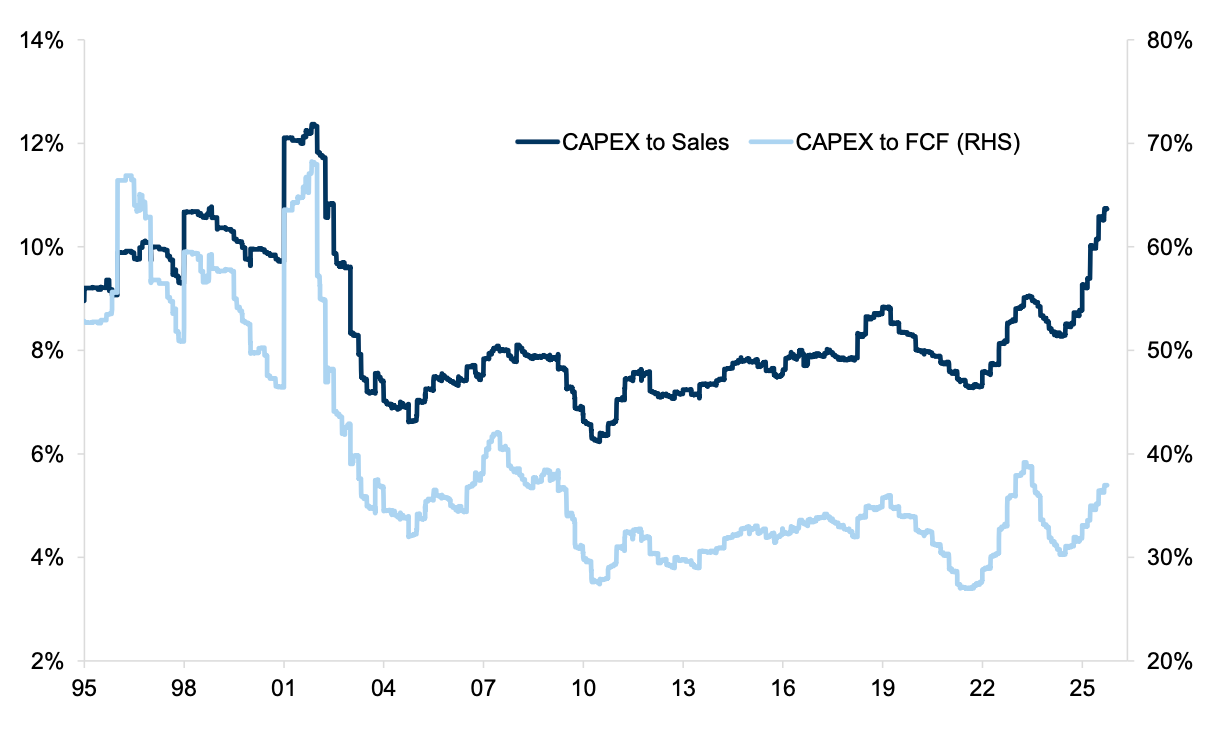
While the capex to sales ratio for US tech is rising rapidly, the ratio of capex to free cash flow remains stable and significantly below levels experienced in the late 1990s (Exhibit 22).
Exhibit 22: Capex to sales ratios have risen for US tech - but are still relatively low versus free cash flow...
US Technology
That said, our Credit strategists have highlighted a shift towards debt-financing among the current big tech players as cash reserves dry up. They point to evidence across credit markets, noting $20bn worth of issuance for data center deals in the ABS market since 2024 to both public and private corporate credit markets as well as vendor financing. Furthermore, companies in the GS MT AI basket (GSTMTAIP) have issued $141bn in corporate credit so far this year, surpassing the $127bn issued in all of 2024. Exhibit 23 also highlights how the tech sector dominates the issuance space, with a share much larger than that for the second largest supplier - utlities.
Exhibit 23: Current TMT issuance has surpassed the $127bn issued in 2024
USD Gross supply of TMT AI basket equities
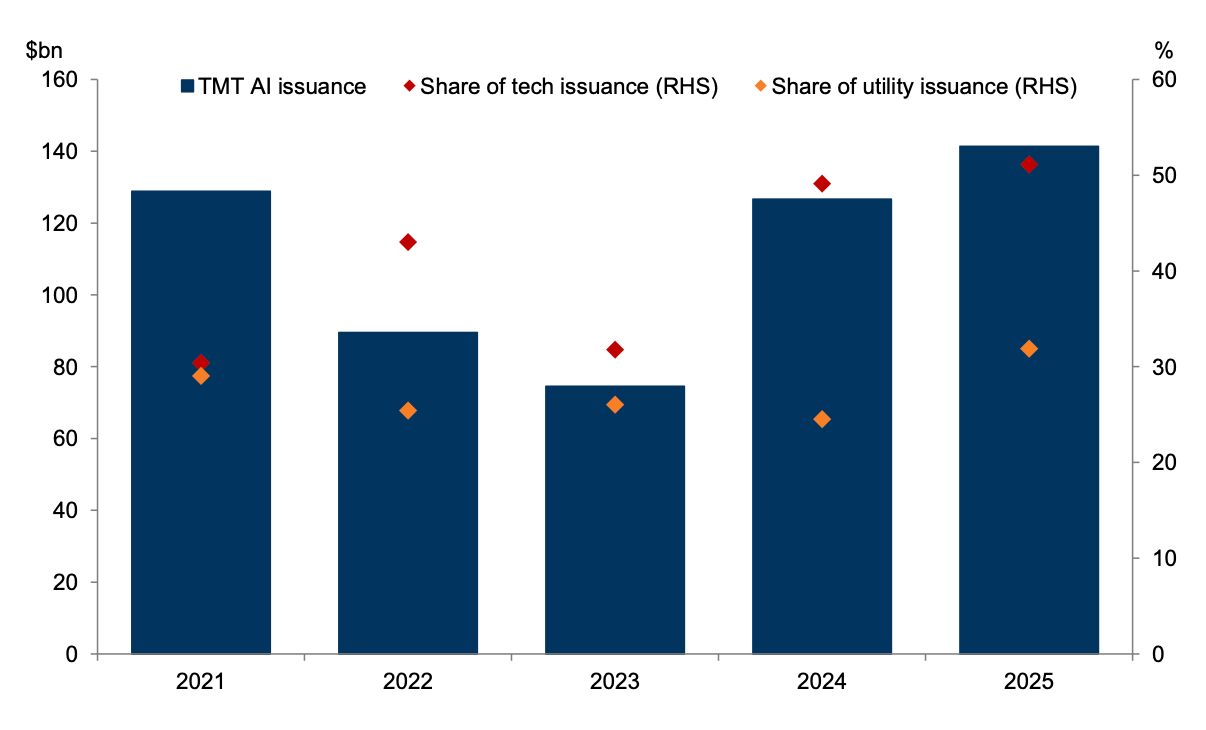
GSTMTAIP is a basket developed by GS Global Banking & Markets
Our credit strategists also point to normalizing liquidity positions for hyperscalers amid increased appetite for capex spending, but they highlight how today’s big tech balance sheets are strengthened by high cash flows and low leverage. It remains possible that these companies do not achieve an adequate return on their investment but this is less likely to have a systemic impact on the broader economy as we have seen in the past when a bubble bursts because their balance sheets remain strong. Equally, banks balance sheets are strong, reducing the likelihood of second round effects from any stock specific de-rating.
See more: Framing the AI Narrative – Five Key Debates About Industry Trends and Market Environment
Q9: So if it isn’t a bubble, what should investors do?
A: There is still a risk that we end in a bubble but, on balance, we don’t think we are in one yet.
Also, if investors started to lose faith or patience in the AI theme, there is a smaller risk of an economy-wide effect that in many previous bubble episodes because private sector balance sheets remain relatively healthy. There is less leverage or debt that is financing the current spending boom and, importantly, banks’ balance sheets are strong.
None of this would prevent a market correction in the event of a de-rating of technology and AI growth prospects, however. Given these risks, we continue to focus on diversification strategies. This year, this has started to pay off:
- First, despite the lower exposure to technology companies outside of the US, regional performances have been very similar so far this year. At the time of writing, the S&P 500 is up just over 14% - almost exactly the same return in local currency as the Eurostoxx50, the UK, Japan and China; given the dollar’s weakness, we have generally seen non-US equity markets outperform, with some outstripping the US by a significant margin (for example, Germany is up in US dollar terms by roughly +35%, Italy 45%, Spain 50%, Korea 50%).
- Second, a more eclectic mix of factors is beginning to offer a greater opportunity for diversification. While the decade or more after the financial crisis was dominated by ever more concentrated returns in equities led by the US and mega-cap tech, it was also dominated by the bifurcation between ‘growth’ and value’ as a factor. The move towards zero interest rates disproportionately benefited longer duration growth equities, while many of the traditional value sectors faced significant headwinds after the financial crisis as commodity prices fell and banks de-leveraged. However, the opportunity set has also started to broaden out across styles and sectors.
- Third, we have entered an era where the fortunes of the leading technology stocks are increasingly interdependent on the physical infrastructure around them. The surging demand for electricity cannot be solved through an app or piece of software. Real spending in energy generation and distribution is required and that will broaden the growth and return prospects for other industries in, for example, capital goods, energy, resources and even real estate and transport.
- Fourth, returns are likely to broaden out within the technology sector itself. While the leading tech companies of the 2020s will most likely remain dominant in their respective markets, rapid innovation, particularly around machine learning and AI, will likely create a new wave of tech superstars within the technology sector that are able to generate new products and services on the back of the current boom in capex spend.
Explore More Investment Opportunities

For investors seeking undervalued companies with high fundamental quality, our analytics team provides curated stock lists:
📌 50 Undervalued Stocks (Best overall value plays for 2025)
📌 50 Undervalued Dividend Stocks (For income-focused investors)
📌 50 Undervalued Growth Stocks (High-growth potential with strong fundamentals)
🔍 Check out these stocks on the Value Sense platform for free!